

|
시장보고서
상품코드
2122583
생세포 이미징 : 시장 점유율 분석, 업계 동향 및 통계, 성장 예측(2026-2031년)Live Cell Imaging - Market Share Analysis, Industry Trends & Statistics, Growth Forecasts (2026 - 2031) |
||||||
 Mordor Intelligence
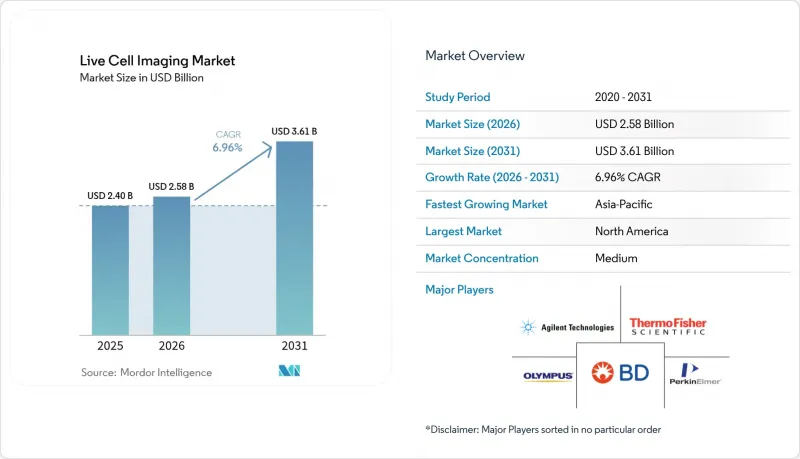
Mordor Intelligence에 의하면, 생세포 이미징 시장 규모는 2025년에 24억 달러로 평가되었습니다. 2026년 25억 8,000만 달러에서 2031년까지 36억 1,000만 달러에 이를 것으로 예상되며, 예측 기간(2026-2031년) CAGR은 6.96%를 나타낼 전망입니다.

본 보고서에서는 업계를 제품별(장비, 소모품, 소프트웨어, 서비스), 용도별(세포 생물학, 발생 생물학, 줄기세포 생물학, 신약 개발, 기타 용도) 및 지역별(북미, 유럽, 아시아태평양, 중동 및 아프리카, 남미)로 분류하고 있습니다. 지난 5년간의 데이터 외에도 향후 5년간 시장 전망도 수록되어 있습니다.
세계의 생세포 이미징 시장 동향 및 인사이트
하이콘텐츠 스크리닝 플랫폼의 발전
현재 하이콘텐츠 스크리닝 시스템에는 웰당 수천 개의 표현형 변수를 몇 분 만에 분석하는 머신러닝 알고리즘이 통합되어 있어, 예전에는 며칠이 걸리던 기존의 엔드포인트 분석을 대체하고 있습니다. 2025년 1월에 출시된 Molecular Devices사의 ImageXpress HCS.ai 플랫폼은 복잡한 세포 표현형을 95%의 정확도로 분류하는 동시에 분석 시간을 60% 단축하고 있습니다(Molecular Devices사). 제약 기업의 연구팀은 이러한 처리 능력을 활용하여 화합물 라이브러리의 스크리닝을 신속하게 반복함으로써, 초기 신약 개발 단계의 예산을 최대 40% 절감하는 동시에 병용 요법 탐색에 자원을 할당할 수 있게 됩니다. 이와 유사한 자동화 기술은 오가노이드를 기반으로 한 정밀 의학도 지원하고 있으며, 환자 유래 종양 모델을 활용해 수십 종의 약물 후보에 대한 병렬 시험을 수행함으로써, 수동 이미징 워크플로우로는 비용 면에서 실현할 수 없었던 환자 개개인에 맞춘 치료 경로를 밝혀냅니다.
암·면역학 연구 자금의 급증
2024년에는 입법적 예산 배분을 통해 연구 자금이 확대되면서 첨단 영상 기술에 대한 수요가 높아졌습니다. 미국 국립암연구소(NCI)는 2024 회계연도에 72억 2,000만 달러의 예산을 확보했는데, 이는 2023년보다 1억 2,000만 달러 증가한 금액이며, 그 상당 부분이 영상 도구의 혁신에 할당되었습니다. 2025년에는 미국 국방부가 전립선암 대책에 6억 5,000만 달러를 배정했으며, 이 분야에서도 광학 진단과 실시간 세포 모니터링이 중점 사항으로 꼽혔습니다. 이러한 자금을 통해 학술 연구 거점의 조달 주기가 가속화되었으며, 생세포 이미징이 연구비 지원 신청의 표준 기법으로 자리 잡았고, 코호트 간 면역·종양 상호작용을 비교하기 위해 통일된 이미징 프로토콜에 의존하는 다기관 공동 연구가 촉진되고 있습니다.
높은 도입 및 유지 비용
AI가 통합된 첨단 공초점 현미경이나 격자 광시트 현미경의 정가는 보통 50만-150만 달러이며, 서비스 계약에는 매년 구매 가격의 10-15%가 추가됩니다. 소모품(특수 배지, 마이크로플레이트, 환경 제어실 등)으로 인해 이용 빈도가 높은 핵심 시설의 경우 연간 운영비가 5만 달러를 초과하기도 합니다. 신흥 시장의 연구소에서는 관세나 환율 변동으로 인해 20-30%의 할증료를 지불해야 하는 경우가 있어, 연구 보조금 예산을 압박하고 장비 업그레이드가 지연될 수 있습니다. 그 결과, 장비 공유 모델이 보급되고 있지만, 이용 시간의 제약으로 인해 연구자들은 실험 설계나 처리 능력 목표를 타협할 수밖에 없어 시장 내 추가적인 확산이 저해되고 있습니다.
부문별 분석
2025년, 제약 업계 및 학술 기관의 구매자들이 고처리량 자동화를 우선시한 결과, 장비는 생세포 이미징 시장의 43.65%를 차지하여 생세포 이미징 시장 규모 약 10억 5,000만 달러에 달했습니다. 요코가와(Yokogawa)의 CQ3000과 같은 시스템은 공초점, 명시야, 위상차 모드를 단일 섀시에 통합하여, 분석 설계자가 시료를 옮기지 않고도 각 모드를 전환할 수 있습니다. 하드웨어에 내장된 클라우드 기반 분석 기능 덕분에 테라바이트 규모의 이미지를 거의 실시간으로 분석할 수 있게 되어, 수동 배치 처리로 인한 대기 시간이 해소되었습니다. 한편, 라벨 프리 홀로토모그래피용으로 최적화된 배지, 마이크로 패턴화된 멀티웰 플레이트, 형광증백제 안정화 버퍼와 같은 소모품은 연평균 성장률(CAGR) 7.63%라는 눈부신 기세로 시장을 확대되고 있습니다. 각 벤더사는 장기간의 조사 하에서도 세포의 생리 기능을 유지할 수 있도록 시약을 조정하고 있으며, 이는 이전에는 pH나 산소 분압의 변동으로 어려움을 겪었던 1주일에 걸친 오가노이드 연구에서 중요합니다. 소프트웨어는 여전히 매출에서 차지하는 비중이 가장 작지만, 원시 이미지 스택을 실용적인 표현형으로 변환하는 AI 모듈을 활용하기 때문에 전략적인 영향력을 가지고 있습니다. 알고리즘 업데이트와 연동된 구독형 라이선싱을 통해, 하드웨어 보급이 포화 상태에 이른 후에도 벤더는 지속적인 수익을 확보할 수 있습니다.
두 번째 동향은 소형화입니다. 라이카의 벤치탑형 ‘Mica Microhub’는 온도 및 CO2 제어, 환경 적응형 자동 초점, AI 분할 기능을 기존 광시야 장치보다 65% 더 작은 설치 면적에 통합하고 있습니다. 이러한 컴팩트함 덕분에 붐비는 인큐베이터 통로의 공간을 확보할 수 있어, 생물안전 수준이 요구되는 환경에 도입하기가 용이해집니다. 장비 밀도가 높아짐에 따라 소모품 수요는 급격히 증가합니다. 예전에는 현미경 2대를 운영하던 같은 연구실에서도 현재는 6대를 운영하고 있을 가능성이 있으며, 각각 전용 챔버 슬라이드와 교정 키트가 필요합니다. 여러 기기에 걸친 플릿 관리를 총괄하는 소프트웨어 스택이 필수적이며, 카테고리 간의 경계는 더욱 모호해지고 있습니다.
세포 생물학은 유전체학, 단백질체학, 대사 연구에서 수행하는 기초적인 역할을 고려할 때, 2025년 매출의 28.10%를 계속 차지했습니다. 연구자들은 노화 연구와 관련된 대사 스트레스 모델 하에서 세포 골격의 재구성, 미토콘드리아의 역학, 오토파지의 흐름을 관찰하기 위해 생세포 이미징을 활용하고 있습니다. 한편, 신약 개발 분야는 8.23%라는 가장 높은 연평균 성장률(CAGR)을 기록하고 있으며, 2031년까지 생세포 이미징 시장 점유율을 더욱 확대될 전망입니다. 제약 기업들은 오가노이드의 공동 배양과 하이콘텐츠 분석을 결합하여, AI 스크리닝 과정을 뒷받침하는 표현형이 풍부한 데이터 세트를 생성하고 있습니다. 이러한 접근 방식을 통해 독성 위험을 조기에 식별함으로써, 전임상 단계의 ‘히트에서 리드’까지의 과정에서 탈락률을 낮추는 데 성공하고 있습니다.
줄기세포 및 발생 생물학 분야의 활용 사례도 증가하고 있으며, 이는 분화 경로의 시간 경과에 따른 이미징이 필요한 재생 의학 파이프라인에 힘입고 있습니다. 홀로토모그래피를 통해 연구자는 외인성 표지자를 사용하지 않고도 장기 규모의 형태 형성을 3D로 시각화할 수 있게 되었으며, 이는 조직 특이적 구조를 검증하는 데 있어 매우 중요합니다. 암 면역학 분야에서는 연구자들이 T 세포와 환자 유래 종양 오가노이드를 공동 배양하고, 면역 시냅스의 형성을 정량화하여 면역 요법의 투여 요법을 결정하는 지침으로 삼고 있습니다. 신경생물학의 최첨단 분야에서는 칼슘 표지 염료와 초당 100프레임의 스캐너를 결합함으로써, 피질 오가노이드에서 시냅스 발화 패턴을 밀리초 단위가 아닌 수 분 단위로 매핑하는 것이 가능해졌습니다.
지역별 분석
2025년, 북미는 생세포 이미징 시장에서 매출의 41.80%를 차지하며 시장을 선도했습니다. 이는 5-7년마다 장비를 교체할 수 있도록 지원하는 미국 국립보건원(NIH) 및 국방부의 보조금에 힘입은 결과입니다. 일류 대학들은 다기관 공동 암 임상시험에서 경쟁력을 유지하기 위해 HCS(고처리량 스크리닝) 장비군을 정기적으로 갱신하고 있습니다. 2025년 1월에 발표된 광학 이미징 의약품에 관한 지침 초안에 드러난 FDA의 적극적인 태도는 규제상의 명확성을 제공하며, 세라노스틱 이미징에 초점을 맞춘 상업적 연구 개발 및 스핀오프 기업을 뒷받침하고 있습니다. 매사추세츠주, 캘리포니아주, 온타리오주에 위치한 대형 제약사의 캠퍼스에는 공급업체들이 집중되어 있어, 기능 도입을 가속화하는 신속한 피드백 루프가 형성되어 있습니다. 그러나 이 분야를 선도하는 기관 대부분이 이미 2세대 AI 지원 현미경을 도입함에 따라 성장은 정체 국면에 접어들고 있습니다. 향후 매출은 신규 거점 도입보다는 교체 및 소프트웨어 라이선스 확대에 의존하게 될 것입니다.
아시아태평양은 세계 최고 수준인 연평균 성장률(CAGR) 8.87%를 나타낼 것으로 예측됩니다. 일본은 2028년까지 민간 바이오기술 자본을 두 배로 늘리고, 2030년까지 15조 엔 규모의 바이오기술 경제를 달성하겠다는 방침입니다. 해당 로드맵에서는 세포 치료의 상용화를 위한 핵심 요소 중 하나로 이미징 인프라가 구체적으로 언급되고 있습니다. 중국은 새로운 CGT 제조 단지 내에 GMP 규정을 준수하는 이미징 스위트를 확충하고 있으며, 현지 전자기기 제조 능력을 활용하여 하위 조립품을 생산함으로써 비용을 절감하고 있습니다. 아세안(ASEAN)의 의료기기 규제 조화를 통해 국경을 초월한 조달 장벽이 낮아지면서, 싱가포르에 거점을 둔 CRO가 표준화된 영상 프로토콜을 활용해 지역 내 임상시험에 대응할 수 있게 되었습니다.
유럽에서는 독일, 스위스, 영국에 거점을 둔 다국적 제약 기업을 핵심으로 견고한 도입 기반이 유지되고 있습니다. ‘호라이즌 유럽(Horizon Europe)’ 보조금은 대륙을 횡단하는 컨소시엄을 장려하고 있으며, 재현성을 확보하기 위해 모든 컨소시엄이 통일된 이미징 플랫폼을 도입할 것을 요구하고 있습니다. 환경 관리 이니셔티브를 통해 수은 램프에 비해 최대 30%의 전력 소비를 줄일 수 있는 LED 조명 시스템이 장려되고 있으며, 이는 EU 그린 딜의 목표에 부합하는 것입니다. 유럽의약품청(EMA)의 영상 바이오마커에 관한 협의는 동반 진단 개발을 위한 하드웨어 투자의 정당성을 한층 더 높여주고 있습니다. 총 GDP 성장세는 둔화되고 있지만, 연구의 우수성을 평가하는 순위에서 영상 진단 능력이 점점 더 중요시됨에 따라 장비의 교체 주기는 견조한 추세를 보이고 있습니다.
기타 혜택 :
- 엑셀 형식 시장 예측(ME) 시트
- 3개월간의 애널리스트 지원
자주 묻는 질문
목차
제1장 서론
제2장 조사 방법
제3장 주요 요약
제4장 시장 구도
제5장 시장 규모 및 성장 예측
제6장 경쟁 구도
제7장 시장 기회 및 향후 전망
KTH 26.09.08According to Mordor Intelligence, the live cell imaging market size was valued at USD 2.4 billion in 2025 and estimated to grow from USD 2.58 billion in 2026 to reach USD 3.61 billion by 2031, at a CAGR of 6.96% during the forecast period (2026-2031).
This report Segments the Industry Into by Product (Equipment, Consumables, Software and Services), by Application (Cell Biology, Developmental Biology, Stem Cell Biology, Drug Discovery, Other Applications) and Geography (North America, Europe, Asia-Pacific, Middle East and Africa, South America). Get Five Years of Historical Data Alongside Five-Year Market Forecasts.
Global Live Cell Imaging Market Trends and Insights
Advances in High-Content Screening Platforms
High-content screening systems now integrate machine-learning algorithms that dissect thousands of phenotypic variables per well in minutes, replacing traditional endpoint assays that once required days. Molecular Devices' ImageXpress HCS.ai platform, launched in January 2025, classifies complex cellular phenotypes with 95% accuracy while shrinking analysis time by 60% Molecular Devices. Pharmaceutical teams leverage such throughput to iterate compound libraries rapidly, trimming early discovery budgets by up to 40% and freeing resources to explore combination therapies. The same automation supports organoid-based precision medicine, where patient-derived tumor models undergo parallel testing against dozens of drug candidates, revealing bespoke treatment paths that would have been cost-prohibitive under manual imaging workflows.
Surge in Cancer & Immunology Research Funding
Legislative appropriations widened research coffers in 2024, lifting demand for sophisticated imaging. The National Cancer Institute received USD 7.22 billion for fiscal 2024, USD 120 million more than 2023, earmarking a substantial slice for imaging tool innovation. In 2025 the U.S. Department of Defense allocated USD 650 million for prostate-cancer initiatives, again highlighting optical diagnostics and real-time cellular monitoring. These funds accelerate procurement cycles at academic cores, position live cell imaging as standard practice in grant proposals, and catalyze multi-center trials that rely on harmonized imaging protocols to compare immune-tumor interactions across cohorts.
High Acquisition & Maintenance Costs
Advanced confocal or lattice-light-sheet microscopes embedded with AI typically list at USD 500,000-1.5 million, and service contracts add 10-15% of purchase price each year. Consumables-specialized media, microplates, environmental chambers-can drive annual operating outlays above USD 50,000 for busy core facilities. Emerging-market laboratories sometimes pay 20-30% premiums owing to customs duties and volatile exchange rates, stretching grant budgets and delaying upgrades. Consequently, shared-instrument models proliferate, but time-slot constraints can force scientists to compromise experimental design or throughput goals, muting wider market penetration.
Other drivers and restraints analyzed in the detailed report include:
- Growing Adoption of AI-Assisted Image Analytics
- Expansion of Contract Bio-Manufacturing for CGT
- Shortage of Skilled Imaging Specialists
For complete list of drivers and restraints, kindly check the Table Of Contents.
Segment Analysis
Equipment captured 43.65% of the live cell imaging market in 2025, translating to roughly USD 1.05 billion of the live cell imaging market size, as pharmaceutical and academic buyers prioritized high-throughput automation. Systems such as Yokogawa's CQ3000 consolidate confocal, bright-field, and phase-contrast modes in a single chassis, letting assay designers pivot between modalities without sample transfer. Cloud-based analytics embedded inside hardware now parse terabytes of images in near real time, eliminating manual batching queues. Meanwhile, consumables-media optimized for label-free holotomography, micro-patterned multi-well plates, and fluorophore-stabilization buffers-advance at a brisk 7.63% CAGR. Vendors tailor reagents to preserve cellular physiology under long-term illumination, important for week-long organoid studies that previously suffered drift in pH and oxygen tension. Software remains the smallest monetary slice but wields strategic clout because it unlocks AI modules that convert raw image stacks into actionable phenotypes. Subscription licensing tied to algorithm updates ensures vendors book recurring revenue even after hardware saturation.
A second dynamic involves miniaturization. Leica's bench-top Mica Microhub combines temperature and CO2 regulation, environmental-adaptive auto-focus, and AI segmentation inside a footprint 65% smaller than legacy wide-field rigs. Such compactness frees space in crowded incubator corridors and facilitates deployment in biosafety-level environments. As equipment density rises, demand for consumables scales multiplicatively-the same lab that once ran two microscopes may now operate six, each requiring dedicated chamber slides and calibration kits. Software stacks that orchestrate fleet management across multiple devices become mandatory, further blending categories.
Cell biology retained 28.10% of 2025 revenue given its foundational role across genomics, proteomics, and metabolic studies. Investigators exploit live cell imaging to observe cytoskeletal reorganization, mitochondrial dynamics, and autophagy flux under metabolic stress models pertinent to aging research. Drug discovery, however, posts the strongest 8.23% CAGR and is on course to command a larger slice of live cell imaging market share by 2031. Pharmaceutical groups marry organoid co-cultures with high-content analytics, generating phenotype-rich datasets that feed AI screening funnels. The approach has trimmed attrition in pre-clinical hit-to-lead phases by surfacing toxicity liabilities earlier.
Stem-cell and developmental-biology use cases also ascend, buoyed by regenerative-medicine pipelines that demand longitudinal imaging of differentiation pathways. Holotomography enables researchers to visualize organ-scale morphogenesis in 3D without exogenous labels, crucial for verifying tissue-specific architecture. In cancer-immunology, researchers co-culture T-cells with patient-derived tumor organoids to quantify immune synapse formation, guiding immunotherapy dosing regimens. The frontier of neurobiology benefits from calcium-indicator dyes paired with 100-frame-per-second scanners that map synaptic firing patterns in cortical organoids over minutes instead of milliseconds.
Complete Report Scope:
- By Product Type
- Equipment
- Consumables
- Software
- By Technology
- Time-lapse Microscopy
- Fluorescence Resonance Energy Transfer (FRET)
- Fluorescence Recovery After Photobleaching (FRAP)
- High-content / High-content Analysis (HCA)
- By Application
- Cell Biology
- Stem Cells & Developmental Biology
- Drug Discovery & Screening
- Cancer & Immunology Research
- Neurobiology
- By End User
- Pharmaceutical & Biotechnology Companies
- Academic & Research Institutes
- Contract Research Organisations (CROs)
- By Geography
- North America
- United States
- Canada
- Mexico
- Europe
- Germany
- United Kingdom
- France
- Italy
- Spain
- Rest of Europe
- Asia-Pacific
- China
- India
- Japan
- South Korea
- Australia
- Rest of Asia-Pacific
- South America
- Brazil
- Argentina
- Rest of South America
- Middle East and Africa
- GCC
- South Africa
- Rest of Middle East and Africa
- North America
Geography Analysis
North America led the live cell imaging market with 41.80% revenue in 2025, sustained by NIH and Department of Defense grants that subsidize equipment turnover every 5-7 years. Top-tier universities routinely refresh HCS fleets to maintain competitiveness for multi-center oncology trials. The FDA's proactive stance-evident in January 2025 draft guidance on optical-imaging drugs-provides regulatory clarity that spurs commercial R&D spin-outs focused on theranostic imaging. Large pharmaceutical campuses in Massachusetts, California, and Ontario cluster around suppliers, fostering rapid feedback loops that accelerate feature roll-outs. Yet growth is plateauing as most category-leading institutions already operate second-generation AI-ready microscopes; future sales lean on replacement and software-license expansions rather than new-site installs.
Asia-Pacific is projected to record a 8.87% CAGR, the fastest globally. Japan aims to double private biotech capital by 2028, targeting a 15-trillion-yen biotechnology economy by 2030; the roadmap specifically lists imaging infrastructure as a pillar toward cell-therapy commercialization. China expands GMP-grade imaging suites inside new CGT manufacturing parks, using local electronics capability to fabricate sub-assemblies and moderate costs. Harmonized ASEAN medical-device regulations lower barriers for cross-border procurement, letting Singapore-based CROs serve regional trials with standardized imaging protocols.
Europe maintains a robust installed base anchored by pharmaceutical multinationals in Germany, Switzerland, and the United Kingdom. Horizon-Europe grants encourage pan-continental consortia, all of which must deploy harmonized imaging platforms to ensure reproducibility. Environmental stewardship initiatives incentivize LED-illuminated systems that reduce power consumption by up to 30% versus mercury bulbs, aligning with EU Green Deal targets. European Medicines Agency consultations on imaging biomarkers further legitimize hardware investments geared toward companion-diagnostic development. Despite slower aggregate GDP growth, refurbishment cycles remain healthy because research excellence rankings increasingly weigh imaging capacity.
- Danaher (Leica, Molecular Devices)
- Carl Zeiss
- Nikon Corp.
- Olympus Corp.
- PerkinElmer
- Thermo Fisher Scientific
- Sartorius
- Yokogawa Electric Corp.
- Becton Dickinson & Co.
- Etaluma Inc.
- Merck
- Oxford Instruments
- Phasefocus Ltd
- Nanolive
- Biotek Instruments
- Bruker Corp.
- Keyence Corp.
- ACQUIFER Imaging
- CytoSMART Technologies
- Logos Biosystems
Additional Benefits:
- The market estimate (ME) sheet in Excel format
- 3 months of analyst support
TABLE OF CONTENTS
1 Introduction
- 1.1 Study Assumptions & Market Definition
- 1.2 Scope of the Study
2 Research Methodology
3 Executive Summary
4 Market Landscape
- 4.1 Market Overview
- 4.2 Market Drivers
- 4.2.1 Advances in high-content screening platforms
- 4.2.2 Surge in cancer & immunology research funding
- 4.2.3 Growing adoption of AI-assisted image analytics
- 4.2.4 Expansion of contract bio-manufacturing for CGT
- 4.2.5 Miniaturisation of live-cell microscopes
- 4.2.6 Rising demand for label-free imaging modalities
- 4.3 Market Restraints
- 4.3.1 High acquisition & maintenance costs
- 4.3.2 Shortage of skilled imaging specialists
- 4.3.3 Phototoxicity & photobleaching limitations
- 4.3.4 Data-storage & management bottlenecks
- 4.4 Value / Supply-Chain Analysis
- 4.5 Regulatory Landscape
- 4.6 Technological Outlook
- 4.7 Porter's Five Forces
- 4.7.1 Threat of New Entrants
- 4.7.2 Bargaining Power of Suppliers
- 4.7.3 Bargaining Power of Buyers
- 4.7.4 Threat of Substitutes
- 4.7.5 Competitive Rivalry
5 Market Size & Growth Forecasts (Value)
- 5.1 By Product Type
- 5.1.1 Equipment
- 5.1.2 Consumables
- 5.1.3 Software
- 5.2 By Technology
- 5.2.1 Time-lapse Microscopy
- 5.2.2 Fluorescence Resonance Energy Transfer (FRET)
- 5.2.3 Fluorescence Recovery After Photobleaching (FRAP)
- 5.2.4 High-content / High-content Analysis (HCA)
- 5.3 By Application
- 5.3.1 Cell Biology
- 5.3.2 Stem Cells & Developmental Biology
- 5.3.3 Drug Discovery & Screening
- 5.3.4 Cancer & Immunology Research
- 5.3.5 Neurobiology
- 5.4 By End User
- 5.4.1 Pharmaceutical & Biotechnology Companies
- 5.4.2 Academic & Research Institutes
- 5.4.3 Contract Research Organisations (CROs)
- 5.5 By Geography
- 5.5.1 North America
- 5.5.1.1 United States
- 5.5.1.2 Canada
- 5.5.1.3 Mexico
- 5.5.2 Europe
- 5.5.2.1 Germany
- 5.5.2.2 United Kingdom
- 5.5.2.3 France
- 5.5.2.4 Italy
- 5.5.2.5 Spain
- 5.5.2.6 Rest of Europe
- 5.5.3 Asia-Pacific
- 5.5.3.1 China
- 5.5.3.2 India
- 5.5.3.3 Japan
- 5.5.3.4 South Korea
- 5.5.3.5 Australia
- 5.5.3.6 Rest of Asia-Pacific
- 5.5.4 South America
- 5.5.4.1 Brazil
- 5.5.4.2 Argentina
- 5.5.4.3 Rest of South America
- 5.5.5 Middle East and Africa
- 5.5.5.1 GCC
- 5.5.5.2 South Africa
- 5.5.5.3 Rest of Middle East and Africa
- 5.5.1 North America
6 Competitive Landscape
- 6.1 Market Concentration
- 6.2 Market Share Analysis
- 6.3 Company Profiles (includes Global level Overview, Market level overview, Core Segments, Financials as available, Strategic Information, Market Rank/Share for key companies, Products & Services, and Recent Developments)
- 6.3.1 Danaher (Leica, Molecular Devices)
- 6.3.2 Carl Zeiss AG
- 6.3.3 Nikon Corp.
- 6.3.4 Olympus Corp.
- 6.3.5 PerkinElmer Inc.
- 6.3.6 Thermo Fisher Scientific
- 6.3.7 Sartorius AG
- 6.3.8 Yokogawa Electric Corp.
- 6.3.9 Becton Dickinson & Co.
- 6.3.10 Etaluma Inc.
- 6.3.11 Merck KGaA (Sigma-Aldrich)
- 6.3.12 Oxford Instruments plc
- 6.3.13 Phasefocus Ltd
- 6.3.14 Nanolive SA
- 6.3.15 BioTek Instruments
- 6.3.16 Bruker Corp.
- 6.3.17 Keyence Corp.
- 6.3.18 ACQUIFER Imaging
- 6.3.19 CytoSMART Technologies
- 6.3.20 Logos Biosystems
7 Market Opportunities & Future Outlook
- 7.1 White-space & Unmet-Need Assessment


