

|
시장보고서
상품코드
2122671
석유 및 가스용 센서 : 시장 점유율 분석, 업계 동향 및 통계, 성장 예측(2026-2031년)Sensors In Oil And Gas - Market Share Analysis, Industry Trends & Statistics, Growth Forecasts (2026 - 2031) |
||||||
 Mordor Intelligence
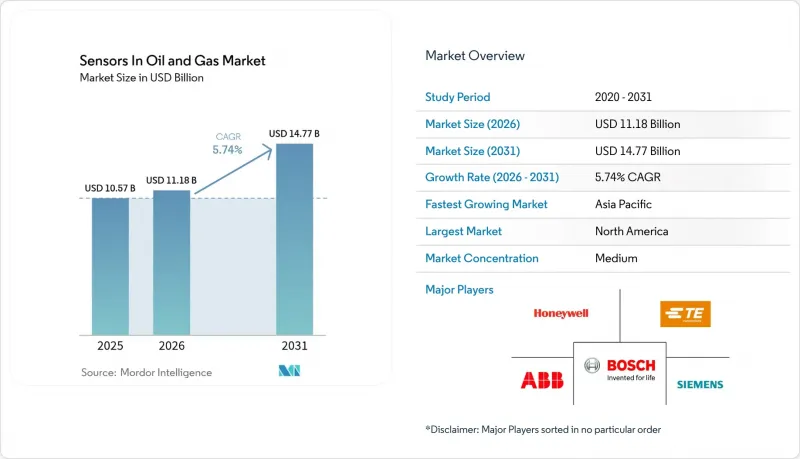
Mordor Intelligence에 의하면, 2026년 석유 및 가스용 센서 시장 규모는 111억 8,000만 달러로 추정되고 2025년 105억 7,000만 달러에서 확대해, 2031년에는 147억 7,000만 달러에 이를 것으로 예측됩니다.
2026-2031년 동안 연평균 성장률(CAGR) 5.74%로 성장할 것으로 전망됩니다.

본 보고서는 센서 유형(가스, 온도, 초음파, 기타), 연결 방식(유선, 무선), 활동 분야(업스트림 부문, 중류 부문, 하류 부문), 용도(공정 안전·ESD, 파이프라인 모니터링, 시추 최적화, 기타), 지역별로 분류되어 있습니다. 시장 전망은 금액(달러) 기준으로 제시되어 있습니다.
세계의 석유 및 가스용 센서 시장 동향 및 인사이트
디지털 트윈을 활용한 예측 유지보수
현재, 전 세계 주요 기업들은 클라우드에서 호스팅되는 디지털 트윈과 엣지 분석을 결합하여 펌프, 압축기, 터빈의 고장을 미연에 방지하고 있습니다. Saudi Aramco는 AI 모델과 연동된 수천 개의 센서를 도입함으로써 Khurais의 전력 수요를 18% 절감하고 점검 시간을 40% 단축했습니다. 기존에는 하루에 수백만 달러의 비용이 발생하던 회전 장비의 가동 중단 시간은 사업자가 일정상의 간격이 아닌 이상 징후 점수에 따라 수리 일정을 잡게 됨에 따라 감소하고 있습니다. 이러한 도입이 가장 빠르게 진행되고 있는 곳은 예기치 못한 가동 중단으로 인해 물류 비용이 두 배로 늘어나는 해양 자산입니다. 이러한 프로젝트에서는 다중 물리 시뮬레이션이 요구되므로, 센서와 모델링 소프트웨어를 세트로 판매하는 벤더는 교차 판매 기회를 얻고 있습니다. 초기 ROI 실적을 바탕으로 예산 배분이 ‘시간 기반 유지보수’에서 ‘상태 기반 유지보수’로 전환되고 있으며, 견고하고 자가 진단 기능을 갖춘 장치에 대한 장기적인 수요가 확고해지고 있습니다.
통합형 안전 계장 시스템에 대한 수요 증가
IEC 61511 준수와 관련하여, 현재 가스, 화염, 셧다운 루프를 통합한 플랫폼이 권장되고 있습니다. MSA의 S5000 감지기는 사우디아라비아에서 현지 조립되며, SIL 2 인증을 유지하면서 교정 주기를 2년으로 연장하고 있습니다. 서로 다른 안전 계층이 공통 프로토콜에서 작동함으로써 현장 방문 횟수가 감소하고 시동 검사가 신속해진다는 점이 사업자들로부터 보고되고 있습니다. 안전 대책을 실시간 경보와 연동함으로써 보험사와 규제 당국의 요구 사항을 모두 충족시키기 위해, 병목 현상 해소를 추진 중인 정유시설 및 LNG 플랜트에서 투자 열기가 가장 뜨겁습니다. 현지 제조 거점을 보유한 솔루션 제공업체는 위험 구역에서의 승인 절차를 신속하게 처리하고 있으며, 이는 국내 생산을 의무화하고 있는 걸프 연안 국가들에서 결정적인 우위를 점하고 있습니다. 최근 발생한 플레어링 사고로 인해 높아진 위험 인식으로 인해, 브라운필드 확장에 발맞추어 확장 가능한 안전 기반에 대한 예산 배분이 더욱 우선시되고 있습니다.
업스트림 부문의 설비 투자 주기의 변동성
센서 도입은 종종 상품 가격 변동에 좌우됩니다. 2020년부터 2023년에 걸친 가격 하락기에는 많은 독립 기업들이 계측 예산을 최대 25% 삭감하고, WTI가 배럴당 70달러 이상으로 안정될 때까지 브라운필드 업그레이드를 연기했습니다. 석유 및 가스용 센서 시장의 성장은 수년에 걸친 프로그램에 의존하기 때문에 시장의 급등락은 신규 플랫폼의 수량 확대를 방해하고 공급업체의 손익분기점 달성 시기를 늦추게 됩니다. 대형 국제 석유 기업(IOC)은 운영 비용(OPEX)을 디지털 전환의 경비 항목에 포함시켜 프로젝트를 보호하고 있지만, 그럼에도 현금을 확보하기 위해 조달을 단계적으로 실시했습니다. 벤더 측은 비용을 분산시키는 리스 모델이나 성과 연계형 계약을 제공함으로써 대응하고 있지만, 그 도입 현황은 지역별로 여전히 편차를 보이고 있습니다.
부문별 분석
압력 측정 기기는 2025년 매출의 26.35%를 차지했으며, 유정 헤드의 초크 모니터링에서 인도 계량 스키드에 이르기까지 석유 및 가스용 센서에서 그 보편성이 두드러집니다. 초음파 유량계는 규모는 작지만, 비침습적 설계로 인해 유지보수가 줄어들고 교정 루프가 간소화됨에 따라 연평균 성장률(CAGR) 6.5%로 확대되고 있으며, 이는 LNG 및 다상 파이프라인에서 중요한 이점이 되고 있습니다. 온도, 유량, 레벨 계측 기기는 질량 에너지 수지 계산에서 기초적인 역할을 바탕으로 안정적인 성장 궤도를 유지하고 있습니다. 예측 유지보수 프로그램의 보급에 따라 진동 센서에 대한 관심이 다시 높아지고 있는 한편, 멀티 가스 어레이는 배출 규제 강화를 호재로 삼고 있습니다.
구매자들은 압력, 온도, 진동을 하나의 하우징에 통합한 트랜스듀서 제품군을 점점 더 선호하고 있으며, 이를 통해 관통 부위가 줄어들어 누출 및 배출 위험이 감소합니다. 공급업체들은 여러 요소를 동시에 선형화하는 ASIC 기반 신호 체인으로 이에 대응하여, 10년에 걸친 드리프트를 대폭 줄이고 있습니다. 원격 헤드의 경우, 배터리 최적화된 MEMS 압력 셀이 현재 1µA 이하의 절전 전류를 실현하여 무선 노드의 현장 작동 수명을 5년 이상으로 연장하고 있습니다. 시스템 통합사업자는 이러한 진전을 활용하여 통합 대시보드를 제공함으로써, 단일 화면에서 공정 이상과 설비의 만성적인 피로 간의 상관관계를 쉽게 파악할 수 있도록 하고 있습니다.
유선 백본은 여전히 도입된 엔드포인트의 71.10%를 차지하고 있지만, 무선 노드는 연평균 성장률(CAGR) 7.12%로 증가하고 있으며, 이는 석유 및 가스용 센서 시장의 기준 성장률의 2배에 해당합니다. 각 사업자는 시추 비용이 센서 구입 비용을 초과하는 기존 설비의 개보수 시, WirelessHART와 ISA100 메쉬 토폴로지를 우선적으로 채택하고 있습니다. 걸프 연안 지역의 거대 정유시설에서 초기 단계의 5G 프라이빗 네트워크를 통해 5밀리초 이하의 결정론적 지연이 입증되어, 비중요 루프에서 폐쇄 루프 제어가 가능해졌습니다.
배터리 화학 기술의 발전과 에너지 수확을 통해 유지보수 차량의 출동 횟수가 줄어들었고, 스마트한 전력 관리를 통해 노드의 가동 주기가 수개월에서 수년으로 연장되었습니다. 보안은 여전히 제약 요인으로 남아 있지만, 칩 수준의 루트 오브 트러스트 모듈과 무선 펌웨어 업데이트의 조합을 통해 현재는 IEC 62443의 감사 요건을 충족하고 있습니다. 실시간 위치 정보 서비스가 동일한 주파수 대역을 공유함으로써, 사업자는 추가 인프라 없이도 직원 안전 확보에 있어 이중의 이점을 얻을 수 있습니다. 이러한 이점들이 결합되어, 금세기 말까지 무선 기술이 에지 모니터링 계층에서 코어 제어 계층으로 그 역할을 확대해 나갈 기반이 되고 있습니다.
지역별 분석
북미는 2025년 매출의 38.40%를 차지했습니다. 이는 셰일 산업에서 실시간 지층 및 생산 데이터에 대한 수요와, 첨단 가스 감지 기술 도입을 촉진하는 EPA의 엄격한 누출 규제를 반영한 것입니다. 미국의 주요 석유 기업들은 전사적인 디지털화 도입을 주도하고 있는 반면, 캐나다의 사업자들은 오일샌드 업그레이드 시설에 극저온 대응 압력 및 레벨 계측 장비를 사후 설치하고 있습니다. 멕시코에서는 광구 자유화로 인해 선택적인 수요가 발생하고 있지만, 자금 조달 문제와 파이프라인 병목 현상으로 인해 그 성장세는 제한되고 있습니다.
아시아태평양은 석유 및 가스용 센서 부문에서 가장 빠르게 성장하고 있는 지역으로, 연평균 성장률(CAGR)은 6.95%에 달할 전망입니다. 이는 신규 그린필드 및 브라운필드 시설 전반에 지능형 센싱을 도입하려는 중국의 정책과, 이더넷 APL 지원 계측 장비가 필요한 인도의 정유시설 개보수가 뒷받침하고 있습니다. 인도네시아와 필리핀의 LNG 수입 터미널에서는 불균형에 관한 분쟁을 줄이기 위해 캐스터디 트랜스퍼용 초음파 유량계가 채택되고 있습니다. 베트남의 2024년 에너지 디지털화 계획에는 허가 절차의 90%를 온라인으로 전환하는 내용이 포함되어 있어, 실시간 데이터 전송용 센서 조달이 간접적으로 촉진되고 있습니다.
유럽에서는 북해의 사업자들이 고성능 진동 및 부식 방지 솔루션이 필요한 노후화된 플랫폼 문제에 직면함에 따라 시장이 완만한 성장세를 유지하고 있습니다. EU 그린딜 관련 법에 따라 연속 배출량 모니터링으로의 전환이 정착되면서, 해당 지출 규모가 확대되고 있습니다. 중동의 생산자들은 ‘라이트하우스 정유시설’ 개념을 도입하고 있으며, 고밀도 센서 그리드를 통해 18%의 에너지 절감을 실현한 아람코(Aramco) 시설이 그 실증 사례입니다. 아프리카의 신흥 산유 지역에서는 기존의 유선 레이아웃을 뛰어넘어 무선 기술을 우선시하고 엣지 분석을 통합한 설계를 채택하는 그린필드 프로젝트가 증가하고 있으며, 장기적인 탄소 배출 책임 제도에 대비해 자산을 정비하고 있습니다.
기타 혜택
- 엑셀 형식 시장 예측(ME) 시트
- 3개월간의 애널리스트 지원
자주 묻는 질문
목차
제1장 서론
제2장 조사 방법
제3장 주요 요약
제4장 시장 구도
제5장 시장 규모 및 성장 예측
제6장 경쟁 구도
제7장 시장 기회 및 향후 전망
KTH 26.09.08According to Mordor Intelligence, sensors in oil and gas market size in 2026 is estimated at USD 11.18 billion, growing from 2025 value of USD 10.57 billion with 2031 projections showing USD 14.77 billion, growing at 5.74% CAGR over 2026-2031.
This report is Segmented by Sensor Type (Gas, Temperature, Ultrasonic, and More), Connectivity (Wired and Wireless), Activity (Upstream, Midstream, and Downstream), Application (Process Safety and ESD, Pipeline Monitoring, Drilling Optimization, and More), and Geography. The Market Forecasts are Provided in Terms of Value (USD).
Global Sensors In Oil And Gas Market Trends and Insights
Digital-twins-enabled Predictive Maintenance
Global majors now pair cloud-hosted twins with edge analytics to pre-empt pump, compressor, and turbine failures. Saudi Aramco trimmed power needs 18% and slashed inspection times 40% at Khurais by embedding thousands of sensors linked to AI models. Rotating equipment downtime, historically costing millions of USD per day, is falling as operators schedule repairs based on anomaly scores instead of calendar intervals. Adoption spreads fastest in offshore assets where logistics costs multiply unscheduled stoppages. Because these projects demand multi-physics simulation, vendors that bundle sensors with modeling software gain cross-sell leverage. Early ROI evidence is shifting budget lines from time-based to condition-based maintenance, locking in long-term demand for resilient, self-diagnosing devices.
Rising Demand for Integrated Safety-Instrumented Systems
IEC 61511 compliance now favors unified platforms that converge gas, flame, and shutdown loops. MSA's S5000 detector, locally assembled in Saudi Arabia, extends calibration intervals to two years while retaining SIL 2 certification. Operators report fewer site visits and faster startup testing when disparate safety layers run over a common protocol. Investment momentum is highest in refineries and LNG plants undergoing debottlenecking, as tying safety to real-time alarms satisfies both insurers and regulators. Solution providers with local build centers speed up hazardous-area approvals, a decisive advantage in Gulf states mandating in-country value. Heightened risk awareness after recent flaring incidents further cements budget priority for expandable safety backbones that scale with brownfield expansions.
Volatility in Upstream CAPEX Cycles
Sensor rollouts often sit at the mercy of commodity swings. During 2020-2023 price dips, many independents trimmed instrumentation budgets by up to 25%, deferring brownfield upgrades until WTI stabilized above USD 70/bbl. Because sensors in oil and gas market growth relies on multi-year programs, turbulence hampers volume ramps for new platforms, elongating supplier breakeven horizons. Larger IOCs shield projects by rolling OPEX into digital transformation line items, yet even they staged procurement in phases to preserve cash. Vendors counteract by offering leasing models and outcome-based contracts that spread costs, but uptake remains uneven across regions.
Other drivers and restraints analyzed in the detailed report include:
- Acceleration of Deep-water and Subsea Projects Post-COVID
- Increasing Shale Automation in North America
- Cyber-security Vulnerabilities in Wireless Sensor Networks
For complete list of drivers and restraints, kindly check the Table Of Contents.
Segment Analysis
Pressure devices owned 26.35% of 2025 revenue, underscoring their omnipresence from wellhead choke monitoring to custody transfer skids across the sensors in oil and gas market. Ultrasonic meters, while smaller in base, are expanding at 6.5% CAGR as non-intrusive designs cut maintenance and simplify calibration loops, a critical advantage in LNG and multiphase pipelines. Temperature, flow, and level instruments maintain stable trajectories, protected by their foundational role in mass-energy balance calculations. Vibration sensors enjoy renewed interest as predictive maintenance programs proliferate, while multi-gas arrays ride emissions mandates.
Buyers increasingly favor consolidated transducer suites that blend pressure, temperature, and vibration into one housing, shrinking penetration points and lowering fugitive emission risks. Suppliers respond with ASIC-based signal chains that linearize multiple elements simultaneously, slashing drift across a 10-year horizon. For remote heads, battery-optimized MEMS pressure cells now boast sub-1 µA sleep currents, extending field life beyond five years in wireless nodes. Integrators leverage these gains to present unified dashboards, easing correlation of process excursions and chronic equipment fatigue in a single pane of glass.
Although wired backbones still represent 71.10% of installed endpoints, wireless nodes are climbing at a 7.12% CAGR, double the baseline sensors in oil and gas market growth. Operators prioritize WirelessHART and ISA100 mesh topologies for brownfield retrofits where trenching costs eclipse sensor outlays. Early 5G private networks in Gulf mega-refineries showcase deterministic latency under 5 ms, enabling closed-loop control in non-critical loops.
Battery chemistry strides plus energy harvesting cut maintenance truck rolls; smart power management extends node duty cycles from months to years. Security remains the gating factor, yet chip-level root-of-trust modules paired with over-the-air firmware updates now satisfy IEC 62443 auditors. As real-time location services piggy-back on the same spectrum, operators gain dual workforce safety benefits without extra infrastructure. These combined advantages underpin wireless' climb from edge monitoring to core control layers by the decade's close.
Complete Report Scope:
- By Sensor Type
- Gas
- Temperature
- Ultrasonic
- Pressure
- Flow
- Level
- Vibration
- By Connectivity
- Wired
- Wireless
- By Activity
- Upstream
- Midstream
- Downstream
- By Application
- Process Safety and ESD
- Pipeline Monitoring
- Drilling Optimization
- Emissions Monitoring
- By Geography
- North America
- United States
- Canada
- Mexico
- South America
- Brazil
- Argentina
- Rest of South America
- Europe
- United Kingdom
- Germany
- France
- Italy
- Spain
- Netherlands
- Rest of Europe
- Asia-Pacific
- China
- Japan
- South Korea
- India
- ASEAN
- Rest of Asia-Pacific
- Middle East and Africa
- Middle East
- Saudi Arabia
- United Arab Emirates
- Turkey
- Rest of Middle East
- Africa
- South Africa
- Nigeria
- Kenya
- Rest of Africa
- Middle East
- North America
Geography Analysis
North America held 38.40% of 2025 revenue, reflecting shale's appetite for real-time formation and production data and strict EPA leak rules that elevate advanced gas sensing. U.S. supermajors spearhead enterprise-wide digital rollouts, while Canadian operators retrofit oil-sands upgraders with extreme-cold pressure and level instruments. Mexico's liberalized acreage adds selective demand, tempered by financing hurdles and pipeline bottlenecks.
Asia-Pacific is the sensors in oil and gas market's fastest-rising arena at 6.95% CAGR, buoyed by China's policy to embed intelligent sensing across new green- and brownfield facilities and India's refinery upgrades that require Ethernet-APL-ready instrumentation. LNG import terminals in Indonesia and the Philippines adopt custody-transfer ultrasonic meters to cut imbalance disputes. Vietnam's 2024 digital plan for energy vaults entails 90% online permitting, indirectly stimulating sensor procurement for live data feeds.
Europe sustains moderate gains as North Sea operators grapple with aging platforms that demand high-spec vibration and corrosion solutions. EU Green Deal legislation cements the switch to continuous emissions monitoring, widening addressable spend. Middle East producers embrace lighthouse refinery concepts, proven by Aramco facilities that showcase 18% energy savings via dense sensor grids. Africa's nascent basins weigh in with greenfield orders that leapfrog legacy hard-wired layouts in favor of wireless-first, edge-analytics designs, preparing their assets for long-term carbon accountability regimes.
- ABB Ltd.
- Advanced Energy Industries Inc.
- Analog Devices Inc.
- Banner Engineering Corp.
- Baker Hughes Co.
- Danfoss A/S
- Emerson Electric Co.
- Endress+Hauser AG
- General Electric Co. (GE Vernova - Sensing)
- Halliburton Co.
- Honeywell International Inc.
- ifm electronic gmbh
- KROHNE Messtechnik GmbH
- Parker-Hannifin Corp.
- Pepperl + Fuchs SE
- Robert Bosch GmbH
- Rockwell Automation Inc.
- Schlumberger NV
- Schneider Electric SE
- Sensirion Holding AG
- Siemens AG
- SKF AB
- TE Connectivity Ltd.
- Yokogawa Electric Corp.
Additional Benefits:
- The market estimate (ME) sheet in Excel format
- 3 months of analyst support
TABLE OF CONTENTS
1 INTRODUCTION
- 1.1 Study Assumptions and Market Definition
- 1.2 Scope of the Study
2 RESEARCH METHODOLOGY
3 EXECUTIVE SUMMARY
4 MARKET LANDSCAPE
- 4.1 Market Overview
- 4.2 Market Drivers
- 4.2.1 Digital-twins-enabled predictive maintenance
- 4.2.2 Rising demand for integrated safety-instrumented systems
- 4.2.3 Acceleration of deep-water and subsea projects post-COVID
- 4.2.4 Increasing shale automation in North America
- 4.2.5 Edge-AI sensor fusion for real-time asset integrity
- 4.2.6 Methane-leak detection mandates (OGMP 2.0, EPA, EU)
- 4.3 Market Restraints
- 4.3.1 Volatility in upstream CAPEX cycles
- 4.3.2 Cyber-security vulnerabilities in wireless sensor networks
- 4.3.3 Scarcity of IECEx-certified component suppliers
- 4.3.4 Harsh-environment survivability limits for MEMS
- 4.4 Industry Value Chain Analysis
- 4.5 Regulatory Landscape
- 4.6 Technological Outlook
- 4.7 Porter's Five Forces Analysis
- 4.7.1 Bargaining Power of Suppliers
- 4.7.2 Bargaining Power of Consumers
- 4.7.3 Threat of New Entrants
- 4.7.4 Threat of Substitutes
- 4.7.5 Intensity of Competitive Rivalry
5 MARKET SIZE AND GROWTH FORECASTS (VALUE)
- 5.1 By Sensor Type
- 5.1.1 Gas
- 5.1.2 Temperature
- 5.1.3 Ultrasonic
- 5.1.4 Pressure
- 5.1.5 Flow
- 5.1.6 Level
- 5.1.7 Vibration
- 5.2 By Connectivity
- 5.2.1 Wired
- 5.2.2 Wireless
- 5.3 By Activity
- 5.3.1 Upstream
- 5.3.2 Midstream
- 5.3.3 Downstream
- 5.4 By Application
- 5.4.1 Process Safety and ESD
- 5.4.2 Pipeline Monitoring
- 5.4.3 Drilling Optimization
- 5.4.4 Emissions Monitoring
- 5.5 By Geography
- 5.5.1 North America
- 5.5.1.1 United States
- 5.5.1.2 Canada
- 5.5.1.3 Mexico
- 5.5.2 South America
- 5.5.2.1 Brazil
- 5.5.2.2 Argentina
- 5.5.2.3 Rest of South America
- 5.5.3 Europe
- 5.5.3.1 United Kingdom
- 5.5.3.2 Germany
- 5.5.3.3 France
- 5.5.3.4 Italy
- 5.5.3.5 Spain
- 5.5.3.6 Netherlands
- 5.5.3.7 Rest of Europe
- 5.5.4 Asia-Pacific
- 5.5.4.1 China
- 5.5.4.2 Japan
- 5.5.4.3 South Korea
- 5.5.4.4 India
- 5.5.4.5 ASEAN
- 5.5.4.6 Rest of Asia-Pacific
- 5.5.5 Middle East and Africa
- 5.5.5.1 Middle East
- 5.5.5.1.1 Saudi Arabia
- 5.5.5.1.2 United Arab Emirates
- 5.5.5.1.3 Turkey
- 5.5.5.1.4 Rest of Middle East
- 5.5.5.2 Africa
- 5.5.5.2.1 South Africa
- 5.5.5.2.2 Nigeria
- 5.5.5.2.3 Kenya
- 5.5.5.2.4 Rest of Africa
- 5.5.5.1 Middle East
- 5.5.1 North America
6 COMPETITIVE LANDSCAPE
- 6.1 Market Concentration
- 6.2 Strategic Moves
- 6.3 Market Share Analysis
- 6.4 Company Profiles (includes Global level Overview, Market level overview, Core Segments, Financials as available, Strategic Information, Market Rank/Share for key companies, Products and Services, and Recent Developments)
- 6.4.1 ABB Ltd.
- 6.4.2 Advanced Energy Industries Inc.
- 6.4.3 Analog Devices Inc.
- 6.4.4 Banner Engineering Corp.
- 6.4.5 Baker Hughes Co.
- 6.4.6 Danfoss A/S
- 6.4.7 Emerson Electric Co.
- 6.4.8 Endress+Hauser AG
- 6.4.9 General Electric Co. (GE Vernova - Sensing)
- 6.4.10 Halliburton Co.
- 6.4.11 Honeywell International Inc.
- 6.4.12 ifm electronic gmbh
- 6.4.13 KROHNE Messtechnik GmbH
- 6.4.14 Parker-Hannifin Corp.
- 6.4.15 Pepperl + Fuchs SE
- 6.4.16 Robert Bosch GmbH
- 6.4.17 Rockwell Automation Inc.
- 6.4.18 Schlumberger NV
- 6.4.19 Schneider Electric SE
- 6.4.20 Sensirion Holding AG
- 6.4.21 Siemens AG
- 6.4.22 SKF AB
- 6.4.23 TE Connectivity Ltd.
- 6.4.24 Yokogawa Electric Corp.
7 MARKET OPPORTUNITIES AND FUTURE OUTLOOK
- 7.1 White-space and Unmet-Need Assessment


