

|
시장보고서
상품코드
2122834
전문 서비스 자동화 시장 : 시장 점유율 분석, 업계 동향 및 통계, 성장 예측(2026-2031년)Professional Services Automation - Market Share Analysis, Industry Trends & Statistics, Growth Forecasts (2026 - 2031) |
||||||
 Mordor Intelligence
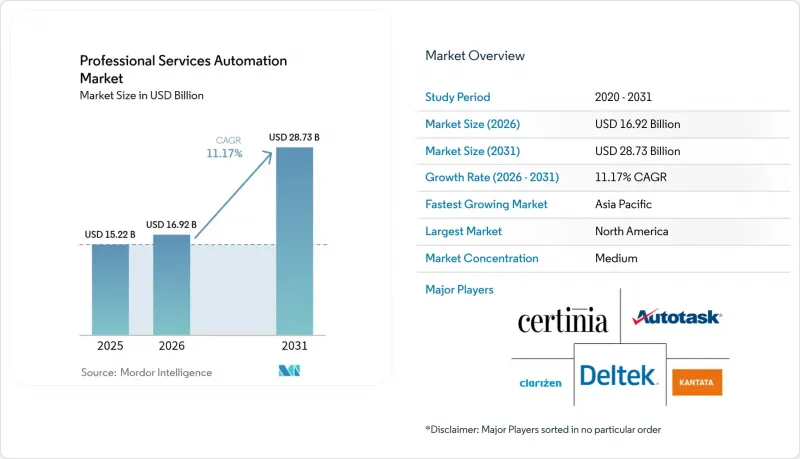
에 의하면, 전문 서비스 자동화(PSA) 시장 규모는 2025년 152억 2,000만 달러로 평가되었고, 2026년에는 169억 2,000만 달러로 추정되고, 2026-2031년 CAGR 11.17%로 성장을 지속할 전망이며, 2031년에는 287억 3,000만 달러에 이를 것으로 예측됩니다.
본 보고서는 도입 형태별(클라우드 및 온프레미스), 구성 요소별(솔루션 및 서비스), 기업 규모별(대기업 및 중소기업), 최종 사용자 산업별(IT 및 통신, BFSI 등), 기능 모듈별(프로젝트 및 자원 관리, 청구·청구서 발행 등), 그리고 지역별로 분류되어 있습니다. 시장 예측은 금액(달러) 기준으로 제시되어 있습니다.
세계의 전문 서비스 자동화(PSA) 시장 동향 및 인사이트
중소기업의 클라우드 PSA 도입
공공 부문의 디지털화 보조금과 SaaS의 손쉬운 도입으로 기존 인프라에 대한 장벽이 제거됨에 따라, 중소기업이 전문 서비스 자동화 시장에서 가장 역동적인 성장을 주도하고 있습니다. 싱가포르의 ‘생산성 솔루션 보조금(Productivity Solutions Grant)’을 통해 구독료의 최대 50%가 지원되므로, 소규모 기업도 과거에는 전 세계 컨설팅 회사만이 이용할 수 있었던 기능에 접근할 수 있게 되었습니다. 초기 성공 사례가 생산성 향상을 입증함으로써 입소문을 통한 선순환이 형성되고, 구독형 가격 책정을 통해 초기 자본 지출(CAPEX)이 관리하기 쉬운 운영 비용(OPEX)으로 전환됨에 따라, 벤더에게는 기능 확충을 뒷받침할 지속적인 현금 흐름이 창출됩니다. Jana Small Finance Bank는 UiPath의 자동화 제품군을 도입한 후 처리 시간을 65-70% 단축했습니다. 이러한 성과는 직원 10명 규모의 기업이라도 엔터프라이즈급 오케스트레이션을 활용할 수 있으며, 각 전문 서비스 부문에서 경쟁의 공정성을 재구축한다는 주장을 뒷받침합니다.
자원 및 이익률의 실시간 가시화 추진
거시경제의 변동으로 인해 기업은 분기별 검토가 아닌 실시간으로 자원 활용률 격차와 이익률 하락 요인을 가시화해야 할 필요성이 대두되고 있습니다. BeyondTrust는 Certinia PSA를 도입하여 상세한 스킬 매트릭스와 실시간 피드백 루프를 결합한 결과, 자원 활용률을 20% 향상시켰습니다. 자원이 과도하게 할당된 엔지니어나 예산이 부족한 마일스톤을 시각화하는 대시보드는 수익성을 훼손하기 전에 비용 초과를 억제합니다. 서로 다른 시간대를 넘나들며 활동하는 프로젝트 팀이 늘어나는 가운데, 즉각적인 차이 알림을 통해 관리자는 납기일을 준수하면서 작업 순서를 재조정할 수 있습니다. 내장된 AI 시뮬레이터는 리소스 배분 시나리오를 엄격하게 검증하여, 요금표 할인이나 범위 변경으로 인해 예상 매출 총이익률이 하락하지 않도록 보장합니다.
멀티테넌트형 클라우드의 데이터 개인정보 보호 문제
GDPR(EU 개인정보보호규정)은 고객 기록, 프로젝트 메모, 직원 근무 시간표를 다루는 멀티테넌트 아키텍처에 대한 감시를 강화하는 엄격한 데이터 저장 위치 및 동의에 관한 규정을 부과하고 있습니다. 규제 대상인 자문 업무에서는 현재 암호화 키, 지역 간 장애 조치, 감사 대응이 가능한 로그 기록을 규정하는 데이터 처리 관련 부속 조항에 대한 협상이 진행되고 있습니다. 하이퍼스케일 클라우드는 SOC 2 및 ISO-27001 인증을 자랑하지만, 일부 고객은 여전히 싱글 테넌트 또는 EU의 주권 구역을 선호하기 때문에 순수한 클라우드 전환이 지연되고 있으며, 단기적으로는 전문 서비스 자동화 시장의 확산이 다소 주춤하고 있습니다.
부문 분석
2025년 현재, 클라우드 도입은 전문 서비스 자동화 시장 규모의 68.72%를 차지했으며, 2031년까지 연평균 성장률(CAGR) 12.88%를 나타낼 것으로 예측됩니다. 이는 온프레미스 맞춤형 구축에서 결정적인 전환을 반영한 것입니다. 자동 패치 적용, 탄력적인 컴퓨팅, 구독형 가격 책정은 분산된 인력의 현실과 CAPEX를 OPEX로 전환하려는 CFO의 요구와 부합합니다. 온프레미스형 PSA는 방화벽 내부에 데이터를 상주시켜야 하는 규제가 엄격한 틈새 시장에서 여전히 존재하지만, 그러한 시장에서도 클라우드 기반의 하이브리드형 인접 분석 및 모바일을 통한 근무 시간 기록이 보급되고 있습니다. 벤더들은 AWS 및 Microsoft와의 제휴를 강화하고, 전 세계 가용성 영역과 공유 AI 가속기를 활용하고 있습니다. 이러한 움직임으로 인해 도입 주기가 수 분기에서 수 주일로 단축되었으며, 전문 서비스 자동화 시장의 총 잠재 규모가 확대되고 있습니다.
한때 영구 라이선스에 의존하던 기존 벤더들은 현재 단계적 전환 툴킷을 구축하고 있으며, 데이터 마이그레이션 유틸리티와 다운타임을 최소화하는 이중 가동 옵션을 제공합니다. 클라우드 기반의 신생 기업들은 이러한 관성을 역으로 활용하여, 제로 실적 도입, 종량제 요금제, 전담 IT 지원 팀이 없는 팀에 적합한 제품 내 가이드를 약속함으로써 시장에 진입하고 있습니다. 그 결과, 클라우드 기반 PSA의 도입은 레거시 도구를 대체할 뿐만 아니라 신흥 경제국에서의 PSA 첫 구매를 촉진하여 전문 서비스 자동화 시장 규모를 확대되고 있습니다.
2025년에도 ‘솔루션’ 부문이 매출의 61.12%를 차지했으나, ‘서비스’ 부문은 연평균 성장률(CAGR) 13.35%로 확대되고 있으며, 이는 프로세스 재설계, 데이터 정제, 사용자 지원이 필요한 전사적 도입 증가를 반영합니다. 새로운 AI 모듈이나 ERP 커넥터가 추가될 때마다 설정, 통합, 거버넌스 프레임워크에 대한 하류 수요가 발생하지만, 고객은 이 부분을 자체적으로 관리할 여력이 부족한 경우가 많습니다. 따라서 시스템 통합사업자는 로드맵 수립, 역할 기반 대시보드 설정, 단계적 전환을 통해 고부가가치 컨설팅 수익을 창출하고 있습니다.
도입의 성공은 행동 변화에 달려 있기 때문에 변화 관리 전문가가 커뮤니케이션, 역할극 세션, KPI 대시보드를 총괄하여本番 가동 후에도 추진력을 유지할 수 있도록 하고 있습니다. Thirdera와 같은 벤더는 ServiceNow 고객을 대상으로 ‘워크플로우 데이터 패브릭’ 액셀러레이터를 제공하며 조기에 시장에 진출했습니다. 서비스의 호조는 평균 계약 금액을 끌어올리고 지속적인 계약 확대를 뒷받침함으로써, 전문 서비스 자동화 시장에서 벤더와 고객 간의 장기적인 관계를 공고히 하고 있습니다.
지역별 분석
2025년, 북미는 프로페셔널 서비스 자동화 시장 규모의 37.74%를 차지했습니다. 이는 성숙한 IT 컨설팅 생태계, 서벤스-옥슬리법에 기반한 통제, 그리고 AI 시범 프로젝트에 대한 조기 예산 배분이 뒷받침하고 있습니다. 본사가 인근에 위치해 있어 많은 벤더들이 실시간 피드백 루프와 설계 파트너와의 협력을 통해 기능 배포를 가속화하고 있습니다. 얼리 어답터들은 현재 부서 단위의 시범 단계에서 전사적 통합으로 전환하고 있으며, 이용률 최적화, 고도화된 수익성 모델링, AI를 활용한 제안서 작성에 주력하고 있습니다. 시장 포화로 인해 판매량 증가세는 둔화되고 있지만, 애널리틱스, 모바일 경비 관리, 인재 마켓플레이스를 통한 교차 판매를 통해 매출 성장세는 유지되고 있습니다.
아시아태평양은 정부 보조금, 높아지는 임금 압박, 그리고 활기찬 SaaS 개발자 기반에 힘입어 14.08%라는 가장 높은 연평균 성장률(CAGR)을 달성할 전망입니다. 일본에서는 2024년에 전자 계약에 관한 문의가 157% 급증하여, 디지털화의 기세가 광범위하게 확산되고 있음을 보여줍니다. 인도의 SaaS 기업들은 2028년까지 세계 시장 점유율 8%를 목표로 하고 있으며, 이는 PSA 기능의 ‘구매자’와 ‘구축자’라는 이중 역할로 참여함을 의미합니다. 싱가포르의 ‘생산성 솔루션 보조금(PSG)’과 호주의 AI를 통한 생산성 향상에 대한 집중이 해당 지역의 파이프라인을 더욱 활성화시키고 있습니다. 각 벤더사는 이러한 다양한 미시적 시장을 확보하기 위해 세무, 규정 준수, 언어 팩의 현지화를 추진하고 있습니다.
유럽에서는 GDPR(EU 개인정보보호규정)에 대한 우려로 인해 도입이 착실하지만 다소 주춤한 상황입니다. 많은 컨설팅 기업들이 프라이빗 클라우드나 EU 주권형 클라우드 도입을 추구하고 있으며, 판매 기간은 길어지겠지만 조달상의 장벽이 해소되면 계약 규모는 확대될 것입니다. 워크데이(Workday)의 5억 5,000만 파운드 규모의 영국 투자에는 현지 AWS 리전 및 견습 프로그램이 포함되어 있어, 데이터 보관 장소에 대한 우려와 인력 부족 문제를 완화하고 있습니다. ESG 보고 의무화 또한 탄소 배출량 및 다양성 지표를 파악하는 PSA의 기능 강화를 촉진하고 있으며, 프로페셔널 서비스 자동화(PSA) 시장은 규제 준수를 실현하는 기반으로서의 입지를 확립해 가고 있습니다. 한편, 중동 및 아프리카에서는 스마트 시티 건설이나 인프라 구축과 같은 메가 프로젝트 감독을 위해 PSA 도입이 시작되고 있으나, 통신 환경의 격차와 관리직 인력 부족으로 인해 본격적인 보급은 지연되고 있습니다.
기타 혜택 :
- 엑셀 형식 시장 예측(ME) 시트
- 3개월간의 애널리스트 지원
자주 묻는 질문
목차
제1장 서론
제2장 조사 방법
제3장 주요 요약
제4장 시장 구도
제5장 시장 규모 및 성장 예측
제6장 경쟁 구도
제7장 시장 기회 및 향후 동향
AJY 26.09.07According to Mordor Intelligence, the professional services automation market size is expected to grow from USD 15.22 billion in 2025 to USD 16.92 billion in 2026 and is forecast to reach USD 28.73 billion by 2031 at 11.17% CAGR over 2026-2031.
This report is Segmented by Deployment Type (Cloud and On-Premise), Component (Solutions and Services), Enterprise Size (Large Enterprises and Small and Medium Enterprises), End-User Industry (IT and Telecom, BFSI, and More), Functionality Module (Project and Resource Management, Billing and Invoicing, and More), and Geography. The Market Forecasts are Provided in Terms of Value (USD).
Global Professional Services Automation Market Trends and Insights
Cloud PSA Adoption Among SMEs
Small and medium enterprises propel the most dynamic growth in the professional services automation market as public-sector digitization grants and easy SaaS onboarding dismantle historical infrastructure hurdles. Singapore's Productivity Solutions Grant reimburses up to 50% of subscription fees, letting micro-firms access capabilities once reserved for global consultancies. A referral flywheel forms as early wins showcase productivity boosts, and subscription pricing converts upfront CAPEX into manageable OPEX, giving vendors recurring cash flows that fund feature velocity. Jana Small Finance Bank cut turnaround time by 65-70% after deploying UiPath's automation suite. Such results validate the thesis that even a 10-seat firm can wield enterprise-grade orchestration, reshaping competitive parity across professional services segments.
Drive for Real-Time Resource and Margin Visibility
Macroeconomic volatility forces firms to expose utilization gaps and margin leaks in real time rather than at quarterly review. BeyondTrust lifted resource utilization 20% after adopting Certinia PSA, pairing granular skills matrices with live feedback loops. Dashboards that surface over-allocated engineers or under-funded milestones curb cost overruns before they erode profitability. As more project teams work across time zones, instantaneous variance alerts allow managers to re-sequence tasks without breaching delivery windows. Embedded AI simulators pressure-test resourcing scenarios, ensuring that rate-card discounts or scope changes do not dilute forecasted gross margin.
Data-Privacy Concerns in Multi-Tenant Clouds
GDPR imposes strict residency and consent rules that intensify scrutiny of shared-tenant architectures handling client records, project notes, and employee timesheets. Regulated advisory practices now negotiate data-processing addendums that stipulate encryption keys, regional failover, and audit-ready logging. While hyperscale clouds boast SOC 2 and ISO-27001 attestations, some clients still prefer single-tenant or EU sovereign zones, delaying pure-cloud migrations and marginally dampening professional services automation market adoption in the short term.
Other drivers and restraints analyzed in the detailed report include:
- ERP/CRM Integration Momentum
- AI-Driven Predictive Staffing Analytics
- Integration Complexity with Legacy Stacks
For complete list of drivers and restraints, kindly check the Table Of Contents.
Segment Analysis
Cloud deployments represented 68.72% of the professional services automation market size in 2025 and are slated to grow at 12.88% CAGR to 2031, reflecting a decisive pivot from on-premise custom builds. Automatic patching, elastic compute, and subscription pricing align with distributed workforce realities and CFO mandates to shift CAPEX to OPEX. On-premise PSA persists in highly regulated niches that mandate behind-firewall data residency, but even there, hybrid adjacency-analytics or mobile time capture in the cloud-gains traction. Platform vendors deepen alliances with AWS and Microsoft to tap global availability zones and shared AI accelerators. These moves compress implementation cycles from quarters to weeks, broadening the total addressable professional services automation market.
Traditional vendors that once relied on perpetual licenses now craft phased migration toolkits, offering data migration utilities and dual-running options that limit downtime. Emerging entrants born in the cloud exploit this inertia by promising zero-footprint deployment, consumption-based billing, and in-product walk-throughs suited to teams without dedicated IT support. As a result, cloud PSA adoption not only displaces legacy tools but can also catalyze first-time PSA buyers in emerging economies, extending the professional services automation market footprint.
While Solutions retained 61.12% revenue in 2025, the Services segment is expanding at 13.35% CAGR, mirroring the rise in enterprise-wide rollouts that demand process re-engineering, data cleanup, and user enablement. Every new AI module or ERP connector creates a downstream need for configuration, integration, and governance frameworks, and customers often lack the bandwidth to manage this layer themselves. Systems integrators, therefore, carve premium consulting revenue, shaping roadmaps, configuring role-based dashboards, and staging phased cut-overs.
Because successful adoption hinges on behavior change, change-management specialists orchestrate communications, role-play sessions, and KPI dashboards that sustain momentum post go-live. Vendors such as Thirdera became early movers, delivering Workflow Data Fabric accelerators for ServiceNow customers. The services upturn bolsters average contract value and underpins recurring expansion bookings, solidifying long-term vendor-client relationships within the professional services automation market.
Complete Report Scope:
- By Deployment Type
- Cloud
- On-Premise
- By Component
- Solutions
- Services
- By Enterprise Size
- Large Enterprises
- Small and Medium Enterprises (SMEs)
- By End-user Industry
- IT and Telecom
- BFSI
- Architecture, Engineering, and Construction
- Healthcare
- Legal Services
- Consulting and Advisory
- Other End-user Industries
- By Functionality Module
- Project and Resource Management
- Billing and Invoicing
- Time and Expense Tracking
- Business Analytics and Reporting
- Others
- By Geography
- North America
- United States
- Canada
- Mexico
- South America
- Brazil
- Argentina
- Chile
- Rest of South America
- Europe
- Germany
- United Kingdom
- France
- Italy
- Spain
- Russia
- Rest of Europe
- Asia-Pacific
- China
- India
- Japan
- South Korea
- Malaysia
- Singapore
- Australia
- Rest of Asia-Pacific
- Middle East and Africa
- Middle East
- United Arab Emirates
- Saudi Arabia
- Turkey
- Rest of Middle East
- Africa
- South Africa
- Nigeria
- Egypt
- Rest of Africa
- Middle East
- North America
Geography Analysis
North America contributed 37.74% of the professional services automation market size in 2025, anchored by mature IT consulting ecosystems, Sarbanes-Oxley controls, and early AI pilot budgets. Headquarters proximity grants many vendors live feedback loops and design-partner engagements that accelerate feature rollouts. Early adopters now progress from departmental pilots to enterprise-wide consolidations, focusing on utilization optimization, advanced profitability modeling, and AI-assisted proposal generation. Although saturation tempers volume growth, cross-selling into analytics, mobile expense, and talent marketplaces sustains revenue lift.
Asia-Pacific is on track for the fastest 14.08% CAGR, backed by government grants, rising wage pressure, and a vibrant SaaS developer base. Japan saw a 157% spike in electronic contract inquiries in 2024, signaling widespread digitization momentum. India's SaaS firms target an 8% global share by 2028, translating into dual-role participation as both buyers and builders of PSA capabilities. Singapore's Productivity Solutions Grant and Australia's focus on AI productivity further energize the regional pipeline. Vendors localize tax, compliance, and language packs to capture these diverse micro-markets.
Europe offers steady uptake tempered by GDPR anxieties. Many advisory practices pursue private-cloud or EU-sovereign deployments, elongating sales but enlarging deal size once procurement hurdles clear. Workday's GBP 550 million UK investment includes local AWS regions and apprenticeship programs, easing data-residency fears and talent shortages. ESG reporting mandates also catalyze PSA enhancements that capture carbon impact and diversity metrics, positioning the professional services automation market as an enabler of regulatory compliance. Meanwhile, the Middle East and Africa begin to deploy PSA for megaproject oversight-think smart-city builds and infrastructure rollouts-though connectivity gaps and scarce admin talent slow mass adoption.
- Autotask Corporation (Datto)
- Kantata (Mavenlink + Kimble Apps)
- Clarizen Inc.
- Deltek Inc.
- Certinia (FinancialForce.com, Inc.)
- Infor Inc.
- Oracle NetSuite OpenAir
- Upland Software (Tenrox)
- Projector PSA Inc.
- Replicon Inc.
- Unanet Technologies
- Adobe Workfront
- ConnectWise PSA
- BigTime Software
- Planview (Changepoint)
- Avaza Ltd.
- Accelo Ltd.
- Wrike (Citrix)
- Hub Planner
- BQE Software (BQE CORE)
- Smartsheet (Resource Mgt)
- ServiceNow PSA
- Unit4 PSA
- Kimble (legacy)
- Workday PSA
- SAP Professional Services Cloud
Additional Benefits:
- The market estimate (ME) sheet in Excel format
- 3 months of analyst support
TABLE OF CONTENTS
1 INTRODUCTION
- 1.1 Study Assumptions and Market Definition
- 1.2 Scope of the Study
2 RESEARCH METHODOLOGY
3 EXECUTIVE SUMMARY
4 MARKET LANDSCAPE
- 4.1 Market Overview
- 4.2 Market Drivers
- 4.2.1 Cloud PSA adoption among SMEs
- 4.2.2 Drive for real-time resource and margin visibility
- 4.2.3 ERP/CRM integration momentum
- 4.2.4 Shift to outcome-based service models
- 4.2.5 AI-driven predictive staffing analytics
- 4.3 Market Restraints
- 4.3.1 Data-privacy concerns in multi-tenant clouds
- 4.3.2 Integration complexity with legacy stacks
- 4.3.3 Scarcity of PSA-skilled implementation talent
- 4.3.4 Vendor consolidation and lock-in risk
- 4.4 Industry Value Chain Analysis
- 4.5 Regulatory Landscape
- 4.6 Technological Outlook
- 4.7 Industry Attractiveness - Porter's Five Forces Analysis
- 4.7.1 Bargaining Power of Suppliers
- 4.7.2 Bargaining Power of Buyers
- 4.7.3 Threat of New Entrants
- 4.7.4 Threat of Substitutes
- 4.7.5 Intensity of Competitive Rivalry
- 4.8 Impact of Macroeconomic Factors on the Market
5 MARKET SIZE AND GROWTH FORECASTS (VALUES)
- 5.1 By Deployment Type
- 5.1.1 Cloud
- 5.1.2 On-Premise
- 5.2 By Component
- 5.2.1 Solutions
- 5.2.2 Services
- 5.3 By Enterprise Size
- 5.3.1 Large Enterprises
- 5.3.2 Small and Medium Enterprises (SMEs)
- 5.4 By End-user Industry
- 5.4.1 IT and Telecom
- 5.4.2 BFSI
- 5.4.3 Architecture, Engineering, and Construction
- 5.4.4 Healthcare
- 5.4.5 Legal Services
- 5.4.6 Consulting and Advisory
- 5.4.7 Other End-user Industries
- 5.5 By Functionality Module
- 5.5.1 Project and Resource Management
- 5.5.2 Billing and Invoicing
- 5.5.3 Time and Expense Tracking
- 5.5.4 Business Analytics and Reporting
- 5.5.5 Others
- 5.6 By Geography
- 5.6.1 North America
- 5.6.1.1 United States
- 5.6.1.2 Canada
- 5.6.1.3 Mexico
- 5.6.2 South America
- 5.6.2.1 Brazil
- 5.6.2.2 Argentina
- 5.6.2.3 Chile
- 5.6.2.4 Rest of South America
- 5.6.3 Europe
- 5.6.3.1 Germany
- 5.6.3.2 United Kingdom
- 5.6.3.3 France
- 5.6.3.4 Italy
- 5.6.3.5 Spain
- 5.6.3.6 Russia
- 5.6.3.7 Rest of Europe
- 5.6.4 Asia-Pacific
- 5.6.4.1 China
- 5.6.4.2 India
- 5.6.4.3 Japan
- 5.6.4.4 South Korea
- 5.6.4.5 Malaysia
- 5.6.4.6 Singapore
- 5.6.4.7 Australia
- 5.6.4.8 Rest of Asia-Pacific
- 5.6.5 Middle East and Africa
- 5.6.5.1 Middle East
- 5.6.5.1.1 United Arab Emirates
- 5.6.5.1.2 Saudi Arabia
- 5.6.5.1.3 Turkey
- 5.6.5.1.4 Rest of Middle East
- 5.6.5.2 Africa
- 5.6.5.2.1 South Africa
- 5.6.5.2.2 Nigeria
- 5.6.5.2.3 Egypt
- 5.6.5.2.4 Rest of Africa
- 5.6.5.1 Middle East
- 5.6.1 North America
6 COMPETITIVE LANDSCAPE
- 6.1 Market Concentration
- 6.2 Strategic Moves
- 6.3 Market Share Analysis
- 6.4 Company Profiles (includes Global level Overview, Market level overview, Core Segments, Financials as available, Strategic Information, Market Rank/Share for key companies, Products and Services, and Recent Developments)
- 6.4.1 Autotask Corporation (Datto)
- 6.4.2 Kantata (Mavenlink + Kimble Apps)
- 6.4.3 Clarizen Inc.
- 6.4.4 Deltek Inc.
- 6.4.5 Certinia (FinancialForce.com, Inc.)
- 6.4.6 Infor Inc.
- 6.4.7 Oracle NetSuite OpenAir
- 6.4.8 Upland Software (Tenrox)
- 6.4.9 Projector PSA Inc.
- 6.4.10 Replicon Inc.
- 6.4.11 Unanet Technologies
- 6.4.12 Adobe Workfront
- 6.4.13 ConnectWise PSA
- 6.4.14 BigTime Software
- 6.4.15 Planview (Changepoint)
- 6.4.16 Avaza Ltd.
- 6.4.17 Accelo Ltd.
- 6.4.18 Wrike (Citrix)
- 6.4.19 Hub Planner
- 6.4.20 BQE Software (BQE CORE)
- 6.4.21 Smartsheet (Resource Mgt)
- 6.4.22 ServiceNow PSA
- 6.4.23 Unit4 PSA
- 6.4.24 Kimble (legacy)
- 6.4.25 Workday PSA
- 6.4.26 SAP Professional Services Cloud
7 MARKET OPPORTUNITIES AND FUTURE TRENDS
- 7.1 White-Space and Unmet-Need Assessment


