|
시장보고서
상품코드
2123007
모바일 애플리케이션 테스트 서비스(MATS) 시장 : 점유율 분석, 업계 동향과 통계, 성장 예측(2026-2031년)Mobile Application Testing Services (MATS) - Market Share Analysis, Industry Trends & Statistics, Growth Forecasts (2026 - 2031) |
||||||
 Mordor Intelligence
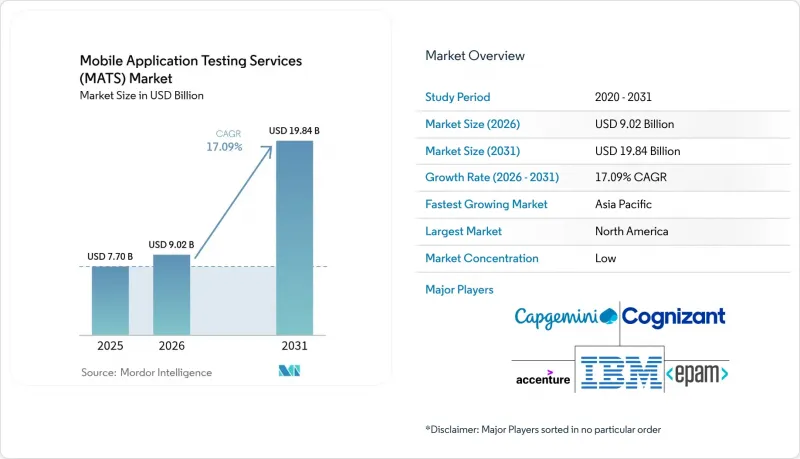
Mordor Intelligence에 의하면, 모바일 애플리케이션 테스트 서비스(MATS) 시장 규모는 2025년 77억 달러에서 2026년에는 90억 2,000만 달러로 확대되어 2026-2031년까지 CAGR 17.09%로 성장을 지속하여, 2031년에는 198억 4,000만 달러에 이를 것으로 예측됩니다.
본 보고서는 용도 유형(네이티브 앱, 웹 앱, 기타), 서비스 유형(기능 테스트 서비스, 성능·부하 테스트 서비스, 기타), 테스트 방식(수동 테스트, 자동 테스트, 기타), 최종 사용자 산업(게임, 은행, 금융서비스 및 보험(BFSI), 헬스케어 및 생명과학, 기타), 지역별로 분류되어 있습니다. 시장 예측은 금액(달러) 기준으로 제시되어 있습니다.
세계 모바일 애플리케이션 테스트 서비스(MATS) 시장 동향 및 인사이트
전 세계 스마트폰 보급률 상승
2025년, 인도, 인도네시아, 필리핀의 스마트폰 보급률은 5G 지원 단말기의 평균 가격이 200달러 미만으로 떨어짐에 따라 급격히 상승했습니다. 이에 따라 다양한 네트워크 환경과 저사양 단말기를 대상으로 한 수천 개의 지역 특화형 앱이 등장했습니다. 그 결과, 이 모바일 애플리케이션 테스트 서비스 시장공급업체들은 OEM의 조정으로 인해 핵심 기능이 손상될 수 있는 파편화된 안드로이드 포크 전반에 걸친 호환성 확보를 위한 업무 부담이 급증하고 있습니다. 기기 커버리지 범위는 여러 칩셋 공급업체와 화면 크기에 이르기까지 광범위해야 하므로, 서비스 제공업체는 실제 기기 클라우드의 확대와 테스트 케이스의 우선순위 설정을 더욱 정교하게 해야 하는 상황에 직면해 있습니다. 사내에서 이러한 기기 매트릭스를 유지할 수 없는 기업들은 아웃소싱을 늘리고 있으며, 이로 인해 테스트 전문 기업들에게 지속적인 수익원이 창출되고 있습니다.
애자일 및 DevOps로의 급속한 전환에 따른 지속적인 테스트 요구
포춘 500대 기업의 개발자들은 현재 하루에 수십 번이나 코드를 프로덕션 환경에 배포하고 있으며, 개발과 품질 사이의 벽이 허물어졌습니다. 그 결과, 테스트는 업스트림 프로세스로 이동하여 커밋마다 병렬로 실행되며, CI/CD 파이프라인의 ‘실행 가능/불가능’ 판정 기준에 반영되게 되었습니다. Jenkins, GitLab, Azure DevOps에 AI 지원 스크립트 생성 기능을 통합한 벤더는 피드백 주기를 몇 시간에서 몇 분으로 단축할 수 있어 수주율이 높아지고 있습니다. 모바일 애플리케이션 테스트 서비스 시장에서는 평균 수정 시간을 단축하고, 디지털 제품 팀의 핵심을 이루는 ‘조기 실패(fail-fast)’ 정신을 뒷받침하는 이러한 파트너들이 높은 평가를 받고 있습니다.
인프라 및 디바이스 랩에 대한 높은 투자 비용
iOS와 20개 Android OEM에 걸친 1,000대의 실기 기기를 갖춘 실험실을 구축하는 데는 600만 달러가 소요되며, 유지 관리에는월5만 달러의 비용이 듭니다. 소규모 제공업체는 이러한 지출을 충분한 수의 고객에게 분산시키지 못해 가격 경쟁력이 제한됩니다. 클라우드 디바이스 팜은 자본 지출(CapEx)을 줄여주지만, 시간 단위 이용료나 데이터센터 지역별 이용료와 같은 운영 비용(OpEx)이 발생합니다. 이러한 제약으로 인해 모바일 애플리케이션 테스트 서비스 시장의 신규 진출기업들의 성장이 둔화되고 있으며, 틈새 시장에 진입한 기업들이 규모의 경제를 추구하는 가운데 M&A가 가속화되고 있습니다.
부문 분석
2025년, 네이티브 앱은 모바일 애플리케이션 테스트 서비스 시장의 52.10% 점유율을 차지하고 있으며, 이는 기업들이 플랫폼 수준의 성능과 카메라, GPS, 생체 인식 API에 의존하고 있음을 여실히 보여줍니다. 이 부문의 견조한 성장에 힘입어, 기기와 깊은 통합을 검증하는 Swift, Kotlin, Jetpack Compose 테스트 전문가에 대한 수요는 계속해서 높은 수준을 유지하고 있습니다. 연평균 성장률(CAGR) 18.15%로 성장하고 있는 프로그레시브 웹 앱(PWA)의 경우, 네이티브 앱의 테스트 패턴과는 달리 크로스 브라우저 호환성 테스트와 서비스 워커 검증이 요구됩니다. PWA의 부상으로 인해 공급업체들은 브라우저와 기기 펌웨어를 융합한 통합 테스트 제품군을 제공하는 것을 촉진하고 있으며, 그 결과 모바일 애플리케이션 테스트 서비스 시장의 총 지출 가능 규모가 확대되고 있습니다.
또한 PWA는 단일 코드베이스 전략을 추구하는 중규모 소매업체 및 SaaS 벤더의 관심도 끌고 있습니다. 따라서 테스트 파트너는 오프라인 캐시, 푸시 알림의 일관성, 크로미움 포크 및 웹킷에 걸친 설치 가능성에 대한 역량을 입증해야 합니다. 대역폭이 향상됨에 따라 기업들은 네이티브에 가까운 사용자 경험을 기대하고 있으며, 로딩 시간 및 애니메이션의 부드러움에 대한 벤치마크 기준이 높아지고 있습니다. 네이티브 빌드와 PWA 빌드의 병렬 성능 분석을 제공할 수 있는 기업은 기술 스택 결정에 있어 영향력을 높이고 시장 점유율을 확대할 수 있습니다.
2025년 모바일 애플리케이션 테스트 서비스 시장 규모 중 기능 테스트는 41.30%를 차지했습니다. 이는 UI 검증 및 회귀 테스트 스위트가 모든 산업 분야에서 여전히 필수 요건이기 때문입니다. 한편, 금융 기관들이 제로 트러스트 정책을 모든 소프트웨어 구성 요소로 확대함에 따라 보안 침투 테스트는 연평균 성장률(CAGR) 17.95%로 성장하고 있습니다. OWASP MASVS 준수 감사를 API 퍼징 및 런타임 앱 자체 보호 점검과 결합한 서비스를 제공하는 벤더들은 시정 주기를 단축함으로써 고가의 요금 설정을 정당화하고 있습니다.
개인정보 보호 관련 법규의 확충과 주목을 끄는 정보 유출 사건으로 인해, 기기의 루팅, 네트워크 계층에서의 도청, 악성 SDK 임베딩을 시뮬레이션하는 모바일 침투 테스트에 대한 예산 배분의 우선순위가 높아지고 있습니다. 발견된 사항을 DevSecOps 대시보드에 반영하고, CI/CD 파이프라인에서 패치를 자동으로 재테스트하는 벤더는 위험 감소를 통한 구체적인 ROI를 입증하고 있습니다. 이러한 파급 효과로 인해 관리형 취약점 관리 및 레드팀 서비스의 교차 판매가 촉진되어, 모바일 애플리케이션 테스트 서비스 산업 전체의 평균 계약 금액을 끌어올리고 있습니다.
지역별 분석
북미는 DevOps의 광범위한 도입과 엄격한 규정 준수 요건을 배경으로 2025년 매출의 37.10%를 차지했습니다. 미국의 은행과 보험사는 연중무휴 24시간 보안 스캔이 필요한 실시간 사기 감지 앱을 배포하는 반면, 디지털 네이티브 기업들은 격주 릴리스 주기를 관리하기 위해 회귀 테스트 제품군을 외부에 위탁하고 있습니다. 캐나다 수요는 의료의 디지털화와 각 주의 접근성 법에 중점을 두고 있어, 영어와 프랑스어 앱을 아우르는 이중 언어 테스트에 대한 프리미엄이 유지되고 있습니다.
아시아태평양은 2031년까지 연평균 성장률(CAGR) 17.82%로 가장 높은 성장세를 보이고 있습니다. 인도의 핀테크 및 소셜 커머스 붐에 힘입어 15개 지역 언어와 수많은 저가형 스마트폰을 지원하는 대규모 크라우드소싱 테스트 캠페인이 전개되고 있습니다. 중국의 슈퍼 앱 생태계에서는 미니 프로그램 아키텍처와 국내 규정 준수에 정통한 제공업체가 요구되고 있으며, 국내용과 수출용 빌드를 모두 아우르는 이중 전략이 마련되고 있습니다. 일본과 한국의 5G가 성숙 단계에 접어들면서 AR/VR 앱의 워크로드가 증가하고 있으며, 모바일 애플리케이션 테스트 서비스 시장의 벤더들에게는 디바이스 랩의 규모가 확대되고 있습니다.
유럽에서는 규제 환경을 배경으로 꾸준한 성장이 나타나고 있습니다. ‘유럽 접근성 법’과 GDPR(EU 개인정보보호규정)의 과징금 제도에 따라, 접근성 및 개인정보 보호 점검은 예산에서 양보할 수 없는 항목이 되었습니다. 독일에서는 자동차 산업의 OTA 업데이트 테스트가 수요를 견인하고 있으며, 영국에서는 브렉시트 이후의 규제 차이에도 불구하고 금융 부문 수요가 여전히 견조합니다. 북유럽의 고객사들은 지속가능성 지표를 중시하며, 공급업체에 테스트 랩의 탄소 집약도를 보고하도록 요구하고 있는데, 이는 모바일 애플리케이션 테스트 서비스 산업에서 새로운 차별화 요소로 자리 잡고 있습니다.
기타 혜택
- 엑셀 형식 시장 예측(ME) 시트
- 3개월간의 애널리스트 지원
자주 묻는 질문
목차
제1장 서론
제2장 조사 방법
제3장 주요 요약
제4장 시장 구도
제5장 시장 규모와 성장 예측
제6장 경쟁 구도
제7장 시장 기회와 향후 전망
JHS 26.09.09According to Mordor Intelligence, the mobile application testing services market size is expected to grow from USD 7.70 billion in 2025 to USD 9.02 billion in 2026 and is forecast to reach USD 19.84 billion by 2031 at 17.09% CAGR over 2026-2031.
This report is Segmented by Application Type (Native Apps, Web Apps, and More), Service Type (Functional Testing Services, Performance and Load Testing Services, and More), Testing Approach (Manual Testing, Automated Testing, and More), End-User Industry (Gaming, BFSI, Healthcare and Life Sciences, and More), and Geography. The Market Forecasts are Provided in Terms of Value (USD).
Global Mobile Application Testing Services (MATS) Market Trends and Insights
Rising Global Smartphone Penetration Accelerates Testing Demand
Smartphone adoption in India, Indonesia, and the Philippines climbed sharply in 2025 as the average 5G handset fell below USD 200, spawning thousands of localized apps targeting varied network conditions and lower-spec devices. For suppliers to this mobile application testing services market, the result is a surge in compatibility workloads across fragmented Android forks where OEM tweaks often break core functions. Device coverage must span multiple chipset vendors and screen sizes, pressuring service providers to expand real-device clouds and refine test-case prioritization. Enterprises unable to maintain these device matrices in-house increasingly outsource, creating recurring revenue streams for pure-play testing firms.
Rapid Shift to Agile and DevOps Demanding Continuous Testing
Fortune 500 developers now push code to production dozens of times a day, dissolving the wall between development and quality. Testing therefore moves upstream, runs in parallel with every commit, and feeds go/no-go gates in CI/CD pipelines. Vendors that plug AI-assisted script generation into Jenkins, GitLab, and Azure DevOps see stronger win rates because they compress feedback cycles from hours to minutes. The mobile application testing services market prizes such partners for lowering mean time to remediation and supporting the "fail-fast" ethos central to digital product teams.
High Infrastructure and Device-Lab Investment Costs
A lab with 1,000 real devices spanning iOS and 20 Android OEMs can cost USD 6 million to build and USD 50,000 per month to refresh. Smaller providers cannot amortize these outlays across enough clients, curbing their ability to compete on price. Cloud device farms alleviate capex but introduce opex tied to hourly usage and geographic data-center fees. This restraint slows new-entrant growth in the mobile application testing services market and accelerates M&A as niche players seek scale advantages.
Other drivers and restraints analyzed in the detailed report include:
- Proliferation of AI/ML, AR/VR and 5G Rich-Experience Apps
- Growing Regulatory Push for Mobile App Security and Privacy
- Fragmented Device/OS Ecosystem Complicates Automation ROI
For complete list of drivers and restraints, kindly check the Table Of Contents.
Segment Analysis
Native apps held 52.10% of the mobile application testing services market share in 2025, underscoring enterprise reliance on platform-level performance and camera, GPS, or biometric APIs. The segment's durability keeps demand high for Swift, Kotlin, and Jetpack Compose test specialists who validate deep device integrations. Progressive web apps, expanding at 18.15% CAGR, require cross-browser conformance testing and service-worker validation that differ from native test patterns. Their rise encourages providers to offer unified test suites blending browser and device farms, thereby broadening total addressable spend within the mobile application testing services market.
PWAs also attract mid-sized retailers and SaaS vendors seeking a single code-base strategy. Testing partners must therefore prove capability in offline caching, push-notification integrity, and installability across Chromium forks and WebKit. As bandwidth improves, enterprises expect near-native UX, raising the bar for load-time and animation smoothness benchmarks. Firms that can deliver side-by-side performance analytics for native versus PWA builds gain influence over tech-stack decisions, increasing wallet share.
Functional testing represented 41.30% of the mobile application testing services market size in 2025 as UI verification and regression suites remained table stakes across all industries. Yet security and penetration testing grows at 17.95% CAGR, propelled by financial institutions extending zero-trust policies to every software component. Providers bundling OWASP MASVS compliance audits with API fuzzing and runtime app self-protection checks shorten remediation cycles and justify premium fees.
Expanded privacy laws and high-profile breaches elevate budget priority for mobile pentests that simulate device rooting, network-layer interception, and malicious SDK inclusion. Vendors that feed findings into DevSecOps dashboards and retest patches automatically in CI/CD pipelines demonstrate tangible risk-reduction ROI. This pull through boosts their cross-sell of managed vulnerability management and red-team services, raising average contract value across the mobile application testing services industry.
Complete Report Scope:
- By Application Type
- Native Apps
- Web Apps
- Hybrid Apps
- Progressive Web Apps (PWA)
- By Service Type
- Functional Testing Services
- Performance and Load Testing Services
- Security and Pen-Testing Services
- Compatibility and UX Testing Services
- Test Automation Services
- By Testing Approach
- Manual Testing
- Automated Testing
- Crowd / Crowd-source Testing
- By End-User Industry
- Gaming
- BFSI
- Healthcare and Life Sciences
- Retail and E-Commerce
- Travel and Hospitality
- Media and Entertainment
- Other End-User Industries
- By Geography
- North America
- United States
- Canada
- South America
- Brazil
- Argentina
- Rest of South America
- Europe
- Germany
- United Kingdom
- France
- Italy
- Spain
- Netherlands
- Rest of Europe
- Asia-Pacific
- China
- India
- Japan
- South Korea
- Australia
- Rest of Asia-Pacific
- Middle East and Africa
- Middle East
- United Arab Emirates
- Saudi Arabia
- Rest of Middle East
- Africa
- South Africa
- Nigeria
- Rest of Africa
- Middle East
- North America
Geography Analysis
North America generated 37.10% of 2025 revenues, leveraging deep DevOps adoption and strict compliance mandates. U.S. banks and payers rolled out real-time fraud-detection apps that need 24X7 security scans, while digital-native brands outsource regression suites to manage bi-weekly release cadences. Canadian demand centers on healthcare digitization and provincial accessibility laws, sustaining premium for bilingual testing coverage across English and French apps.
Asia-Pacific posts the strongest 17.82% CAGR through 2031. India's fintech and social-commerce boom prompts large-scale crowd campaigns across 15 regional languages and myriad low-cost handsets. China's super-app ecosystems require providers versed in mini-program architectures and domestic compliance, creating two-track engagements covering both domestic and export builds. Mature 5G rollouts in Japan and South Korea elevate AR/VR app workloads, expanding the device lab footprint for vendors in the mobile application testing services market.
Europe shows steady growth underpinned by regulation. The European Accessibility Act and GDPR fine regime convert accessibility and privacy checks into non-negotiable budget lines. Germany leads demand via automotive OTA-update testing, while the U.K. remains strong in finance despite post-Brexit regulatory divergence. Nordic clients emphasize sustainability metrics, asking suppliers to report test-lab carbon intensity, a nascent differentiator within the mobile application testing services industry.
- Accenture PLC
- Capgemini SE
- Cognizant Technology Solutions Corporation
- EPAM Systems Inc.
- International Business Machines Corporation
- Wipro Limited
- Tata Consultancy Services Limited
- Cigniti Technologies Limited
- Sauce Labs Inc.
- Amazon Web Services, Inc. (Device Farm)
- Applause App Quality, Inc.
- BrowserStack Limited
- Infosys Limited
- Qualitest Group Ltd.
- Tricentis GmbH
- Testlio Inc.
- Perfecto Mobile Ltd. (Perforce Software)
- Global App Testing Ltd.
- Testbirds GmbH
- Rainforest QA, Inc.
- BugRaptors QA Solutions Pvt. Ltd.
Additional Benefits:
- The market estimate (ME) sheet in Excel format
- 3 months of analyst support
TABLE OF CONTENTS
1 INTRODUCTION
- 1.1 Study Assumptions and Market Definition
- 1.2 Scope of the Study
2 RESEARCH METHODOLOGY
3 EXECUTIVE SUMMARY
4 MARKET LANDSCAPE
- 4.1 Market Overview
- 4.2 Market Drivers
- 4.2.1 Rising global smartphone penetration
- 4.2.2 Rapid shift to agile and DevOps demanding continuous testing
- 4.2.3 Proliferation of AI/ML, AR/VR and 5G rich-experience apps
- 4.2.4 Growing regulatory push for mobile app security and privacy
- 4.2.5 Increasing OEM demand for in-vehicle app testing (IVI systems)
- 4.2.6 Sustainability KPIs driving battery-drain and carbon-aware testing
- 4.3 Market Restraints
- 4.3.1 High infrastructure and device-lab investment costs
- 4.3.2 Fragmented device/OS ecosystem complicates automation ROI
- 4.3.3 Rising complexity of in-app ad-tech SDKs causing test flakiness
- 4.3.4 Limited test-data privacy frameworks for GenAI-based testing
- 4.4 Industry Value Chain Analysis
- 4.5 Regulatory Landscape
- 4.6 Technological Outlook
- 4.7 Porter's Five Forces Analysis
- 4.7.1 Bargaining Power of Suppliers
- 4.7.2 Bargaining Power of Buyers
- 4.7.3 Threat of New Entrants
- 4.7.4 Threat of Substitute Products
- 4.7.5 Intensity of Competitive Rivalry
5 MARKET SIZE AND GROWTH FORECASTS (VALUE)
- 5.1 By Application Type
- 5.1.1 Native Apps
- 5.1.2 Web Apps
- 5.1.3 Hybrid Apps
- 5.1.4 Progressive Web Apps (PWA)
- 5.2 By Service Type
- 5.2.1 Functional Testing Services
- 5.2.2 Performance and Load Testing Services
- 5.2.3 Security and Pen-Testing Services
- 5.2.4 Compatibility and UX Testing Services
- 5.2.5 Test Automation Services
- 5.3 By Testing Approach
- 5.3.1 Manual Testing
- 5.3.2 Automated Testing
- 5.3.3 Crowd / Crowd-source Testing
- 5.4 By End-User Industry
- 5.4.1 Gaming
- 5.4.2 BFSI
- 5.4.3 Healthcare and Life Sciences
- 5.4.4 Retail and E-Commerce
- 5.4.5 Travel and Hospitality
- 5.4.6 Media and Entertainment
- 5.4.7 Other End-User Industries
- 5.5 By Geography
- 5.5.1 North America
- 5.5.1.1 United States
- 5.5.1.2 Canada
- 5.5.2 South America
- 5.5.2.1 Brazil
- 5.5.2.2 Argentina
- 5.5.2.3 Rest of South America
- 5.5.3 Europe
- 5.5.3.1 Germany
- 5.5.3.2 United Kingdom
- 5.5.3.3 France
- 5.5.3.4 Italy
- 5.5.3.5 Spain
- 5.5.3.6 Netherlands
- 5.5.3.7 Rest of Europe
- 5.5.4 Asia-Pacific
- 5.5.4.1 China
- 5.5.4.2 India
- 5.5.4.3 Japan
- 5.5.4.4 South Korea
- 5.5.4.5 Australia
- 5.5.4.6 Rest of Asia-Pacific
- 5.5.5 Middle East and Africa
- 5.5.5.1 Middle East
- 5.5.5.1.1 United Arab Emirates
- 5.5.5.1.2 Saudi Arabia
- 5.5.5.1.3 Rest of Middle East
- 5.5.5.2 Africa
- 5.5.5.2.1 South Africa
- 5.5.5.2.2 Nigeria
- 5.5.5.2.3 Rest of Africa
- 5.5.5.1 Middle East
- 5.5.1 North America
6 COMPETITIVE LANDSCAPE
- 6.1 Market Concentration
- 6.2 Strategic Moves
- 6.3 Market Share Analysis
- 6.4 Company Profiles (includes Global level Overview, Market level overview, Core Segments, Financials as available, Strategic Information, Market Rank/Share for key companies, Products and Services, and Recent Developments)
- 6.4.1 Accenture PLC
- 6.4.2 Capgemini SE
- 6.4.3 Cognizant Technology Solutions Corporation
- 6.4.4 EPAM Systems Inc.
- 6.4.5 International Business Machines Corporation
- 6.4.6 Wipro Limited
- 6.4.7 Tata Consultancy Services Limited
- 6.4.8 Cigniti Technologies Limited
- 6.4.9 Sauce Labs Inc.
- 6.4.10 Amazon Web Services, Inc. (Device Farm)
- 6.4.11 Applause App Quality, Inc.
- 6.4.12 BrowserStack Limited
- 6.4.13 Infosys Limited
- 6.4.14 Qualitest Group Ltd.
- 6.4.15 Tricentis GmbH
- 6.4.16 Testlio Inc.
- 6.4.17 Perfecto Mobile Ltd. (Perforce Software)
- 6.4.18 Global App Testing Ltd.
- 6.4.19 Testbirds GmbH
- 6.4.20 Rainforest QA, Inc.
- 6.4.21 BugRaptors QA Solutions Pvt. Ltd.
7 MARKET OPPORTUNITIES AND FUTURE OUTLOOK
- 7.1 White-Space and Unmet-Need Assessment