
|
시장보고서
상품코드
2123012
산업용 무선 센서 시장 : 점유율 분석, 업계 동향과 통계, 성장 예측(2026-2031년)Industrial Wireless Sensor - Market Share Analysis, Industry Trends & Statistics, Growth Forecasts (2026 - 2031) |
||||||
 Mordor Intelligence
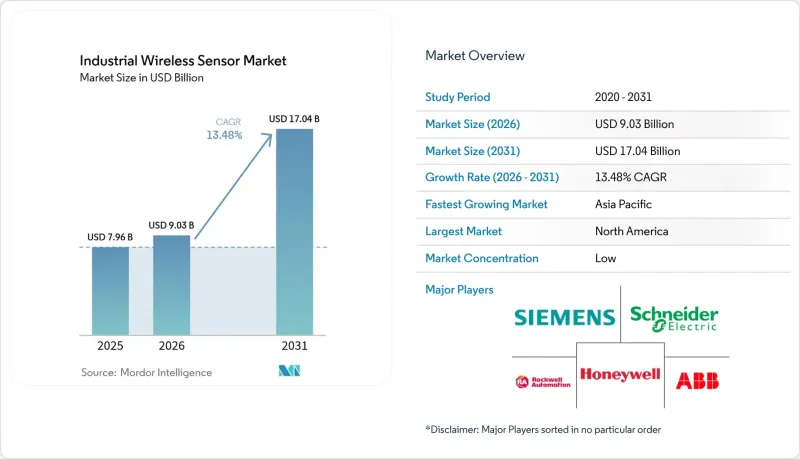
Mordor Intelligence에 의하면, 산업용 무선 센서 시장 규모는 2025년 79억 6,000만 달러에서 2026년에는 90억 3,000만 달러로 확대되어 2026-2031년까지 CAGR 13.48%로 성장을 지속하여, 2031년에는 170억 4,000만 달러에 이를 것으로 예측됩니다.
본 보고서는 제품 유형(온도 센서, 압력 센서, 가스 센서, 기타), 통신 프로토콜(WirelessHART, ISA100.11a, 기타), 전원(배터리 구동, 에너지 수확, 기타), 최종 사용자 산업(제조업, 석유 및 가스,에너지·발전, 기타), 지역별로 분류되어 있습니다. 시장 예측은 금액(달러) 기준으로 제시되어 있습니다.
전 세계 산업용 무선 센서 시장 동향 및 인사이트
엣지-투-클라우드 분석 수요 급증
현재 산업 사업자들은 원시 데이터가 아닌 선별된 인사이트만을 엔터프라이즈 플랫폼으로 전송하고 있으며, 이를 통해 대역폭 부하가 경감되고 지연 시간도 단축되고 있습니다. TDK 등의 기업이 제공하는 AI 알고리즘이 내장된 초소형 센서는 머신 러닝 루틴을 로컬에서 실행하여 전송되는 데이터 양을 최대 90%까지 줄입니다. 프라이빗 5G 네트워크는 엣지 서버와 연동되어 모션 제어에서 1밀리초 미만의 응답 속도를 실현하고 있습니다. 이는 산업용 무선 센서 시장의 적용 범위를 폐쇄 루프 자동화로 확대하는 획기적인 성과입니다. 엣지-투-클라우드 프레임워크를 도입한 공장에서는 실시간 이상 감지를 통해 생산성이 20-25% 향상된 것으로 보고되고 있습니다. 이 기능은 계산 처리에 필요한 에너지 소비를 줄여 지속가능성 목표를 달성하는 동시에, 며칠 전부터 고장을 감지하는 예측 유지보수 전략을 가능하게 합니다.
기존 플랜트의 디지털화 개조
기존 시설에서는 이미 풀가동 중인 설비에 무선 노드를 추가함으로써, 업무에 지장을 주는 배선 공사 비용을 피할 수 있습니다. ISA의 데이터에 따르면, 무선 계측 기기를 활용한 개조 프로젝트는 유선 방식에 비해 투자 회수 기간이 60% 단축되었습니다. 유럽의 한 화학 제조업체는 펌프와 압축기에 진동 센서를 설치하여 가동 수명을 연장하는 동시에 엄격한 배출 규제를 충족하고 있습니다. 케이블 교체나 추가에 방폭용 도관이 필요한 위험 구역에서 무선 기술의 이점은 매우 매력적이며, 무선 센서는 규제 준수를 위한 위험이 낮은 수단이 됩니다. 기존 플랜트가 신설 플랜트를 상회하고 있기 때문에 개보수 및 설치 활동은 향후 10년 이상 동안 산업용 무선 센서 시장 전체에서 두 자릿수의 수량 성장을 지속할 것으로 예측됩니다.
RF 노이즈가 많은 산업 현장에서의 신뢰성 문제
가변 주파수 구동 장치, 용접 라인, 전력 변환기는 전자기 간섭을 발생시키며, 일부 공장에서는 패킷 성공률이 90%라는 신뢰성 기준치를 밑도는 경우가 있습니다. 운영자는 안전상 중요한 루프에서 중복 네트워크를 채택하거나 유선 연결로 되돌아갈 수밖에 없습니다. 메쉬 토폴로지, 주파수 호핑, 첨단 안테나는 간섭을 줄여주지만, 비용과 복잡성을 증가시킵니다. 금속 및 자동차 공장에서는 여전히 간섭이 만연하기 때문에 사업자들은 실시간 제어를 위한 무선 도입을 승인하기 전에 엄격한 인증 시험을 실시하고 있으며, 이러한 신중한 태도가 산업용 무선 센서 시장의 확장을 부분적으로 억제하고 있습니다.
부문 분석
2025년, 압력 센서는 산업용 무선 센서 시장에서 26.65%의 점유율을 차지했습니다. 이는 전반적인 공정 산업에서 파이프라인의 건전성과 안전성을 확보하기 위해 압력 센서의 사용이 필수적임을 반영합니다. 지속적인 압력 모니터링을 통해 치명적인 누출을 방지하고 엄격한 규제 감사 요건을 충족할 수 있으므로, 클래스 I 디비전 1 구역에서 배선 비용이 터무니없이 높은 경우 무선 기술로의 신속한 전환이 정당화됩니다. 진동 노드는 연평균 성장률(CAGR) 18.92%로 가장 빠르게 성장하고 있으며, 예측 유지보수가 초기 시범 단계에서 전사적 표준으로 진화함에 따라 회전 장비에 대한 멀티 센서 도입이 촉진되고 있습니다.
온도, 유량, 가스 각 카테고리는 환경 관리 및 품질 관리 분야에서 널리 채택되고 있는 반면, 습도 및 레벨 측정 장치는 식품, 제약, 탱크 저장 부문에서 틈새 시장이지만 증가 추세에 있는 규제 요건을 충족하고 있습니다. 이미징 및 바이오 센싱은 여전히 발전 단계에 있지만, 향후 10년 동안 엣지 AI가 산업용 무선 센서 산업의 감지 기법을 어떻게 확대해 나갈지를 보여주고 있습니다. 산업 부문의 구매자들은 설치 작업을 최대 40%까지 줄일 수 있는 모듈형 폼 팩터와 본질 안전형 하우징을 선호합니다. 각 벤더들은 현재 경보의 심각도를 등급화하기 위한 엣지 분석 기능을 통합하여 오감지 및 유지보수 요청 건수를 줄이고 있습니다.
Wi-Fi는 기업 네트워크 내 높은 보급률과 IT 보안 대책과의 호환성 덕분에 44.65%의 점유율을 유지했습니다. 공장에서는 대역폭을 활용하여 고해상도 비디오 및 고급 분석 스트림을 가능하게 하는 제어실이나 실내 공정 구역에 Wi-Fi를 도입하는 경우가 많습니다. 그러나 LPWAN의 연평균 성장률(CAGR) 23.55%는 광산 및 파이프라인 회랑에 필수적인 킬로미터 단위의 커버리지와 수년에 걸친 배터리 수명을 갖춘 기술로 선호도가 이동하고 있음을 보여줍니다.
WirelessHART는 기존 HART 루프에 오버레이할 수 있기 때문에 석유화학 플랜트에서 확고한 입지를 유지하고 있으며, 수십 년에 걸친 설비 투자를 보호하고 있습니다. ISA 100.11a는 엔지니어링 비용이 높음에도 불구하고 결정론적 제어 시나리오에서 지지를 받고 있습니다. 블루투스와 Zigbee는 단거리 모바일 작업자 및 빌딩 자동화 이용 사례를 지원합니다. 5G NR의 산업용 슬라이스는 초저지연 모션 제어 부문에서 등장했으나, 그 도입 속도는 생태계의 성숙도에 따라 결정될 것으로 보입니다.
지역별 분석
북미는 2025년에도 34.35%의 매출 점유율을 유지했습니다. 이는 광대한 석유 파이프라인, 셰일 자산, 인더스트리 4.0으로의 개조를 추진하는 기존 브라운필드 공장에 힘입은 결과입니다. 미국의 정책은 민간 5G 네트워크를 뒷받침하고 있으며, 디지털 인프라에 대한 연방 정부의 세제 혜택이 도입을 가속화하고 있습니다. 캐나다의 광산 기업들은 수천 제곱킬로미터에 걸쳐 LoRaWAN을 구축하여 자율 주행 운반 차량 군을 모니터링하고 있습니다. 한편, 멕시코의 마키라도라에서는 니어쇼어링 계약에 따라 생산의 추적성을 강화하기 위해 무선 노드가 채택되고 있습니다.
아시아태평양은 13.95%라는 가장 높은 연평균 성장률(CAGR)을 기록하며, 2029년까지 북미를 추월할 것으로 예측됩니다. 중국은 2027년까지 1만 곳의 완전 연결 공장을 실현하는 것을 목표로 하고 있으며, 이를 위해서는 공정, 환경, 예측 기능을 위한 수백만 개의 센서가 필요합니다. 현지 OEM 기업들은 비용을 최적화한 LPWAN 장치를 제공하고 있으며, 이로 인해 Tier 2 제조업체의 진입 장벽이 낮아지고 있습니다. 일본의 주요 자동차 및 전자 기업들은 품질 변동을 조기에 감지하는 엣지 지원 센서를 통해 적시 생산(JIT) 워크플로우를 정교화하고 있습니다.
유럽에서는 ‘인더스트리 4.0’ 정책과 EU 그린 딜에 따라 공장의 에너지 및 배출량 감사가 의무화되면서 시장이 꾸준히 성장하고 있습니다. 독일의 공정 플랜트에서는 WirelessHART와 OPC UA 게이트웨이를 통합하여 전반적인 가시성을 실현하고 있습니다. 북유럽의 풍력·태양광 발전소에서는 가혹한 기후 조건 하에서 기계적 고장을 사전에 방지하기 위해 터빈 전체에 진동 센서와 변형 센서를 설치하고 있습니다. 이 대륙에서는 엄격한 사이버 보안 규제가 유지되고 있어, IEC 62443 인증을 받은 장치에 대한 수요가 증가하고 있습니다.
기타 혜택
- 엑셀 형식 시장 예측(ME) 시트
- 3개월간의 애널리스트 지원
자주 묻는 질문
목차
제1장 서론
제2장 조사 방법
제3장 주요 요약
제4장 시장 구도
제5장 시장 규모와 성장 예측
제6장 경쟁 구도
제7장 시장 기회와 향후 전망
JHS 26.09.09According to Mordor Intelligence, the industrial wireless sensors market size is expected to grow from USD 7.96 billion in 2025 to USD 9.03 billion in 2026 and is forecast to reach USD 17.04 billion by 2031 at 13.48% CAGR over 2026-2031.
This report is Segmented by Product Type (Temperature Sensor, Pressure Sensor, Gas Sensor, and More), Communication Protocol (WirelessHART, ISA100. 11a, and More), Power Source (Battery-Powered, Energy-Harvesting, and More), End-User Industry (Manufacturing, Oil and Gas, Energy and Power, and More) and by Geography. The Market Forecasts are Provided in Terms of Value (USD).
Global Industrial Wireless Sensor Market Trends and Insights
Edge-to-Cloud Analytics Demand Surge
Industrial operators now send only distilled insights instead of raw data to enterprise platforms, easing bandwidth burdens and cutting latency. Ultracompact sensors with embedded AI algorithms from firms such as TDK run machine-learning routines locally, shrinking transmitted payloads by up to 90%. Private 5G networks pair with edge servers to deliver sub-millisecond responsiveness for motion control, a milestone that broadens industrial wireless sensors market applicability into closed-loop automation. Factories deploying edge-to-cloud frameworks report 20-25% productivity gains through real-time anomaly detection. The capability aligns with sustainability goals by reducing compute energy requirements and enables predictive maintenance strategies that detect failures days in advance.
Retrofit Digitalization of Brown-Field Plants
Legacy facilities avoid disruptive rewiring costs by adding wireless nodes to equipment already running at capacity. ISA data show retrofit projects using wireless instrumentation achieve payback periods 60% shorter than wired equivalents. European chemical producers install vibration nodes on pumps and compressors to extend operating life and satisfy strict emission rules. Wireless attributes are compelling in hazardous zones where replacing or adding cables demands explosion-proof conduits, making wireless sensors a low-risk path to compliance. As brownfield estates outnumber new builds, retrofit activity will sustain double-digit volume growth across the industrial wireless sensors market well into the next decade.
Reliability Concerns in RF-Noisy Industrial Sites
Variable-frequency drives, welding lines, and power converters emit electromagnetic interference that degrades packet success rates beyond 90% reliability thresholds in some factories. Operators resort to redundant networks or revert to wired links for safety-critical loops. Mesh topologies, frequency hopping, and advanced antennas mitigate disruptions yet add cost and complexity. As interference remains prevalent in metals and automotive plants, operators apply strict qualification tests before approving wireless for real-time control, a cautionary stance that tempers portions of the industrial wireless sensors market expansion.
Other drivers and restraints analyzed in the detailed report include:
- Low-Power Wide-Area (LPWA) Chipset Price Collapse
- Shift to Predictive Maintenance Service Models
- Scarcity of OT-Centric Cybersecurity Talent
For complete list of drivers and restraints, kindly check the Table Of Contents.
Segment Analysis
Pressure devices secured 26.65% industrial wireless sensors market share in 2025, reflecting their mandatory use for pipeline integrity and safety across process industries. Continuous pressure tracking avoids catastrophic leaks and satisfies stringent regulatory audits, justifying accelerated wireless retrofits where cabling through Class I Div 1 zones is cost-prohibitive. Vibration nodes grow fastest at 18.92% CAGR as predictive maintenance evolves from early pilots to corporate-wide standards, driving multi-sensor installations on rotating assets.
Temperature, flow, and gas categories secure broad adoption for environmental and quality control, while humidity and level units address niche but rising regulatory mandates in food, pharma, and tank storage. Imaging and biosensing remain nascent yet illustrate how edge AI will broaden sensing modalities within the industrial wireless sensors industry over the coming decade. Industrial buyers favor modular form factors and intrinsically safe housings that slash installation labor by up to 40%. Vendors now embed edge analytics to rank alarm severity, reducing false positives and maintenance tickets.
Wi-Fi retained a 44.65% share due to its ubiquity in enterprise networks and alignment with IT security controls. Plants often deploy Wi-Fi in control rooms and indoor process areas where bandwidth enables high-definition video or advanced analytics streams. Yet LPWAN's 23.55% CAGR indicates shifting preferences toward kilometer-scale coverage with multi-year battery life, critical for mines and pipeline corridors.
WirelessHART stays entrenched in petrochemical sites because it overlays existing HART loops, safeguarding decades of capital investment. ISA100.11a appeals to deterministic control scenarios despite higher engineering expense. Bluetooth and Zigbee service short-range mobile worker and building automation use cases. 5G NR industrial slices debut in ultra-low latency motion control, yet ecosystem maturity will dictate adoption pace.
Complete Report Scope:
- By Product Type
- Temperature Sensor
- Pressure Sensor
- Flow Sensor
- Gas Sensor
- Humidity Sensor
- Vibration Sensor
- Level Sensor
- Imaging Sensor
- Biosensor
- Other Product Types
- By Communication Protocol
- WirelessHART
- ISA100.11a
- Wi-Fi
- Bluetooth / BLE
- Zigbee
- 6LoWPAN / Thread
- LPWAN (LoRa, Sigfox)
- 5G NR (Rel-17 Industrial)
- By Power Source
- Battery-Powered
- Energy-Harvesting
- Wired-Powered Gateways
- By End-user Industry
- Manufacturing
- Automotive
- Food and Beverage
- Chemicals
- Pharmaceuticals
- Electronics and Semiconductor
- Oil and Gas
- Energy and Power
- Mining and Metals
- Healthcare Facilities
- Smart Buildings and Infrastructure
- Other Industries
- Manufacturing
- By Geography
- North America
- United States
- Canada
- Mexico
- South America
- Brazil
- Argentina
- Rest of South America
- Europe
- Germany
- United Kingdom
- France
- Italy
- Spain
- Russia
- Rest of Europe
- APAC
- China
- Japan
- India
- South Korea
- Australia
- Rest of APAC
- Middle East and Africa
- Middle East
- Saudi Arabia
- United Arab Emirates
- Turkey
- Rest of Middle East
- Africa
- South Africa
- Nigeria
- Kenya
- Rest of Africa
- Middle East
- North America
Geography Analysis
North America preserved a 34.35% revenue share in 2025, supported by sprawling oil pipelines, shale assets, and established brown-field factories embracing Industry 4.0 retrofits. U.S. policy spurs private 5G networks, and federal tax incentives for digital infrastructure accelerate deployments. Canadian miners deploy LoRaWAN over thousands of square kilometers to supervise autonomous haulage fleets, while Mexican maquiladoras adopt wireless nodes to enhance production traceability under nearshoring contracts.
Asia Pacific records the fastest 13.95% CAGR and will surpass North America before 2029. China targets 10,000 fully connected factories by 2027, requiring millions of sensors for process, environmental, and predictive functions. Local OEMs offer cost-optimized LPWAN devices, lowering entry barriers for tier-two manufacturers. Japanese automotive and electronics giants refine just-in-time workflows through edge-enabled sensors that spot quality drifts early.
Europe grows steadily as Industrie 4.0 policies and the EU Green Deal compel factories to audit energy and emissions. German process plants integrate WirelessHART with OPC UA gateways for holistic visibility. Nordic wind and solar farms blanket turbines with vibration and strain sensors to pre-empt mechanical faults under harsh climate loads. The continent maintains stringent cybersecurity mandates, elevating demand for IEC 62443-validated devices.
- ABB Ltd.
- Rockwell Automation Inc.
- Honeywell International Inc.
- Siemens AG
- Schneider Electric SE
- STMicroelectronics N.V.
- Emerson Electric Co.
- General Electric Co.
- Texas Instruments Inc.
- NXP Semiconductors N.V.
- BAE Systems plc
- Yokogawa Electric Corp.
- Banner Engineering Corp.
- Phoenix Contact GmbH and Co. KG
- Advantech Co., Ltd.
- Cisco Systems, Inc.
- Analog Devices, Inc.
- TE Connectivity Ltd.
- Robert Bosch GmbH (Bosch Sensortec)
- Sensirion AG
- Endress+Hauser Group
- Hitachi Ltd.
Additional Benefits:
- The market estimate (ME) sheet in Excel format
- 3 months of analyst support
TABLE OF CONTENTS
1 INTRODUCTION
- 1.1 Study Deliverables
- 1.2 Study Assumptions
- 1.3 Scope of the Study
2 RESEARCH METHODOLOGY
3 EXECUTIVE SUMMARY
4 MARKET LANDSCAPE
- 4.1 Market Overview
- 4.2 Market Drivers
- 4.2.1 Edge-to-Cloud analytics demand surge
- 4.2.2 Retrofit digitalization of brown-field plants
- 4.2.3 Low-power wide-area (LPWA) chipset price collapse
- 4.2.4 Shift to predictive maintenance service-models
- 4.2.5 Cybersecure sensor-to-cloud gateways (IEC 62443) uptake
- 4.2.6 Decarbonization mandates in hard-to-abate sectors
- 4.3 Market Restraints
- 4.3.1 Reliability concerns in RF-noisy industrial sites
- 4.3.2 Scarcity of OT-centric cybersecurity talent
- 4.3.3 Battery-life replacement OPEX in large-scale roll-outs
- 4.3.4 Fragmented protocol ecosystem slowing standards
- 4.4 Value / Supply-Chain Analysis
- 4.5 Regulatory Landscape
- 4.6 Technological Outlook
- 4.7 Porter's Five Forces
- 4.7.1 Bargaining Power of Suppliers
- 4.7.2 Bargaining Power of Buyers
- 4.7.3 Threat of New Entrants
- 4.7.4 Threat of Substitute Products
- 4.7.5 Intensity of Competitive Rivalry
5 MARKET SIZE AND GROWTH FORECASTS (VALUE)
- 5.1 By Product Type
- 5.1.1 Temperature Sensor
- 5.1.2 Pressure Sensor
- 5.1.3 Flow Sensor
- 5.1.4 Gas Sensor
- 5.1.5 Humidity Sensor
- 5.1.6 Vibration Sensor
- 5.1.7 Level Sensor
- 5.1.8 Imaging Sensor
- 5.1.9 Biosensor
- 5.1.10 Other Product Types
- 5.2 By Communication Protocol
- 5.2.1 WirelessHART
- 5.2.2 ISA100.11a
- 5.2.3 Wi-Fi
- 5.2.4 Bluetooth / BLE
- 5.2.5 Zigbee
- 5.2.6 6LoWPAN / Thread
- 5.2.7 LPWAN (LoRa, Sigfox)
- 5.2.8 5G NR (Rel-17 Industrial)
- 5.3 By Power Source
- 5.3.1 Battery-Powered
- 5.3.2 Energy-Harvesting
- 5.3.3 Wired-Powered Gateways
- 5.4 By End-user Industry
- 5.4.1 Manufacturing
- 5.4.1.1 Automotive
- 5.4.1.2 Food and Beverage
- 5.4.1.3 Chemicals
- 5.4.1.4 Pharmaceuticals
- 5.4.1.5 Electronics and Semiconductor
- 5.4.2 Oil and Gas
- 5.4.3 Energy and Power
- 5.4.4 Mining and Metals
- 5.4.5 Healthcare Facilities
- 5.4.6 Smart Buildings and Infrastructure
- 5.4.7 Other Industries
- 5.4.1 Manufacturing
- 5.5 By Geography
- 5.5.1 North America
- 5.5.1.1 United States
- 5.5.1.2 Canada
- 5.5.1.3 Mexico
- 5.5.2 South America
- 5.5.2.1 Brazil
- 5.5.2.2 Argentina
- 5.5.2.3 Rest of South America
- 5.5.3 Europe
- 5.5.3.1 Germany
- 5.5.3.2 United Kingdom
- 5.5.3.3 France
- 5.5.3.4 Italy
- 5.5.3.5 Spain
- 5.5.3.6 Russia
- 5.5.3.7 Rest of Europe
- 5.5.4 APAC
- 5.5.4.1 China
- 5.5.4.2 Japan
- 5.5.4.3 India
- 5.5.4.4 South Korea
- 5.5.4.5 Australia
- 5.5.4.6 Rest of APAC
- 5.5.5 Middle East and Africa
- 5.5.5.1 Middle East
- 5.5.5.1.1 Saudi Arabia
- 5.5.5.1.2 United Arab Emirates
- 5.5.5.1.3 Turkey
- 5.5.5.1.4 Rest of Middle East
- 5.5.5.2 Africa
- 5.5.5.2.1 South Africa
- 5.5.5.2.2 Nigeria
- 5.5.5.2.3 Kenya
- 5.5.5.2.4 Rest of Africa
- 5.5.5.1 Middle East
- 5.5.1 North America
6 COMPETITIVE LANDSCAPE
- 6.1 Market Concentration
- 6.2 Strategic Moves
- 6.3 Market Share Analysis
- 6.4 Company Profiles (includes Global level Overview, Market level overview, Core Segments, Financials as available, Strategic Information, Market Rank/Share, Products and Services, Recent Developments)
- 6.4.1 ABB Ltd.
- 6.4.2 Rockwell Automation Inc.
- 6.4.3 Honeywell International Inc.
- 6.4.4 Siemens AG
- 6.4.5 Schneider Electric SE
- 6.4.6 STMicroelectronics N.V.
- 6.4.7 Emerson Electric Co.
- 6.4.8 General Electric Co.
- 6.4.9 Texas Instruments Inc.
- 6.4.10 NXP Semiconductors N.V.
- 6.4.11 BAE Systems plc
- 6.4.12 Yokogawa Electric Corp.
- 6.4.13 Banner Engineering Corp.
- 6.4.14 Phoenix Contact GmbH and Co. KG
- 6.4.15 Advantech Co., Ltd.
- 6.4.16 Cisco Systems, Inc.
- 6.4.17 Analog Devices, Inc.
- 6.4.18 TE Connectivity Ltd.
- 6.4.19 Robert Bosch GmbH (Bosch Sensortec)
- 6.4.20 Sensirion AG
- 6.4.21 Endress+Hauser Group
- 6.4.22 Hitachi Ltd.
7 MARKET OPPORTUNITIES AND FUTURE OUTLOOK
- 7.1 White-space and Unmet-Need Assessment

(주말 및 공휴일 제외)


