

|
시장보고서
상품코드
2123039
바이오플라스틱 포장 시장 : 시장 점유율 분석, 업계 동향 및 통계, 성장 예측(2026-2031년)Bioplastics Packaging - Market Share Analysis, Industry Trends & Statistics, Growth Forecasts (2026 - 2031) |
||||||
 Mordor Intelligence
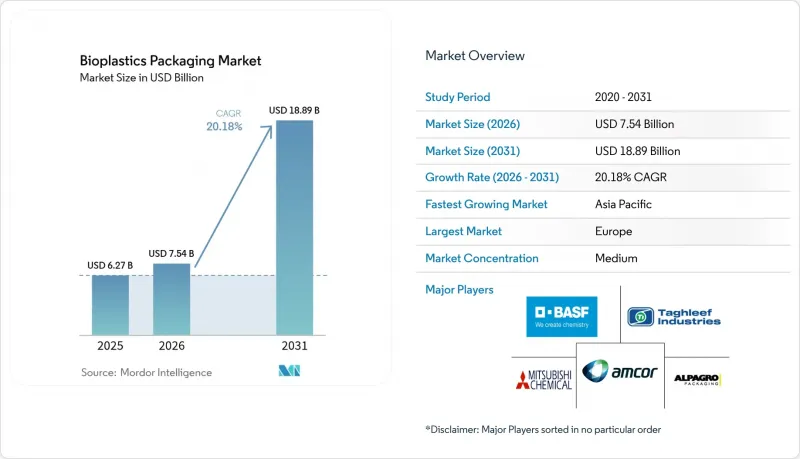
Mordor Intelligence에 의하면, 바이오플라스틱 포장 시장 규모는 2025년 62억 7,000만 달러로 평가되었고, 2026년에는 75억 4,000만 달러로 추정되고, 2026-2031년 CAGR 20.18%로 성장을 지속할 전망이며, 2031년에는 188억 9,000만 달러에 이를 것으로 예측됩니다.
본 보고서는 소재 유형별(비생분해성 바이오플라스틱, 생분해성 바이오플라스틱), 제품 유형별(경질 포장, 연질 포장), 최종 이용 산업별(식품, 음료, 의약품, 퍼스널케어 및 화장품, 기타 최종 이용 산업), 유통 채널별(직접 판매, 간접 판매), 지역별로 분류되어 있습니다. 시장 전망은 금액(달러) 기준으로 제시되어 있습니다.
세계의 바이오플라스틱 포장 시장 동향 및 인사이트
바이오 포장재 채택을 촉진하는 전 세계 EPR 법안
캘리포니아주, 유럽연합(EU), 케냐의 의무적인 EPR(확대 생산자 책임) 제도는 사용 후 비용을 내부화함으로써 기존 플라스틱에서 재생 가능한 대체재로 전환하는 데 대한 직접적인 금전적 인센티브를 창출하고 있습니다. 생산자는 현재 재활용 가능성, 퇴비화 가능성 및 재생 재료 함유율에 따라 서로 다른 요금이 부과되므로, 바이오플라스틱 포장 시장에서 바이오플라스틱 소재의 비용 경쟁력이 높아지고 있습니다. 2025년 3월부터 통일되는 보고 기한으로 인해 국경을 초월한 규정 준수가 간소화되어, 다국적 브랜드 소유자들이 지속 가능한 포장 형태를 표준화하도록 촉진되고 있습니다. 재활용이 불가능한 기판에 벌금을 부과하는 요금 조정 정책으로 인해 바이오플라스틱 포장의 잠재 시장은 더욱 확대되고 있습니다. 규제 일정이 태국과 UAE의 대규모 PLA 공장 가동 시작 시기와 맞물리면서, 예측 가능한 공급과 가격 하락이 도입의 추진력을 더욱 강화하고 있습니다.
다국적 외식 체인 수요 급증
주요 레스토랑 브랜드들은 퇴비화 가능한 포장의 시범 도입과 본격적인 확대를 가속화하며, 바이오플라스틱 포장 시장에 새로운 수요 흐름을 창출하고 있습니다. 맥도날드의 컵에는 현재 50%의 바이오폴리머 블렌드가 사용되고 있으며, 스타벅스는 미국 여러 주에서 성형 섬유 소재의 콜드 컵 시범 도입을 확대되고 있습니다. 이들 기업은 조달 규모를 활용해 단위당 수지 비용을 절감하는 동시에 소비자의 수용도를 검증하고 있습니다. 분리 수거 작업의 간소화, 매립 처리 비용 절감, 브랜드 가치 향상과 같은 운영상의 이점이 지속적인 구매를 뒷받침하고 있습니다. 이러한 급속한 도입은 컨버터들에게 바이오플라스틱 제품이 설비 변경으로 인한 병목 현상을 일으키지 않으면서도 기존 기판과 동등한 처리 능력을 발휘할 수 있음을 보여주고 있습니다.
바이오 유래 원료의 만성적인 부족
브라질의 에탄올 생산량이 사상 최고치를 기록하고, 미국의 재생 가능 연료 기준(RFS)에 따른 공급량 증가로 인해 원료를 둘러싼 경쟁이 격화되고 있습니다. 이로 인해 PLA 및 바이오 PET 생산의 기반이 되는 옥수수와 설탕 가격이 상승하고 있습니다. 바이오연료 생산자들은 법으로 정해진 수요 할당량과 세액 공제 덕분에 대부분의 경우 원료 배분 경쟁에서 승리하고 있습니다. 네이처웍스(NatureWorks)사가 카사바나 리그노셀룰로스를 원료로 하는 방식을 모색하고 있기는 하지만, 비농작물 유래 원료가 충분한 규모에 도달하기 전까지는 원료 부족이 바이오플라스틱 포장 시장에게 구조적인 역풍으로 남아 있을 것입니다.
부문 분석
2025년, 바이오 PET는 바이오플라스틱 포장 시장에서 39.10%의 점유율을 차지했습니다. 이는 생산자들이 기존의 PET 재활용 흐름을 활용하여 신속한 드롭인(drop-in) 대체를 실현했기 때문입니다. 이 부문은 ISCC PLUS 인증을 받은 바이오매스 유래 PTA 공급망의 혜택을 받고 있습니다. 코카콜라의 1억 8,000만 유로 규모 유럽 전환 사례는 대규모 구매자가 수지의 프리미엄 가격에 하방 압력을 가함으로써 바이오플라스틱 포장 시장 규모가 안정적으로 확대될 것임을 뒷받침하고 있습니다. PHA는 현재로서는 틈새 시장 점유율에 그치고 있지만, 업계 재편이 안정되고 특수 등급이 해양 분해성 용도를 목표로 삼음에 따라 연평균 성장률(CAGR) 21.65%를 나타낼 것으로 예측됩니다.
생분해성 폴리머 중 전분 블렌드는 여전히 생산량 1위를 차지하고 있으며, 옥수수, 감자, 카사바를 원료로 함으로써 가격 헤지의 유연성이 확보되고 있습니다. 태국과 UAE의 PLA 생산 능력이 지역 공급을 뒷받침하는 한편, PBAT 및 PBS는 더 낮은 가공 온도에서 높은 인성이 요구되는 필름 분야에서 성장세를 보이고 있습니다. 이중 조달 전략을 통해 컨버터는 수지 가격 변동 위험으로부터 보호받으며, 바이오플라스틱 포장 시장은 가격 충격에 대한 회복력을 유지하고 있습니다.
2025년에는 연포장재가 매출의 57.62%를 차지했으며, 연평균 성장률(CAGR) 21.05%로 시장을 주도할 것으로 예측됩니다. 필름, 랩, 파우치는 PLA 및 바이오 PE의 기계적 특성과 차단성과 잘 부합합니다. 네슬레가 1억 2,000만 스위스 프랑을 투자하여 유럽에서 진행한 설비 갱신은 전환에 필요한 자본을 보여주는 한편, 수지 가격 상승을 상쇄할 만큼 소비자의 수용도가 높다는 사실도 입증하고 있습니다. 아크레드(Acred)사의 사탕수수 유래 파우치 시리즈는 조달 결정을 뒷받침하는 탄소 감축 효과를 부각시키고 있습니다.
경질 용기는 열변형 온도 기준이 더 높기 때문에 보급이 더딘 편이지만, 다층 구조의 PLA-셀룰로오스 소재는 상온 보관이 가능한 소스에 적합한 산소 차단성 수준에 점차 가까워지고 있습니다. 연포장 용도에서 경질 포장 용도로의 기술 확산에 따라 성능 격차는 줄어들고 있으며, 보다 광범위한 바이오플라스틱 포장 시장에서 새로운 수익원이 열리고 있습니다.
지역별 분석
2025년, 유럽은 바이오플라스틱 포장 시장의 37.95%를 차지했으며, 여전히 가장 규모가 큰 지역 기여자로 자리매김했습니다. 이는 2030년까지 보편적인 재활용 가능성을 의무화하고, 식품 접촉 물품에서의 PFAS 사용을 금지하는 ‘포장 및 포장 폐기물 규정’에 힘입은 결과입니다. 독일의 VerpackG에 따라 2024년에는 21억 유로의 EPR(확대 생산자 책임) 수수료가 부과됨에 따라, 브랜드 소유자들은 수수료가 30% 할인되는 바이오 포장 형태를 선택하게 되었습니다. 남유럽에서는 신선 식품용 필름의 채택이 급속히 진행되는 반면, 북유럽 시장에서는 콜드체인 사양을 충족하는 경질 요거트 컵에 초점이 맞추어져 있습니다.
아시아태평양은 가장 빠르게 성장하는 지역으로, 2031년까지 연평균 성장률(CAGR)이 21.93%를 나타낼 것으로 예측됩니다. 인도의 추적성 규정, 중국의 GB 43352-2023, 그리고 일본 정부의 생분해성 대체재 조달로 인해 정책적 지원과 투자 촉진이 일치하고 있습니다. 네이처웍스(NatureWorks)와 발람푸르 치니 밀스(Bhalampur Chini Mills)는 국내 가공업체에 제품을 공급하고 있으며, 이를 통해 운송 비용 절감과 환율 변동 위험을 헤지하고 있습니다. 농업 원료에 대한 접근성 덕분에 아세안(ASEAN) 국가들은 수요가 높은 EU 시장으로의 전략적 수출 거점으로서의 입지를 확립하고 있으며, 이로 인해 해당 지역의 바이오플라스틱 포장 시장 규모가 확대되고 있습니다.
북미에서는 캘리포니아주, 오리건주, 콜로라도주가 매년 단계적으로 인상되는 EPR(생산자 책임 회수) 요금 체계를 확정하며 견조한 성장세를 보이고 있습니다. 맥도날드와 스타벅스에서 진행하는 외식 산업 대상 시범 프로그램을 통해 하류 컨버터의 인증이 가속화되고 있습니다. 퇴비화 시설 구축을 위한 7,500만 달러 규모의 연방 보조금은 인프라의 균일화가 임박했음을 보여주며, 해안 도시를 넘어 바이오플라스틱 포장 시장이 확산되는 데 중요한 촉진요인이 될 것입니다. 캐나다와 멕시코는 국경을 넘는 공급망을 보호하기 위해 통일된 표시 기준을 채택함으로써, 통합적인 브랜드 확장을 위한 규제상의 명확성을 확보하고 있습니다.
기타 혜택 :
- 엑셀 형식 시장 예측(ME) 시트
- 3개월간의 애널리스트 지원
자주 묻는 질문
목차
제1장 서론
제2장 조사 방법
제3장 주요 요약
제4장 시장 구도
제5장 시장 규모 및 성장 예측
제6장 경쟁 구도
제7장 시장 기회 및 향후 전망
AJY 26.09.07According to Mordor Intelligence, the bioplastic packaging market size is expected to grow from USD 6.27 billion in 2025 to USD 7.54 billion in 2026 and is forecast to reach USD 18.89 billion by 2031 at 20.18% CAGR over 2026-2031.
This report is Segmented by Material Type (Non-Biodegradable Bioplastics, Biodegradable Bioplastics), Product Type (Rigid Packaging, Flexible Packaging), End-Use Industry (Food, Beverages, Pharmaceuticals, Personal Care and Cosmetics, Other End-Use Industry), Distribution Channel (Direct Sales, Indirect Sales), and Geography. The Market Forecasts are Provided in Terms of Value (USD).
Global Bioplastics Packaging Market Trends and Insights
Global EPR legislation driving bio-based packaging adoption
Mandatory EPR schemes in California, the European Union, and Kenya internalize end-of-life costs, creating direct financial incentives to switch from conventional plastics to renewable alternatives. Producers now face differentiated fees based on recyclability, compostability, and recycled content, making bioplastic materials more cost-competitive in the bioplastic packaging market. Harmonized reporting deadlines beginning March 2025 simplify cross-border compliance, encouraging multinational brand owners to standardize sustainable formats. Fee modulation policies that penalize non-recyclable substrates further enlarge the addressable bioplastic packaging market. As regulatory timelines converge with the start-up of large PLA plants in Thailand and the UAE, predictable supply and lower prices reinforce adoption momentum.
Demand surge from multinational food-service chains
Leading restaurant brands accelerated trials and roll-outs of compostable formats, catalyzing new volume streams in the bioplastic packaging market. McDonald's cups now use a 50% biopolymer blend, while Starbucks has extended molded-fiber cold-cup pilots across several US states. These firms leverage procurement scale to compress per-unit resin costs and validate consumer acceptance. Operational benefits-simpler sorting, reduced landfill fees, and brand equity gains-reinforce repeat purchasing. Their rapid adoption signals to converters that bioplastic stock-keeping units can match the throughput of conventional substrates without retooling bottlenecks.
Chronic shortage of bio-based feedstock
Record ethanol runs in Brazil and rising US Renewable Fuel Standard volumes intensify feedstock competition, inflating corn and sugar prices that underpin PLA and Bio-PET production. Biofuel producers often win allocation battles thanks to legislated demand quotas and tax credits. While NatureWorks explores cassava and lignocellulosic routes, feedstock scarcity remains a structural headwind to the bioplastic packaging market until non-crop inputs reach scale.
Other drivers and restraints analyzed in the detailed report include:
- Asia-Pacific policy shifts creating momentum
- Capacity expansion in Bio-PET and PLA
- Inconsistent industrial composting infrastructure
For complete list of drivers and restraints, kindly check the Table Of Contents.
Segment Analysis
Bio-PET held 39.10% share of the bioplastic packaging market in 2025 as producers leveraged existing PET recycling streams for rapid drop-in substitution. The segment benefits from biomass-based PTA supply chains certified under ISCC PLUS. Coca-Cola's EUR 180 million European transition illustrates how large buyers exert downward pressure on resin premiums, supporting stable bioplastic packaging market size expansion. PHA, while only a niche share today, is forecast at 21.65% CAGR as consolidation stabilizes and specialty grades target marine-degradable applications.
Starch blends remain the volume leader among biodegradable polymers, with maize, potato, and cassava feedstocks offering price hedging flexibility. PLA capacity from Thailand and the UAE boosts regional supply, while PBAT and PBS gain traction in films requiring enhanced toughness at lower processing temperatures. Dual-sourcing strategies protect converters from resin volatility, keeping the bioplastic packaging market resilient to price shocks.
Flexible formats commanded 57.62% of 2025 revenue and are projected to lead at a 21.05% CAGR. Films, wraps, and pouches align well with the mechanical and barrier properties of PLA and Bio-PE. Nestle's CHF 120 million European retrofit shows the capital needed to switch over but also demonstrates consumer acceptance premiums that offset higher resin prices. Accredo's sugarcane-based pouch series underscores carbon-reduction gains that drive procurement decisions.
Rigid containers lag due to higher heat-deflection standards, yet multilayer PLA-cellulose structures now approach oxygen barrier levels suitable for ambient sauces. Technology spillover from flexible to rigid applications is narrowing the performance delta, opening new revenue pockets inside the broader bioplastic packaging market.
Complete Report Scope:
- By Material Type
- Non-Biodegradable Bioplastics
- Bio-PET
- Bio-PE
- Other Non-Biodegradable Bioplastics
- Biodegradable Bioplastics
- Starch Blends
- Polylactic Acid (PLA)
- Poly(Butylene Adipate-co-Terephthalate) (PBAT)
- Polybutylene Succinate (PBS)
- Polyhydroxyalkanoates (PHA)
- Other Biodegradable Bioplastics
- Non-Biodegradable Bioplastics
- By Product Type
- Rigid Packaging
- Bottles and Jars
- Trays and Containers
- Other Rigid Packaging
- Flexible Packaging
- Films and Wraps
- Pouches and Bags
- Other Flexible Packaging
- Rigid Packaging
- By End-Use Industry
- Food
- Beverages
- Pharmaceuticals
- Personal Care and Cosmetics
- Other End - Use Industry
- By Distribution Channel
- Direct Sales
- Indirect Sales
- By Geography
- North America
- United States
- Canada
- Mexico
- Europe
- Germany
- United Kingdom
- France
- Italy
- Spain
- Russia
- Rest of Europe
- Asia-Pacific
- China
- India
- Japan
- South Korea
- Australia and New Zealand
- Rest of Asia-Pacific
- Middle East and Africa
- Middle East
- United Arab Emirates
- Saudi Arabia
- Turkey
- Rest of Middle East
- Africa
- South Africa
- Nigeria
- Egypt
- Rest of Africa
- Middle East
- South America
- Brazil
- Argentina
- Rest of South America
- North America
Geography Analysis
Europe remained the largest regional contributor with 37.95% of the bioplastic packaging market in 2025, driven by the Packaging and Packaging Waste Regulation that mandates universal recyclability by 2030 and bans PFAS in food contact articles. Germany's VerpackG imposed EUR 2.1 billion EPR fees in 2024, prompting brand owners to select bio-based formats that earn 30% fee discounts. Southern Europe witnesses swift adoption in fresh-produce films, while Northern markets focus on rigid yoghurt cups that meet cold-chain specifications.
Asia-Pacific is the fastest-growing region, projected at 21.93% CAGR through 2031. India's traceability rule, China's GB 43352-2023, and Japanese government procurement of biodegradable alternatives align policy levers with investment stimuli. NatureWorks and Balrampur Chini Mills supply domestic converters, cutting freight costs and hedging against currency swings. Proximity to agricultural feedstocks positions ASEAN nations as strategic export bases to high-demand EU markets, amplifying the bioplastic packaging market size in the region.
North America shows robust momentum as California, Oregon, and Colorado finalize EPR fee schedules that escalate annually. Food-service pilot programs at McDonald's and Starbucks accelerate downstream converter qualifications. Federal grants worth USD 75 million for composting build-outs signal impending infrastructure parity, a critical enabler for bioplastic packaging market penetration beyond coastal cities. Canada and Mexico adopt harmonized labeling to protect cross-border supply chains, ensuring regulatory clarity for integrated brand roll-outs.
- BIO PACKAGING FILMS
- Folietec Kunststoffwerk AG
- HUBEI HYF PACKAGING CO., LTD.
- BIO FUTURA B.V.
- PLABOTTLES.EU (GLOBAL SOLUTIONS B.V.)
- FKUR KUNSTSTOFF GMBH
- PACTIV EVERGREEN INC.
- POUCH ME
- GS-Company
- GracePack
- NaKu eU
- Easy Green Eco Packaging Co., Ltd
- Amcor Plc
- PLAMFG
- COMPAC SRL
- Jarsking Group
- Zhejiang Sanle Plastic Co.,Ltd
- Shanghai COPAK Industry Co., LTD,
- Greendot Biopak Pvt. Ltd.
- Biogreen Biotech
Additional Benefits:
- The market estimate (ME) sheet in Excel format
- 3 months of analyst support
TABLE OF CONTENTS
1 INTRODUCTION
- 1.1 Study Assumptions and Market Definition
- 1.2 Scope of the Study
2 RESEARCH METHODOLOGY
3 EXECUTIVE SUMMARY
4 MARKET LANDSCAPE
- 4.1 Market Overview
- 4.2 Market Drivers
- 4.2.1 Global EPR Legislation Driving Bio-Based Packaging Adoption
- 4.2.2 Demand for bioplastic packaging surges as multinational food-service chains embrace compostable packaging
- 4.2.3 Asia-Pacific Policy Shifts Creating Momentum for Bioplastic Packaging
- 4.2.4 Expansion of global Bio-PET and PLA production is lowering cost barriers to adoption
- 4.2.5 Increasing adoption of bioplastic packaging among Luxury and personal care brands
- 4.2.6 Government Investment in Composting Infrastructure Accelerating Downstream Adoption
- 4.3 Market Restraints
- 4.3.1 Chronic shortage of bio-based feedstock owing to competing biofuel demand
- 4.3.2 Inconsistent industrial composting infrastructure hindering end-of-life claims
- 4.3.3 Functional performance limitations in high-temperature applications
- 4.4 Supply-Chain Analysis
- 4.5 Innovations in Bioplastics
- 4.6 Industry Ecosystem Analysis
- 4.7 Bioplastic - Production Landscape
- 4.8 Industry Standards and Regulations
- 4.9 Porter's Five Forces Analysis
- 4.9.1 Bargaining Power of Suppliers
- 4.9.2 Bargaining Power of Buyers
- 4.9.3 Threat of New Entrants
- 4.9.4 Threat of Substitute Products
- 4.9.5 Intensity of Competitive Rivalry
5 MARKET SIZE AND GROWTH FORECASTS (VALUE)
- 5.1 By Material Type
- 5.1.1 Non-Biodegradable Bioplastics
- 5.1.1.1 Bio-PET
- 5.1.1.2 Bio-PE
- 5.1.1.3 Other Non-Biodegradable Bioplastics
- 5.1.2 Biodegradable Bioplastics
- 5.1.2.1 Starch Blends
- 5.1.2.2 Polylactic Acid (PLA)
- 5.1.2.3 Poly(Butylene Adipate-co-Terephthalate) (PBAT)
- 5.1.2.4 Polybutylene Succinate (PBS)
- 5.1.2.5 Polyhydroxyalkanoates (PHA)
- 5.1.2.6 Other Biodegradable Bioplastics
- 5.1.1 Non-Biodegradable Bioplastics
- 5.2 By Product Type
- 5.2.1 Rigid Packaging
- 5.2.1.1 Bottles and Jars
- 5.2.1.2 Trays and Containers
- 5.2.1.3 Other Rigid Packaging
- 5.2.2 Flexible Packaging
- 5.2.2.1 Films and Wraps
- 5.2.2.2 Pouches and Bags
- 5.2.2.3 Other Flexible Packaging
- 5.2.1 Rigid Packaging
- 5.3 By End-Use Industry
- 5.3.1 Food
- 5.3.2 Beverages
- 5.3.3 Pharmaceuticals
- 5.3.4 Personal Care and Cosmetics
- 5.3.5 Other End - Use Industry
- 5.4 By Distribution Channel
- 5.4.1 Direct Sales
- 5.4.2 Indirect Sales
- 5.5 By Geography
- 5.5.1 North America
- 5.5.1.1 United States
- 5.5.1.2 Canada
- 5.5.1.3 Mexico
- 5.5.2 Europe
- 5.5.2.1 Germany
- 5.5.2.2 United Kingdom
- 5.5.2.3 France
- 5.5.2.4 Italy
- 5.5.2.5 Spain
- 5.5.2.6 Russia
- 5.5.2.7 Rest of Europe
- 5.5.3 Asia-Pacific
- 5.5.3.1 China
- 5.5.3.2 India
- 5.5.3.3 Japan
- 5.5.3.4 South Korea
- 5.5.3.5 Australia and New Zealand
- 5.5.3.6 Rest of Asia-Pacific
- 5.5.4 Middle East and Africa
- 5.5.4.1 Middle East
- 5.5.4.1.1 United Arab Emirates
- 5.5.4.1.2 Saudi Arabia
- 5.5.4.1.3 Turkey
- 5.5.4.1.4 Rest of Middle East
- 5.5.4.2 Africa
- 5.5.4.2.1 South Africa
- 5.5.4.2.2 Nigeria
- 5.5.4.2.3 Egypt
- 5.5.4.2.4 Rest of Africa
- 5.5.4.1 Middle East
- 5.5.5 South America
- 5.5.5.1 Brazil
- 5.5.5.2 Argentina
- 5.5.5.3 Rest of South America
- 5.5.1 North America
6 COMPETITIVE LANDSCAPE
- 6.1 Market Concentration
- 6.2 Strategic Moves and Developments
- 6.3 Market Share Analysis
- 6.4 Company Profiles (includes Global level Overview, Market level overview, Core Segments, Financials as available, Strategic Information, Market Rank/Share for key companies, Products and Services, and Recent Developments)
- 6.4.1 BIO PACKAGING FILMS
- 6.4.2 Folietec Kunststoffwerk AG
- 6.4.3 HUBEI HYF PACKAGING CO., LTD.
- 6.4.4 BIO FUTURA B.V.
- 6.4.5 PLABOTTLES.EU (GLOBAL SOLUTIONS B.V.)
- 6.4.6 FKUR KUNSTSTOFF GMBH
- 6.4.7 PACTIV EVERGREEN INC.
- 6.4.8 POUCH ME
- 6.4.9 GS-Company
- 6.4.10 GracePack
- 6.4.11 NaKu eU
- 6.4.12 Easy Green Eco Packaging Co., Ltd
- 6.4.13 Amcor Plc
- 6.4.14 PLAMFG
- 6.4.15 COMPAC SRL
- 6.4.16 Jarsking Group
- 6.4.17 Zhejiang Sanle Plastic Co.,Ltd
- 6.4.18 Shanghai COPAK Industry Co., LTD,
- 6.4.19 Greendot Biopak Pvt. Ltd.
- 6.4.20 Biogreen Biotech
7 MARKET OPPORTUNITIES AND FUTURE OUTLOOK
- 7.1 White-space and Unmet-need Assessment


