
|
시장보고서
상품코드
2123065
IaaS(Infrastructure As A Service) 시장 : 점유율 분석, 업계 동향과 통계, 성장 예측(2026-2031년)Infrastructure As A Service - Market Share Analysis, Industry Trends & Statistics, Growth Forecasts (2026 - 2031) |
||||||
 Mordor Intelligence
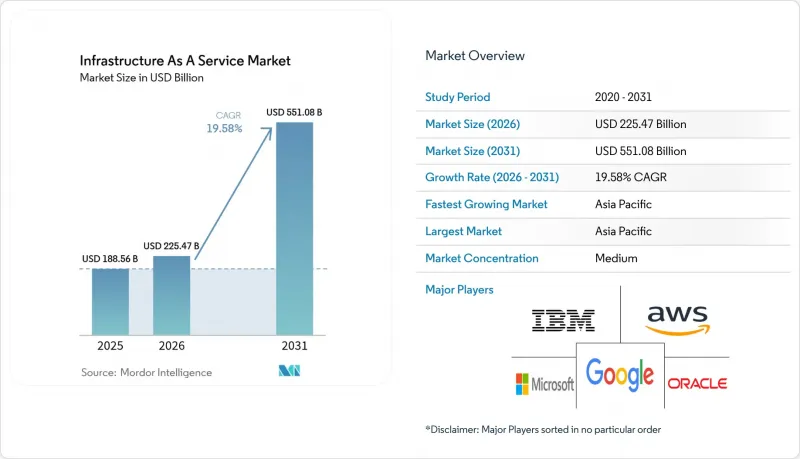
Mordor Intelligence에 의하면, IaaS(Infrastructure As A Service) 시장 규모는 2025년 1,885억 6,000만 달러에서 2026년에는 2,254억 7,000만 달러로 확대되어 2026년부터 2031년까지 CAGR 19.58%로 성장을 지속하여, 2031년에는 5,510억 8,000만 달러에 이를 것으로 예측됩니다.
본 보고서는 배포 방식(퍼블릭 클라우드, 프라이빗 클라우드, 하이브리드 클라우드), 서비스 유형(Compute As A Service(CaaS), Storage As A Service(STaaS),Database/Analytics As A Service(DBaaS) 등), 최종 사용자 산업(은행, 금융서비스 및 보험(BFSI), IT 및 통신, 헬스케어 및 생명과학), 지역별로 분류되어 있습니다.
전 세계 IaaS(Infrastructure As A Service) 시장 동향과 인사이트
생성형 AI 인프라에 대한 수요 가속화
생성형 AI 훈련 클러스터에는 칩 1개당 700W를 소비하는 GPU 랙이 필요하며, 이로 인해 액체 냉각 도입률은 2024년 데이터홀의 10%에서 2025년에는 약 20%로 상승할 전망입니다. 각 하이퍼스케일러 기업들은 현재 1MW 액체 냉각 랙을 중심으로 캠퍼스를 재설계하고 있으며, 변환 손실을 줄이기 위해 400V DC 배전을 표준화하고 있습니다(DataCenterFrontier). 기업들도 이러한 추세를 따르고 있으며, 데이터센터 운영사의 40% 가까이가 2026년까지 AI 워크로드를 호스팅하기 위해 액체 냉각을 도입할 계획입니다. 이러한 기술적 변화로 인해 시설 설계도가 재구성되고 있으며, AI 대응 설계가 IaaS 시장 전체에서 표준적인 요건이 되어가고 있습니다.
기업의 하이브리드 및 멀티클라우드 전환 급증
현재 조직들은 비용과 규정 준수의 균형을 맞추기 위해 워크로드를 여러 클라우드에 분산시키고 있습니다. 2024년 IBM이 64억 달러에 HashiCorp를 인수함에 따라 멀티클라우드 오케스트레이션의 자동화가 더욱 진전되고 있습니다. Oracle과 Google의 멀티 클라우드 제휴로 인해 Google 리전 내 Oracle Database의 아웃바운드 통신 요금이 무료화되어, 워크로드 이식성을 저해하던 오랜 장벽이 제거되었습니다. 특히 금융 업계에서 도입이 활발히 진행되고 있으며, 데이터 거주지 규제 및 운영 내성 테스트를 계기로 금융 기관의 70%가 파일럿 단계를 완료했습니다. 하이브리드 모델의 확대에 따라 전문 서비스 제공업체들은 거버넌스 및 보안 관련 자문 서비스를 통해 새로운 수익원을 발굴하며, IaaS 시장의 선순환을 뒷받침하고 있습니다.
심화되는 전력망 제약
데이터센터는 2023년 기준으로 이미 미국 전력 소비량의 4.4%를 차지하고 있으며, 이 비율은 2028년까지 12%에 달할 가능성이 있어 기존 전력망에 부담을 주고 있습니다. 한때 주요 허브였던 버지니아주 북부와 텍사스주에서는 현재 메가와트 단위의 할당이 제한되어 있어, 사업자들은 새로운 용량을 찾아 인디애나주나 미시시피주로 이전할 수밖에 없는 상황입니다. 아일랜드에서는 2030년까지 국내 전력의 최대 70%가 디지털 부하에 소비될 것으로 예측되어, 일부 카운티에서는 신규 건설을 동결하는 조치가 취해지고 있습니다. 이에 대해 사업자 측은 시설의 전력 소비를 95% 절감할 수 있는 침지 냉각 기술을 도입해 대응하고 있으나, 이러한 설비 갱신에는 새로운 자본과 건설 기간 연장이 필요합니다. 따라서 전력 공급 제약으로 인해 IaaS 시장의 단기적인 확대는 둔화되고 있습니다.
부문 분석
2025년에는 퍼블릭 클라우드가 매출의 70.34%를 차지하며, 이는 지난 10년 동안 On-Premise 환경에서 퍼블릭 클라우드로의 전환을 반영한 것입니다. 그러나 규제 산업이 On-Premise에서의 제어와 오프프레미스에서의 확장성을 융합함에 따라, 하이브리드 부문은 2031년까지 23.68%라는 가장 높은 연평균 성장률(CAGR)을 보일 것으로 예측됩니다. 주요 금융 서비스 기업들은 고객 경험 목표를 달성하면서 규제 감사를 통과할 수 있었던 요인으로 하이브리드 환경을 꼽고 있습니다. 하이브리드 배포에서 IaaS 시장 규모는 2031년까지 1,634억 달러에 달할 것으로 예측되며, 이는 지연 시간에 민감한 워크로드와 규정 준수가 극히 중요한 워크로드 간의 균형을 맞추는 데 있어 하이브리드 환경이 수행하는 역할을 여실히 보여줍니다.
AWS Outposts나 Azure Stack과 같은 프라이빗 연결 옵션의 급증은 이러한 하이브리드화 추세를 뒷받침하고 있습니다. CME Group이 오로라에 구축한 Google Cloud의 프라이빗 리전은 미션 크리티컬한 거래를 로컬에 유지하면서 퍼블릭 클라우드 도구를 활용하는 좋은 사례입니다. IBM의 HashiCorp 인수를 통해 강화된 다각적인 오케스트레이션 소프트웨어는 복잡성으로 인한 장벽을 낮춥니다. 성숙도가 높아짐에 따라 클라우드 인프라 업계에서는 도입 결정을 이분법적인 선택이 아닌 포트폴리오 관리의 일환으로 바라보는 경향이 강해지고 있습니다.
지역별 분석
2025년에는 아시아태평양이 전 세계 매출의 42.86%를 차지하며, 중국, 일본, 인도의 국가 주도 AI 프로그램이 국내 클라우드에 보조금을 투입함으로써 21.02%라는 가장 높은 연평균 성장률(CAGR)을 유지할 전망입니다. 중국의 ‘동부 데이터, 서부’ 이니셔티브만 해도 연간 4,000억 위안(약 4,000억 엔)이 8개의 메가 클러스터에 투입되어, 컴퓨팅 자원을 내륙 지역으로 재분배함으로써 연안 지역의 혼잡을 완화하고 있습니다. 일본에서는 AWS의 150억 달러 및 Oracle의 80억 달러 투자 약속에 힘입어, 2030년까지 데이터센터 시장 규모가 2조 엔(134억 달러)에 육박할 전망입니다. 인도는 NTT의 15억 달러 규모의 확장 투자와 디지털 인프라를 우대하는 현지 세제 혜택의 수혜를 받고 있습니다.
북미는 여전히 2위 거점이지만, 기존 허브가 포화 상태에 이르러 상대적인 성장세는 둔화되고 있습니다. 에너지 제약으로 인해 프로젝트는 그동안 간과되었던 주로 방향을 전환하고 있습니다. AWS는 인디애나주에 110억 달러를 배정했고, 컴패스는 미시시피주에서 100억 달러 규모의 캠퍼스 착공을 시작했으며, STACK은 버지니아주 북부에 1GW 이상의 설비를 도입하겠다고 약속했습니다. 캐나다의 ‘디지털 앰비션(Digital Ambition)’ 프로그램은 Shared Services Canada의 중재 역할을 원동력으로 삼아 연방 정부의 클라우드 도입을 가속화하고 있습니다.
유럽에서는 수요와 탄소 중립 목표 간의 균형이 잡혀 있습니다. DORA(데이터센터 규제)와 같은 규제로 인해 금융 기업들은 공급업체 다각화를 강요받고 있는 반면, 각국의 에너지 상한선으로 인해 더블린이나 암스테르담과 같은 기존 입지에서의 용량은 제한되고 있습니다. 재생에너지 기반 전력망과 허가 취득을 지원하는 제도 덕분에 베를린, 바르샤바, 오슬로, 취리히, 밀라노, 비엔나, 마르세유와 같은 대체 도시들이 부상하고 있습니다. 2030년까지 데이터센터의 탄소 중립을 목표로 하는 EU의 목표는 열 재이용 방안 및 해상 풍력 발전과의 연계에 대한 투자를 촉진하며, IaaS 시장의 다음 단계를 형성하고 있습니다.
기타 혜택:
- 엑셀 형식 시장 예측(ME) 시트
- 3개월간의 애널리스트 지원
자주 묻는 질문
목차
제1장 서론
제2장 조사 방법
제3장 주요 요약
제4장 시장 구도
제5장 시장 규모와 성장 예측
제6장 경쟁 구도
제7장 시장 기회와 향후 전망
JHS 26.09.09According to Mordor Intelligence, the infrastructure as a service market size is expected to grow from USD 188.56 billion in 2025 to USD 225.47 billion in 2026 and is forecast to reach USD 551.08 billion by 2031 at 19.58% CAGR over 2026-2031.
This report is Segmented by Deployment Mode (Public Cloud, Private Cloud and Hybrid Cloud), Service Type(Compute As A Service (CaaS), Storage As A Service (STaaS), Database / Analytics As A Service (DBaaS) and More), End-User Industry(BFSI, IT and Telecom, Healthcare and Life Sciences) and Geography.
Global Infrastructure As A Service Market Trends and Insights
Accelerating Gen-AI Infrastructure Demand
Generative-AI training clusters require GPU racks drawing 700 W per chip, pushing liquid cooling adoption from 10% of data halls in 2024 to an estimated 20% in 2025. Hyperscalers now redesign campuses around 1 MW liquid-cooled racks, standardizing 400 V DC power distribution to curtail conversion losses, DataCenterFrontier. Enterprises echo the trend: nearly 40% of data-center operators plan to use liquid cooling by 2026 to host AI workloads. These technical shifts reshape facility blueprints, making AI-ready designs a default requirement across the cloud infrastructure market.
Enterprise Hybrid and Multi-Cloud Migration Spike
Organizations now spread workloads across multiple clouds to balance cost and compliance. IBM's USD 6.4 billion HashiCorp acquisition in 2024 deepens automation for multi-cloud orchestration. Oracle's and Google's multicloud tie-up eliminates egress fees for Oracle Database inside Google regions, removing a long-standing barrier to workload portability. Banking adoption is especially strong: 70% of institutions have moved beyond pilots, spurred by data-residency rules and operational-resilience tests. As hybrid patterns scale, specialized service providers find new revenue in governance and security advisory, reinforcing a virtuous cycle for the cloud infrastructure market.
Escalating Energy-Grid Constraints
Data centers already drew 4.4% of US electricity in 2023; the share may hit 12% by 2028, stressing legacy grids. Northern Virginia and Texas, once prime hubs, now ration megawatt allocations, sending operators to Indiana or Mississippi for fresh capacity. Ireland anticipates up to 70% of national power heading to digital loads by 2030, prompting moratoriums in some counties. Operators respond with immersion cooling that cuts facility power use by 95%, yet those retrofits demand fresh capital and extended build timelines. Limited electricity, therefore, slows the near-term expansion of the cloud infrastructure market.
Other drivers and restraints analyzed in the detailed report include:
- Hyperscaler CAPEX Race Exceeding USD 250 Billion
- Edge-to-Core Latency Requirements in the 5G Era
- Data-Sovereignty and Extraterritoriality Conflicts
For complete list of drivers and restraints, kindly check the Table Of Contents.
Segment Analysis
Public cloud held 70.34% of revenue in 2025, a reflection of a decade-long migration away from on-premises stacks. The hybrid tier, however, records the fastest 23.68% CAGR through 2031 as regulated industries mesh on-prem control with off-prem scale. Financial-services leaders credit hybrid setups for meeting customer-experience targets while passing regulatory audits. The cloud infrastructure market size for hybrid deployments is projected to reach USD 163.4 billion by 2031, underscoring its role in balancing latency-sensitive and compliance-critical workloads.
A sharp increase in private connectivity options such as AWS Outposts and Azure Stack supports this hybrid wave. CME Group's private Google Cloud region in Aurora illustrates how mission-critical trading stays local yet leverages public-cloud tooling. Multifaceted orchestration software-boosted by IBM's HashiCorp deal-lowers complexity barriers. As maturity rises, the cloud infrastructure industry increasingly views deployment decisions as a portfolio exercise rather than a binary choice.
Complete Report Scope:
- By Deployment Mode
- Public Cloud
- Private Cloud
- Hybrid Cloud
- By Service Type
- Compute as a Service (CaaS)
- Storage as a Service (STaaS)
- Networking & CDN
- Database / Analytics as a Service (DBaaS)
- Disaster-Recovery as a Service (DRaaS)
- Managed Hosting / Dedicated Cloud
- By End-user Industry
- BFSI
- IT & Telecom
- Healthcare & Life Sciences
- Media & Entertainment
- Retail & e-Commerce
- Government & Public Sector
- Manufacturing & Automotive
- By Geography
- North America
- United States
- Canada
- Mexico
- South America
- Brazil
- Argentina
- Rest of South America
- Europe
- United Kingdom
- Germany
- France
- Russia
- Rest of Europe
- Asia-Pacific
- China
- Japan
- India
- South Korea
- Australia
- Rest of Asia-Pacific
- Middle East and Africa
- Middle East
- UAE
- Saudi Arabia
- Turkey
- Rest of the Middle East
- Africa
- South Africa
- Nigeria
- Rest of Africa
- Middle East
- North America
Geography Analysis
Asia Pacific owns 42.86% of global revenue in 2025 and sustains the fastest 21.02% CAGR as sovereign AI programs in China, Japan, and India funnel subsidies into domestic clouds. China's East Data-West initiative alone channels CNY 400 billion annually toward eight megaclusters, redistributing computing inland and lowering coastal congestion. Japan approaches JPY 2 trillion (USD 13.4 billion) in data-center value by 2030, buoyed by AWS's USD 15 billion and Oracle's USD 8 billion pledges. India gains from NTT's USD 1.5 billion expansion and local tax incentives favoring digital infrastructure.
North America remains the second-largest base but sees relative growth slow as legacy hubs saturate. Energy limitations redirect projects to overlooked states: AWS earmarks USD 11 billion for Indiana, Compass breaks ground on a USD 10 billion Mississippi campus, and STACK commits over 1 GW in Northern Virginia. Canada's Digital Ambition program accelerates federal cloud adoption, propelled by Shared Services Canada's brokerage role.
Europe balances demand with carbon-neutral targets. Regulations such as DORA compel financial firms to diversify providers while national energy caps limit capacity in traditional locations like Dublin and Amsterdam. Alternative metros-Berlin, Warsaw, Oslo, Zurich, Milan, Vienna, and Marseille-rise thanks to renewable grids and supportive permitting regimes. The EU's aim for zero-carbon data centers by 2030 spurs investment in heat-reuse schemes and offshore wind tie-ins, shaping the next phase of the cloud infrastructure market.
- Amazon Web Services (AWS)
- Microsoft Azure
- Google Cloud Platform (GCP)
- Alibaba Cloud
- IBM Cloud
- Oracle Cloud Infrastructure (OCI)
- Tencent Cloud
- Huawei Cloud
- OVHcloud
- DigitalOcean
- Rackspace Technology
- Hetzner
- Equinix Metal
- Cloudflare Workers / R2
- Linode / Akamai
- Oracle Cloud (Japan)
- Liquid Sky (Africa)
- Wasabi Technologies
- Scaleway
- SAP Business Technology Platform (BTP-IaaS portion)
Additional Benefits:
- The market estimate (ME) sheet in Excel format
- 3 months of analyst support
TABLE OF CONTENTS
1 INTRODUCTION
- 1.1 Study Assumptions & Market Definition
- 1.2 Scope of the Study
2 RESEARCH METHODOLOGY
3 EXECUTIVE SUMMARY
4 MARKET LANDSCAPE
- 4.1 Market Overview
- 4.2 Market Drivers
- 4.2.1 Accelerating Gen-AI infrastructure demand
- 4.2.2 Enterprise hybrid & multi-cloud migration spike
- 4.2.3 Hyperscaler CAPEX race (more than USD 250 billion in 2025)
- 4.2.4 Edge-to-core latency requirements in 5G era
- 4.2.5 Long-duration green-energy PPAs unlocking new DC sites
- 4.2.6 Government sovereign-AI sandboxes mandating local IaaS nodes
- 4.3 Market Restraints
- 4.3.1 Escalating energy-grid constraints
- 4.3.2 Data-sovereignty & extraterritoriality conflicts
- 4.3.3 Liquid-cooling supply-chain bottlenecks
- 4.3.4 Surging insurance premiums for more than 100 MW hyperscale campuses
- 4.4 Value/Supply-Chain Analysis
- 4.5 Regulatory Landscape
- 4.6 Technological Outlook (AI accelerators, liquid cooling, Zero-Trust fabrics)
- 4.7 Porter's Five Forces
- 4.7.1 Bargaining Power of Suppliers
- 4.7.2 Bargaining Power of Buyers
- 4.7.3 Threat of New Entrants
- 4.7.4 Threat of Substitutes
- 4.7.5 Intensity of Competitive Rivalry
5 MARKET SIZE AND GROWTH FORECASTS (VALUE)
- 5.1 By Deployment Mode
- 5.1.1 Public Cloud
- 5.1.2 Private Cloud
- 5.1.3 Hybrid Cloud
- 5.2 By Service Type
- 5.2.1 Compute as a Service (CaaS)
- 5.2.2 Storage as a Service (STaaS)
- 5.2.3 Networking & CDN
- 5.2.4 Database / Analytics as a Service (DBaaS)
- 5.2.5 Disaster-Recovery as a Service (DRaaS)
- 5.2.6 Managed Hosting / Dedicated Cloud
- 5.3 By End-user Industry
- 5.3.1 BFSI
- 5.3.2 IT & Telecom
- 5.3.3 Healthcare & Life Sciences
- 5.3.4 Media & Entertainment
- 5.3.5 Retail & e-Commerce
- 5.3.6 Government & Public Sector
- 5.3.7 Manufacturing & Automotive
- 5.4 By Geography
- 5.4.1 North America
- 5.4.1.1 United States
- 5.4.1.2 Canada
- 5.4.1.3 Mexico
- 5.4.2 South America
- 5.4.2.1 Brazil
- 5.4.2.2 Argentina
- 5.4.2.3 Rest of South America
- 5.4.3 Europe
- 5.4.3.1 United Kingdom
- 5.4.3.2 Germany
- 5.4.3.3 France
- 5.4.3.4 Russia
- 5.4.3.5 Rest of Europe
- 5.4.4 Asia-Pacific
- 5.4.4.1 China
- 5.4.4.2 Japan
- 5.4.4.3 India
- 5.4.4.4 South Korea
- 5.4.4.5 Australia
- 5.4.4.6 Rest of Asia-Pacific
- 5.4.5 Middle East and Africa
- 5.4.5.1 Middle East
- 5.4.5.1.1 UAE
- 5.4.5.1.2 Saudi Arabia
- 5.4.5.1.3 Turkey
- 5.4.5.1.4 Rest of the Middle East
- 5.4.5.2 Africa
- 5.4.5.2.1 South Africa
- 5.4.5.2.2 Nigeria
- 5.4.5.2.3 Rest of Africa
- 5.4.5.1 Middle East
- 5.4.1 North America
6 COMPETITIVE LANDSCAPE
- 6.1 Market Concentration
- 6.2 Strategic Moves
- 6.3 Market Share Analysis
- 6.4 Company Profiles (includes Global level Overview, Market level overview, Core Segments, Financials as available, Strategic Information, Market Rank/Share, Products & Services, Recent Developments)
- 6.4.1 Amazon Web Services (AWS)
- 6.4.2 Microsoft Azure
- 6.4.3 Google Cloud Platform (GCP)
- 6.4.4 Alibaba Cloud
- 6.4.5 IBM Cloud
- 6.4.6 Oracle Cloud Infrastructure (OCI)
- 6.4.7 Tencent Cloud
- 6.4.8 Huawei Cloud
- 6.4.9 OVHcloud
- 6.4.10 DigitalOcean
- 6.4.11 Rackspace Technology
- 6.4.12 Hetzner
- 6.4.13 Equinix Metal
- 6.4.14 Cloudflare Workers / R2
- 6.4.15 Linode / Akamai
- 6.4.16 Oracle Cloud (Japan)
- 6.4.17 Liquid Sky (Africa)
- 6.4.18 Wasabi Technologies
- 6.4.19 Scaleway
- 6.4.20 SAP Business Technology Platform (BTP-IaaS portion)
7 MARKET OPPORTUNITIES AND FUTURE OUTLOOK
- 7.1 White-space & Unmet-Need Assessment