

|
시장보고서
상품코드
2123095
패널 레벨 패키징 시장 : 점유율 분석, 업계 동향과 통계, 성장 예측(2026-2031년)Panel Level Packaging - Market Share Analysis, Industry Trends & Statistics, Growth Forecasts (2026 - 2031) |
||||||
 Mordor Intelligence
에 의하면, 패널 레벨 패키징 시장 규모는 2025년 3억 5,000만 달러에서 2026년에는 4억 4,000만 달러로 확대되어 2026년부터 2031년까지 CAGR 25.58%로 성장을 지속하여, 2031년까지 13억 7,000만 달러에 이를 것으로 예측됩니다.
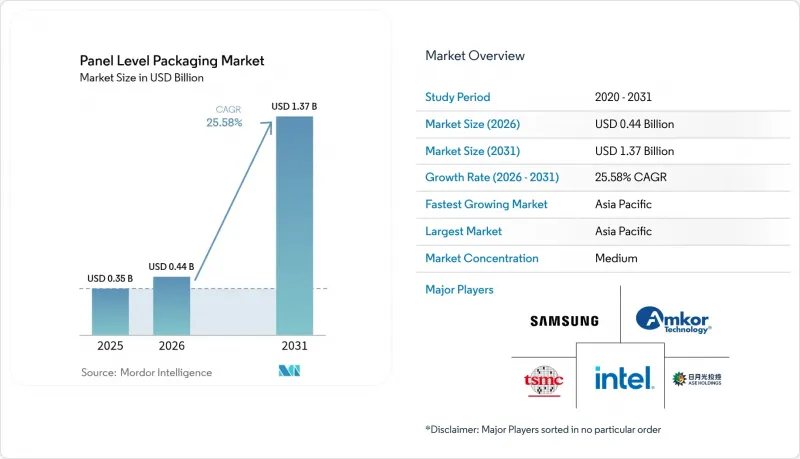
본 보고서는 패키징 기술(팬아웃·패널 레벨 패키징, 임베디드 브리지 등),기판 소재(유기 라미네이트, 유리 코어 등), 패널 크기(300mm×300mm 이하, 301-510mm×510mm, 511mm×600mm 이상),산업용도(소비자 가전, 자동차 등), 지역(북미, 유럽 등)별로 분류되어 있습니다. 시장 예측은 금액(달러) 기준으로 제시되어 있습니다.
세계 패널 레벨 패키징 시장 동향 및 인사이트
비용 절감과 웨이퍼 레벨 패키징의 비교
패널 형식으로의 전환을 통해 멀티 다이 설계에서 기판 활용률이 최대 40% 향상되어, 고가의 금형 비용을 고려한 후에도 칩당 비용을 절감할 수 있습니다. ASE가 310mm×310mm 생산 라인에 2억 달러를 투자한 것은 양산 확대에 대한 의지를 보여주는 것이며, 대량 생산되는 소비자용 디바이스가 짧은 수명 주기 동안 금형 상각에 필요한 웨이퍼 시작 수를 공급하고 있습니다. 아시아의 수탁 제조업체들은 기판 제조, 재배선층 처리, 최종 테스트를 단일 캠퍼스 내에 집약함으로써 추가적인 우위를 확보하고 물류 비용을 절감하고 있습니다. 생산량이 적은 유럽 및 미국 제조업체들은 비용 곡선이 가파르게 상승함에 따라 경쟁사와의 격차가 확대되고 있습니다. 그 결과, 턴키 패키지 입찰에서 ‘패널 퍼스트(Panel First)’ 전략이 수주율을 좌우하는 사례가 늘고 있습니다.
AI/HPC 칩 수요의 급증
대규모 언어 모델의 추론 및 훈련 환경에는 그 어느 때보다 고밀도 GPU 클러스터가 필요하며, 이에 따라 대역폭을 유지할 수 있는 인터포저가 없고 더 큰 실적를 가진 패키징이 요구되고 있습니다. TSMC의 ‘Chip-on-Panel-on-Substrate(CoPoS)’ 로드맵에서는 2027년 리스크 생산 개시를 예정하고 있으며, 열 저항을 일정하게 유지하면서 CoWoS의 레티클 제한으로 인한 치수를 2배로 확대합니다. 이 파운드리 업체는 2026년까지 매년 60% 이상 CoWoS 생산 능력을 확대하고 있지만, 그럼에도 불구하고 고대역폭 메모리(HBM) 라인에서는 수주 잔고가 예상되고 있어, Tier 1 고객들은 차세대 가속기 카드를 위해 패널 레벨 패키징 시장의 대안을 검토할 수밖에 없는 상황입니다. 패널 패키징 분야에서 20kW를 초과하는 셸프 레벨 냉각을 입증할 수 있는 선구적인 기업은 수년에 걸친 공급 계약을 확보하는 데 있어 가장 유리한 입장에 있습니다.
높은 자본 집약도와 뒤틀림 문제
600mm 라인을 풀가동하려면 증착, 패터닝, 계측 장비에 5억 달러 이상이 필요합니다. 패널 기판은 열 부하 하에서 팽창하며, 보정을 하지 않으면 2mm를 초과하는 처짐이 발생할 수 있습니다. SK Key Foundry와 LB Semicon의 Direct-RDL 공정에서는 경화 중에 패널의 끝부분을 고정하여 처짐을 억제하고 있지만, 장비 개조로 인해 툴 비용이 15% 증가합니다. 소규모 OSAT(수탁 조립 서비스 사업자)는 이러한 업그레이드에 필요한 자금 조달에 어려움을 겪고 있으며, 이는 전 세계 공급 확대의 걸림돌이 되고 있습니다. 저탄성률 유전체나 능동형 뒤틀림 보정 척이 실용화되기 전까지는 수율 저하가 패널 레벨 패키징 시장으로의 단기적인 확산을 저해하는 요인으로 남아 있을 것입니다.
부문 분석
팬아웃 패널 레벨 패키징은 2025년 매출의 44.60%를 차지하며, 적당한 I/O 밀도로 충분한 소비자용 및 모바일 기기의 주력 제품이 되고 있습니다. 이 부문의 패널 레벨 패키징 시장 규모는 1억 6,000만 달러에 달하며, 2031년까지 연평균 19.80%의 성장률을 보일 것으로 예측됩니다. 주요 OSAT(수탁 반도체 제조업체)는 성숙한 다이 페이스 다운(die-face-down) 공정을 활용하여 수율을 97% 이상으로 끌어올렸으며,월2만 장 이상의 생산량에서는 웨이퍼 팬아웃 방식의 비용을 두 자릿수 차이로 밑돌고 있습니다. 그러나 대역폭을 대량으로 소비하는 가속기는 이 기법의 패드 피치 한계에 다다르고 있어, 혁신가들은 2.5D/3D 패널 솔루션으로의 전환을 서둘러야 하는 상황입니다.
2.5D/3D 패널 통합은 2025년 매출에서 차지하는 비중이 19.10%에 불과하지만, 연평균 성장률(CAGR) 29.20%로 가장 빠르게 성장하고 있습니다. 이종 스택 기술을 통해 연산, 메모리, 아날로그 각 타일을 패시브 유리 캐리어 위에 배치함으로써 상호 연결 길이를 최대 70%까지 줄이고 있습니다. 초기 상용화 사례는 단일 패키지에 16개 이상의 치플릿을 탑재한 AI 추론 카드가 주를 이루고 있습니다. 2.5D/3D 기법을 활용한 패널 레벨 패키징 시장 점유율은 이 기술이 데이터센터의 틈새 시장을 벗어나 자동차용 도메인 컨트롤러로도 확산됨에 따라 2031년까지 31.80%를 나타낼 것으로 예측됩니다.
유기 라미네이트는 저비용 수지 시스템과 확립된 공급망의 혜택을 받아 2025년에는 56.10%의 점유율을 유지하며 시장 규모는 2억 달러에 달했습니다. 그러나 이 부문의 연평균 성장률(CAGR)은 20.40%에 그쳐, 층 수의 물리적 한계와 열팽창 계수(CTE)의 불일치를 반영하여 패널 레벨 패키징 시장 전체보다 낮은 수치를 기록하고 있습니다. 대조적으로, 유리 코어는 작년에 시장 점유율이 12.30%에 그쳤으나, 2031년까지 연평균 성장률(CAGR) 28.90%로 성장할 전망입니다. 삼성의 H-글라스 로드맵은 2026년 양산을 목표로 하고 있으며, 0.3 ppm/°C라는 치수 드리프트(유기 소재의 10분의 1)를 실현함으로써 5µm 미만의 선폭을 가진 재배선 층의 가능성을 열어줍니다. 실리콘 및 성형 재구성 패널은 여전히 틈새 시장에 머물러 있으며, 고출력 또는 초저비용 분야를 대상으로 제공되고 있습니다.
지역별 분석
아시아태평양은 2025년 매출의 69.20%를 차지하며, 2031년까지 연평균 성장률(CAGR) 27.60%로 패널 레벨 패키징 시장을 계속 주도하고 있습니다. 중국은 국가 주도의 AI 칩 프로그램에 부합하는 패널 패키징 라인에 국가 차원의 인센티브를 집중적으로 투입하고 있으며, 일본에서는 2024년 설비 투자액이 82% 증가한 70억 달러에 달하고, 국내 공정 역량을 뒷받침하고 있습니다. 한국은 유리 코어 기판 개발을 추진하고 있는 반면, 대만의 TSMC는 CoWoS, CoPoS 및 테스트를 단일 팹 클러스터에 통합한 파운드리·패키징 통합 공정을 추진하고 있습니다.
북미도 이에 발맞추어, 첨단 패키징에 할당된 ‘CHIPS 법’에 따른 16억 달러의 자금이 핵심이 되고 있습니다. Amkor가 4억 달러를 투자한 애리조나 공장은 2026년에 가동을 시작하며, TSMC의 새로운 Fab 21과 동일한 부지 내에 위치함으로써 미국 고객을 위한 사이클 타임을 단축할 것입니다. SK 하이닉스도 마찬가지로 인디애나주에서 HBM 패키징에 4억 5,000만 달러를 배정하고 있어, 각 주가 고부가가치 백엔드 사업을 적극적으로 유치하고 있음을 알 수 있습니다.
유럽 시장 점유율은 여전히 한 자릿수에 머물러 있지만, 자국 내 생산에 대한 우려가 커지는 가운데 현지 OSAT(반도체 수탁 제조) 기업의 설립이 진행되고 있어 점유율은 상승 추세를 보이고 있습니다. 폭스콘(Foxconn)과 탈레스(Thales)는 항공우주 및 방위 분야를 위한 새로운 팬아웃(fan-out) 시설에 2억 5,000만 유로를 투자하기로 결정했습니다. 한편, 인피니언(Infineon)은 암코(Amkor)와 제휴하여 2025년 중반 가동 예정인 포르투갈의 패널 생산 능력 확충을 추진하고 있습니다. 중동 및 아프리카 및 남미는 여전히 소비 주도형 시장이며, 현재로서는 조립 거점이 제한적이지만, 사우디아라비아와 브라질의 우대 조치로 인해 향후 10년 후반에는 그 균형이 바뀔 가능성이 있습니다.
기타 혜택:
- 엑셀 형식 시장 예측(ME) 시트
- 3개월간의 애널리스트 지원
자주 묻는 질문
목차
제1장 서론
제2장 조사 방법
제3장 주요 요약
제4장 시장 구도
제5장 시장 규모와 성장 예측
제6장 경쟁 구도
제7장 시장 기회와 향후 전망
JHS 26.09.09According to Mordor Intelligence, the panel-level packaging market size is expected to grow from USD 0.35 billion in 2025 to USD 0.44 billion in 2026 and is forecast to reach USD 1.37 billion by 2031 at 25.58% CAGR over 2026-2031.
This report is Segmented by Packaging Technology (Fan-Out Panel Level Packaging, Embedded Bridge, and More), Substrate Material (Organic Laminate, Glass Core, and More), Panel Size (<=300mmX300mm, 301-510mmX510mm, >=511mmX600mm), Industry Application (Consumer Electronics, Automotive, and More), and Geography (North America, Europe, and More). The Market Forecasts are Provided in Terms of Value (USD).
Global Panel Level Packaging Market Trends and Insights
Cost Reduction Versus Wafer-Level Packaging
Moving to panel formats yields up to 40% better substrate utilization for multi-die designs, cutting cost per placement even after accounting for expensive tooling. ASE's USD 200 million investment in 310 mm X 310 mm lines signals a commitment to volume scaling, and high-volume consumer devices supply the wafer starts needed to amortize tools across short life cycles. Asian contract manufacturers gain further leverage by clustering substrate fabrication, redistribution-layer processing, and final test inside single campuses, reducing logistics overhead. Western houses with lower volumes face a steeper cost curve, widening the competitiveness gap. As a result, panel-first strategies increasingly determine win rates in turnkey package bids.
Surge of AI/HPC Chip Demand
Large language-model inference and training floors require ever-denser GPU clusters, driving packaging toward larger interposer-free footprints that sustain bandwidth. TSMC's Chip-on-Panel-on-Substrate (CoPoS) roadmap, slated for 2027 risk production, doubles reticle-limited dimensions of CoWoS while holding thermal resistance steady. The foundry is expanding CoWoS capacity more than 60% annually through 2026, yet still projects backlog in high-bandwidth memory (HBM) lines, pushing Tier-1 customers to evaluate panel-level packaging market alternatives for next-generation accelerator cards. Early movers able to demonstrate >20 kW shelf-level cooling in panel packages are best positioned to secure multi-year supply agreements.
High Capital Intensity and Warpage Issues
A full 600 mm line demands more than USD 500 million in deposition, patterning, and metrology gear. Panel substrates expand under thermal load, generating a bow that can exceed 2 mm if not compensated. SK Key Foundry and LB Semicon's Direct-RDL flow clamps panel edges during cure to limit deflection, but equipment retrofits add 15% to tool cost. Smaller OSATs struggle to finance those upgrades, constraining global supply expansion. Until low-modulus dielectrics or active warp-compensation chucks mature, yield drag remains a check on near-term penetration of the panel-level packaging market.
Other drivers and restraints analyzed in the detailed report include:
- Proliferation of 5G/6G and Edge Devices
- Nikon 600 X 600 mm digital lithography adoption
- Process-Integration Complexity Beyond 300 mm
For complete list of drivers and restraints, kindly check the Table Of Contents.
Segment Analysis
Fan-Out Panel Level Packaging commanded 44.60% of 2025 revenue, making it the workhorse for consumer and mobile devices where moderate I/O density is sufficient. The panel-level packaging market size for this segment reached USD 0.16 billion and is projected to grow at 19.80% through 2031. Large OSATs leverage mature die-face-down flows to drive yields above 97%, beating wafer fan-out costs by double-digit margins on runs above 20,000 panels per month. Nevertheless, bandwidth-hungry accelerators are stretching the approach's pad pitch limits, pressing innovators toward 2.5D/3D panel solutions.
2.5D/3D panel integration, while holding only 19.10% of 2025 sales, is the fastest mover at a 29.20% CAGR. Heterogeneous stacking places compute, memory, and analog tiles on passive glass carriers, cutting interconnect length by up to 70%. Early commercial wins center on AI inference cards where a single package hosts >16 chiplets. The panel-level packaging market share for 2.5D/3D approaches is expected to hit 31.80% by 2031 as the technique escapes datacenter niches and filters into automotive domain controllers.
Organic laminate retained a 56.10% share in 2025, valued at USD 0.20 billion, benefiting from low-cost resin systems and entrenched supply chains. However, the segment's 20.40% CAGR lags the overall panel-level packaging market, reflecting physical limits on layer count and CTE mismatch. Glass cores, in contrast, posted only an 12.30% share last year but will grow at a 28.90% CAGR to 2031. Samsung's H-glass roadmap targets volume ramp in 2026, offering 0.3 ppm/°C dimensional drift, one-tenth that of organics, unlocking sub-5 µm line-width redistribution layers. Silicon and molded reconstituted panels remain niche, serving high-power or ultra-low-cost corners.
Complete Report Scope:
- By Packaging Technology
- Fan-Out Panel Level Packaging (FOPLP)
- Embedded Bridge (eBridge)
- 2.5D/3D Panel Integration
- Fan-In Panel Level Packaging
- By Substrate Material
- Organic Laminate
- Glass Core
- Silicon
- Molded Reconstituted Panel
- By Panel Size
- <=300 mm X 300 mm
- 301 - 510 mm X 510 mm
- >=511 mm X 600 mm
- By Industry Application
- Consumer Electronics
- Automotive (ADAS, EV Power)
- Telecommunications (5G/6G Infrastructure)
- Aerospace and Defense
- Industrial and IoT
- By Geography
- North America
- United States
- Canada
- Mexico
- South America
- Brazil
- Argentina
- Rest of South America
- Europe
- Germany
- United Kingdom
- France
- Italy
- Rest of Europe
- Asia-Pacific
- China
- Japan
- South Korea
- India
- Rest of Asia-Pacific
- Middle East
- Saudi Arabia
- United Arab Emirates
- Rest of Middle East
- Africa
- South Africa
- Rest of Africa
- North America
Geography Analysis
Asia-Pacific captured 69.20% of 2025 revenue and continues to lead the panel-level packaging market at a 27.60% CAGR through 2031. China funnels state incentives toward panel packaging lines aligned with sovereign AI chip programs, and Japan's equipment outlays rose 82% in 2024 to USD 7 billion, underpinning domestic process capability. South Korea advances glass-core substrates, while Taiwan's TSMC pushes integrated foundry-packaging flows that bundle CoWoS, CoPoS, and testing in a single fab cluster.
North America follows, anchored by CHIPS-Act funding of USD 1.6 billion earmarked for advanced packaging. Amkor's USD 400 million Arizona plant comes online in 2026, co-located with TSMC's new Fab 21 to shorten cycle times for U.S. customers. SK Hynix likewise has earmarked USD 450 million for HBM packaging in Indiana, demonstrating that states are bidding aggressively for high-value backend operations.
Europe's share remains single-digit but is rising as sovereignty concerns spur local OSAT formation. Foxconn and Thales committed EUR 250 million to a new fan-out facility aimed at aerospace and defense, while Infineon partnered with Amkor to add panel capacity in Portugal that comes online mid-2025. Middle East and Africa and South America remain consumption-centric, with limited assembly footprints yet, though incentive schemes in Saudi Arabia and Brazil could shift that balance later in the decade.
- Samsung Electronics Co., Ltd.
- Taiwan Semiconductor Manufacturing Company Limited (TSMC)
- Intel Corporation
- ASE Technology Holding Co., Ltd.
- Amkor Technology, Inc.
- Powertech Technology Inc.
- Nepes Corporation
- Unimicron Technology Corp.
- DECA Technologies, Inc.
- JCET Group Co., Ltd.
- Fraunhofer Institute for Reliability and Microintegration IZM
- Nikon Corporation
- Ajinomoto Fine-Techno Co., Inc.
- Shinko Electric Industries Co., Ltd.
- LG Innotek Co., Ltd.
- K&S (Kulicke & Soffa Industries, Inc.)
- Veeco Instruments Inc.
- Applied Materials, Inc.
- Ultratech (Veeco)
- Tokyo Electron Limited
- Brewer Science, Inc.
Additional Benefits:
- The market estimate (ME) sheet in Excel format
- 3 months of analyst support
TABLE OF CONTENTS
1 Introduction
- 1.1 Study Assumptions and Market Definition
- 1.2 Scope of the Study
2 Research Methodology
3 Executive Summary
4 Market Landscape
- 4.1 Market Overview
- 4.2 Market Drivers
- 4.2.1 Cost reduction versus wafer-level packaging
- 4.2.2 Surge of AI/HPC chip demand
- 4.2.3 Proliferation of 5G/6G and edge devices
- 4.2.4 Nikon 600 x 600 mm digital lithography adoption
- 4.2.5 Shift to glass-core substrates >=2026
- 4.2.6 EU/US reshoring subsidies tied to advanced packaging
- 4.3 Market Restraints
- 4.3.1 High capital intensity and warpage issues
- 4.3.2 Process-integration complexity beyond 300 mm
- 4.3.3 Sub-1 µm lithography yield cliff on large panels
- 4.3.4 Supply bottleneck for ABF-GCP dielectric films
- 4.4 Industry Value Chain Analysis
- 4.5 Regulatory Landscape
- 4.6 Technological Outlook
- 4.7 Porter's Five Forces Analysis
- 4.7.1 Bargaining Power of Suppliers
- 4.7.2 Bargaining Power of Buyers
- 4.7.3 Threat of New Entrants
- 4.7.4 Threat of Substitutes
- 4.7.5 Intensity of Rivalry
5 Market Size and Growth Forecasts (Value)
- 5.1 By Packaging Technology
- 5.1.1 Fan-Out Panel Level Packaging (FOPLP)
- 5.1.2 Embedded Bridge (eBridge)
- 5.1.3 2.5D/3D Panel Integration
- 5.1.4 Fan-In Panel Level Packaging
- 5.2 By Substrate Material
- 5.2.1 Organic Laminate
- 5.2.2 Glass Core
- 5.2.3 Silicon
- 5.2.4 Molded Reconstituted Panel
- 5.3 By Panel Size
- 5.3.1 <=300 mm X 300 mm
- 5.3.2 301 - 510 mm X 510 mm
- 5.3.3 >=511 mm X 600 mm
- 5.4 By Industry Application
- 5.4.1 Consumer Electronics
- 5.4.2 Automotive (ADAS, EV Power)
- 5.4.3 Telecommunications (5G/6G Infrastructure)
- 5.4.4 Aerospace and Defense
- 5.4.5 Industrial and IoT
- 5.5 By Geography
- 5.5.1 North America
- 5.5.1.1 United States
- 5.5.1.2 Canada
- 5.5.1.3 Mexico
- 5.5.2 South America
- 5.5.2.1 Brazil
- 5.5.2.2 Argentina
- 5.5.2.3 Rest of South America
- 5.5.3 Europe
- 5.5.3.1 Germany
- 5.5.3.2 United Kingdom
- 5.5.3.3 France
- 5.5.3.4 Italy
- 5.5.3.5 Rest of Europe
- 5.5.4 Asia-Pacific
- 5.5.4.1 China
- 5.5.4.2 Japan
- 5.5.4.3 South Korea
- 5.5.4.4 India
- 5.5.4.5 Rest of Asia-Pacific
- 5.5.5 Middle East
- 5.5.5.1 Saudi Arabia
- 5.5.5.2 United Arab Emirates
- 5.5.5.3 Rest of Middle East
- 5.5.6 Africa
- 5.5.6.1 South Africa
- 5.5.6.2 Rest of Africa
- 5.5.1 North America
6 Competitive Landscape
- 6.1 Market Concentration
- 6.2 Strategic Moves
- 6.3 Market Share Analysis
- 6.4 Company Profiles (includes Global level Overview, Market level overview, Core Segments, Financials as available, Strategic Information, Market Rank/Share for key companies, Products and Services, and Recent Developments)
- 6.4.1 Samsung Electronics Co., Ltd.
- 6.4.2 Taiwan Semiconductor Manufacturing Company Limited (TSMC)
- 6.4.3 Intel Corporation
- 6.4.4 ASE Technology Holding Co., Ltd.
- 6.4.5 Amkor Technology, Inc.
- 6.4.6 Powertech Technology Inc.
- 6.4.7 Nepes Corporation
- 6.4.8 Unimicron Technology Corp.
- 6.4.9 DECA Technologies, Inc.
- 6.4.10 JCET Group Co., Ltd.
- 6.4.11 Fraunhofer Institute for Reliability and Microintegration IZM
- 6.4.12 Nikon Corporation
- 6.4.13 Ajinomoto Fine-Techno Co., Inc.
- 6.4.14 Shinko Electric Industries Co., Ltd.
- 6.4.15 LG Innotek Co., Ltd.
- 6.4.16 K&S (Kulicke & Soffa Industries, Inc.)
- 6.4.17 Veeco Instruments Inc.
- 6.4.18 Applied Materials, Inc.
- 6.4.19 Ultratech (Veeco)
- 6.4.20 Tokyo Electron Limited
- 6.4.21 Brewer Science, Inc.
7 Market Opportunities and Future Outlook
- 7.1 White-space and Unmet-need Assessment


