|
시장보고서
상품코드
2123128
FaaS(Firewall as a Service) 시장 : 시장 점유율 분석, 업계 동향 및 통계, 성장 예측(2026-2031년)Firewall-as-a-Service - Market Share Analysis, Industry Trends & Statistics, Growth Forecasts (2026 - 2031) |
||||||
 Mordor Intelligence
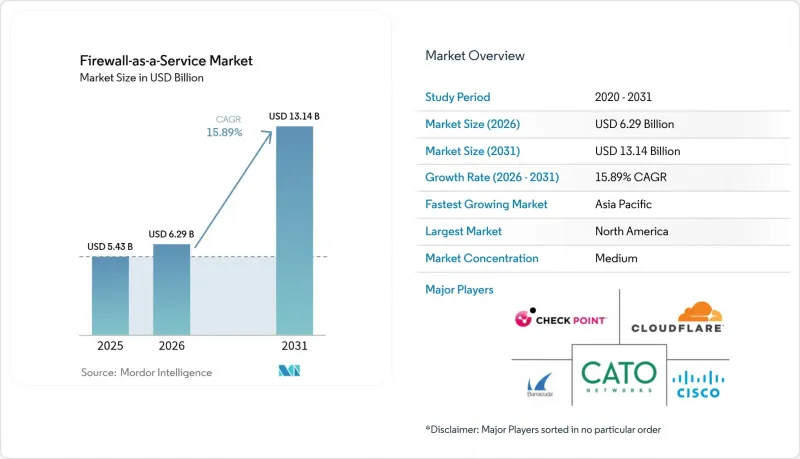
Mordor Intelligence에 의하면, FaaS(Firewall as a Service)(FWaaS) 시장 규모는 2025년에 54억 3,000만 달러로 평가되었고, 2026년 62억 9,000만 달러에서 2031년까지 131억 4,000만 달러에 이를 것으로 예측되며, 예측 기간(2026-2031년) CAGR은 15.89%를 나타낼 전망입니다.
본 보고서는 서비스 모델별(SaaS, IaaS, PaaS), 도입 모델별(퍼블릭 클라우드, 프라이빗 클라우드, 하이브리드 클라우드), 최종 사용자 기업 규모별(대기업, 중소기업), 업종별(은행, 금융서비스 및 보험(BFSI), IT 및 통신, 기타), 보안 유형별(차세대 방화벽, 가상 방화벽, 기타), 지역별로 분류되어 있습니다. 시장 예측은 금액(달러) 기준으로 제시되어 있습니다.
세계의 FaaS(Firewall as a Service) 시장 동향 및 인사이트
멀티클라우드 및 SaaS 도입에 따른 폭발적인 성장
현재 기업의 78%가 하이브리드 클라우드 또는 멀티 클라우드 환경을 운영하고 있으며, 이러한 복잡성으로 인해 AWS, Azure, Google Cloud의 각 워크로드 전반에 걸쳐 통일된 정책을 적용할 수 없는 하드웨어 방화벽에는 부담이 가중되고 있습니다. 클라우드에서 호스팅되는 용도는 기존의 경계를 우회하기 때문에 조직은 워크로드의 위치에 관계없이 추적할 수 있는 탄력적인 API 기반 제어 수단을 채택할 수밖에 없습니다. 따라서 FaaS(Firewall as a Service) 시장은 DevOps의 속도에 맞추어 단일 화면에서 정책을 오케스트레이션하기를 원하는 기업들로부터 혜택을 보고 있습니다. SaaS의 보급으로 인해 각각 일관된 거버넌스가 요구되는 수천 개의 개별 데이터 흐름이 도입되면서 요구 사항은 더욱 복잡해지고 있습니다. 2025년에 Microsoft Azure가 가장 널리 사용되는 하이퍼스케일 플랫폼이 될 것으로 예상되는 가운데, 벤더의 ID 및 텔레메트리 스택과 기본적으로 통합될 수 있는 능력은 경쟁 우위를 가져다줄 것입니다.
클라우드로 인한 데이터 침해 비용 및 발생 빈도 증가
Gigamon의 2024년 조사에 따르면, 전년도에 발생한 공격의 3분의 1이 감지되지 않은 것으로 나타났습니다. 이는 20% 증가한 수치로, 기존 감지 방식의 한계를 여실히 드러내고 있습니다. 클라우드 환경 내의 횡방향 이동이 복구 비용을 두 배로 늘리기 때문에 데이터 침해로 인한 비용은 온프레미스 사고를 상회하고 있습니다. 공격자들이 AI를 악용해 시그니처 기반 통제를 우회하고 있기 때문에 기업들은 클라우드 방화벽에 내장된 실시간 위협 인텔리전스 및 자동 대응 기능에 대한 투자를 확대되고 있습니다. 규제 위험이 높아짐에 따라 그 시급성은 더욱 커지고 있습니다. GDPR(EU 개인정보보호규정) 벌금 및 곧 시행될 NIS2 지침으로 인해, 불충분한 클라우드 제어는 재정적 및 평판상의 위험이 되며, FWaaS 도입은 단순한 선택적 기능 강화가 아닌 이사회 차원의 필수 사항이 되고 있습니다.
FWaaS와 레거시 어플라이언스 통합에 따른 복잡성
기업에서는 캠퍼스, 지사, 코로케이션 사이트 등에 걸쳐 다양한 방화벽 환경을 운영하는 경우가 많으며, 여기에 클라우드 방화벽을 추가로 도입할 때 정책 동기화에 문제가 발생합니다. 트래픽 유도, 고가용성 페일오버 및 통합 로그 관리를 위해서는 아키텍처 재설계가 필요하며, 이로 인해 프로젝트 기간이 연장될 가능성이 있습니다. 온프레미스 장비에 최적화된 VLAN 구성은 FWaaS 도입 모델과 빈번하게 충돌하기 때문에 네트워크 팀은 세분화을 재검토할 수밖에 없습니다. 이러한 장벽은 장기적인 이점이 여전히 매력적임에도 불구하고, FWaaS 시장의 전환 비용을 높이고 단기적인 성장 가능성을 저해하고 있습니다.
부문 분석
SaaS 형식으로 제공되는 방화벽은 2025년 매출의 46.75%를 차지했으며, 인프라 오버헤드 없이 턴키 도입을 원하는 기업들 사이에서 즉각적인 지지를 얻고 있습니다. 이 부문은 Firewall-as-a-Service 시장의 경제적 기반을 형성하고 있으며, 미리 조정된 정책, 유연한 확장성, 그리고 고객의 개입을 최소화하면서 자동으로 업데이트되는 통합 위협 인텔리전스 피드를 제공합니다. 이 모델은 특히 규제가 엄격한 산업 분야에서 감사 대응 체제를 유지하면서도 프로비저닝 주기를 단축해야 한다는 압박을 받고 있는 IT 팀들로부터 지지를 얻고 있습니다. 각 벤더들은 클라우드 액세스 보안 브로커(CASB) 및 보안 웹 게이트웨이(SWG)와 같은 부가가치 기능을 통합된 SaaS 구독에 묶어 제공함으로써 이러한 수요를 활용하고 있습니다.
Platform-as-a-Service(PaaS)는 규모는 작지만, DevOps 지향 조직이 코드 중심의 보안 워크플로우를 추구함에 따라 연평균 성장률(CAGR) 17.08%로 성장하고 있습니다. API 우선 PaaS 방화벽은 CI/CD 파이프라인과 통합되어 ‘보안-어-코드(Security-as-Code)’를 실현함과 동시에 배포 전 보안 상태 점검을 자동화합니다. Infrastructure-as-a-Service(IaaS)는 커널 모듈이나 사용자 지정 전송 경로에 대한 세밀한 제어가 필요한 고객을 위한 틈새 시장으로서의 입지를 유지하고 있습니다. 이러한 모델들은 Firewall-as-a-Service 시장에서 구매 결정을 좌우하는 ‘제어’와 ‘편의성’의 연속체를 보여줍니다.
2025년에도 퍼블릭 클라우드는 Firewall-as-a-Service 시장 규모의 57.95%를 차지하며 여전히 지배적인 위치를 유지했습니다. 하이퍼스케일 패브릭의 존재, 통합된 IAM, 그리고 사전 피어링된 연결성 덕분에 도입이 간소화되었습니다. 그러나 조직들이 온프레미스 환경과의 공존을 통해 밀리초 수준의 지연 시간과 규제 준수를 추구함에 따라, 하이브리드 배포는 연평균 성장률(CAGR) 16.84%로 확대되고 있습니다. 이러한 추세는 클라우드에 대한 이분법적인 결정에서 워크로드에 따른 배치로 전환되고 있음을 시사합니다.
성공을 거두고 있는 제공업체들은 현재 정책 오케스트레이션을 추상화하여, 트래픽이 클라우드, 엣지, 캠퍼스 사이트 중 어디를 경유하든 단일 규칙 세트가 적용되도록 하고 있습니다. 주권 데이터 저장소나 초저지연 산업용 제어 시스템의 경우, 프라이빗 클라우드가 계속해서 활용되고 있으며, 이식 가능한 라이선싱과 페더레이션 관리 콘솔에 대한 필요성이 더욱 높아지고 있습니다.
지역별 분석
북미는 2025년 전 세계 매출의 35.72%를 차지했습니다. 이는 클라우드 도입의 성숙도, 탄탄한 벤더 생태계, 그리고 지속적인 모니터링을 의무화하는 연방 정부의 사이버 보안 지침을 반영한 결과입니다. 기업들은 FWaaS의 PoP까지의 지연 시간을 줄여주는 풍부한 현지 하이퍼스케일 리전과, 제품 혁신을 촉진하는 견실한 벤처 투자의 혜택을 누리고 있습니다. 또한, 미국 및 EU 데이터 개인정보 보호 프레임워크에 기반한 국경을 넘는 데이터 흐름은 다국적 기업의 규정 준수 부담을 경감시키고 있습니다.
아시아태평양은 가장 빠르게 성장하는 지역으로, 2031년까지 연평균 성장률(CAGR)은 17.74%로 예측됩니다. 정부 주도의 디지털 이니셔티브, 5G 백본의 확대, 랜섬웨어 노출 위험 증가가 맞물려 인도, 호주, 일본 및 아세안(ASEAN) 국가들의 지출을 촉진하고 있습니다. AWS, Azure, Alibaba Cloud에 의한 지역별 하이퍼스케일 확장으로 PoP 밀도가 비약적으로 높아져, 공급업체는 인구 밀집 도시에서의 데이터 현지화 의무 및 지연 시간 요건을 충족할 수 있게 되었습니다. 또한, 지역 통신 사업자들이 관리형 SD-WAN에 FWaaS를 번들로 묶어 경쟁하고 있는 점도 도입 곡선을 더욱 끌어올리고 있습니다.
유럽에서는 GDPR(EU 개인정보보호규정) 및 향후 시행될 NIS2 지침에 따라 검증 가능한 사이버 보안 대책에 대한 관심이 높아지는 가운데, 꾸준한 진전이 나타나고 있습니다. Gaia-X 및 소버린 클라우드 존을 포함한 로컬 클라우드 전략이 공급업체의 거점 확장 계획에 영향을 미치면서, 각 벤더들은 프랑크푸르트, 파리, 마드리드에 새로운 데이터센터를 개설하고 있습니다. 브렉시트로 인해 일시적인 조달상의 불확실성이 발생했으나, 영국 기업들은 ‘국가 사이버 전략 2025’의 목표를 달성하기 위해 FWaaS에 대한 투자를 지속하고 있습니다.
남미, 중동 및 아프리카는 신흥 수요 클러스터로 부상하고 있습니다. 브라질, 멕시코, 남아프리카공화국 및 걸프협력회의(GCC) 국가들의 클라우드 도입 성장률은 급격하지만, 현지 접속 지점(PoP)이 제한적이고 가격에 대한 민감도가 높아 단기적인 성장세는 둔화되고 있습니다. 이에 따라 세계 벤더들은 지역 ISP와 제휴하여 막대한 설비 투자(CapEx) 없이도 주권 요건을 충족하는 엣지 호스팅형 검사 서비스를 제공합니다. 이러한 경제권들이 공급망의 디지털화를 추진해 나가는 가운데, 이러한 현지화 노력은 장기적인 수익을 확보하는 데 있어 매우 중요해질 것입니다.
기타 혜택 :
- 엑셀 형식 시장 예측(ME) 시트
- 3개월간의 애널리스트 지원
자주 묻는 질문
목차
제1장 서론
제2장 조사 방법
제3장 주요 요약
제4장 시장 구도
제5장 시장 규모 및 성장 예측
제6장 경쟁 구도
제7장 시장 기회 및 향후 전망
AJY 26.09.07According to Mordor Intelligence, the firewall-as-a-Service market size was valued at USD 5.43 billion in 2025 and estimated to grow from USD 6.29 billion in 2026 to reach USD 13.14 billion by 2031, at a CAGR of 15.89% during the forecast period (2026-2031).
This report is Segmented by Service Model (SaaS, Iaas, and PaaS), Deployment Model (Public Cloud, Private Cloud, and Hybrid Cloud), End-User Enterprise Size (Large Enterprises and Small and Medium-Sized Enterprises), Industry Vertical (BFSI, IT and Telecom, and More), Security Type (Next-Generation Firewall, Virtual Firewall, and More), and Geography. The Market Forecasts are Provided in Terms of Value (USD).
Global Firewall-as-a-Service Market Trends and Insights
Explosive Growth of Multi-Cloud and SaaS Adoption
Seventy-eight percent of enterprises now run hybrid or multi-cloud estates, a complexity that strains hardware firewalls, unable to enforce uniform policies across AWS, Azure, and Google Cloud workloads. Cloud-hosted applications bypass legacy perimeters, compelling organizations to adopt elastic, API-driven controls that follow workloads wherever they reside. The Firewall-as-a-Service market, therefore, benefits from enterprises seeking single-pane policy orchestration that aligns with DevOps velocity. SaaS proliferation compounds requirements by introducing thousands of discrete data flows, each demanding consistent governance. As Microsoft Azure becomes the most widely consumed hyperscale platform in 2025, the vendor's ability to integrate natively with its identity and telemetry stack confers a competitive advantage.
Escalating Cost and Frequency of Cloud-Borne Data Breaches
Gigamon's 2024 survey found one-third of attacks went undetected in the prior year, a 20% uptick that underscores gaps in legacy detection. Breach costs have overtaken on-prem incidents because lateral movement inside cloud fabrics multiplies remediation expense. Attackers are weaponizing AI to bypass signature-based controls, prompting enterprises to invest in real-time threat intelligence and automated response embedded in cloud firewalls. Regulatory exposure heightens urgency: GDPR fines and the incoming NIS2 directive make inadequate cloud controls a financial and reputational risk, turning FWaaS adoption into a board-level mandate rather than an optional enhancement.
Complexity Integrating FWaaS with Legacy Appliances
Enterprises often run heterogeneous firewall estates across campuses, branches, and co-location sites, creating policy-sync challenges when layering in cloud firewalls. Traffic steering, high-availability failover, and unified logging demand architectural redesign that can inflate project timelines. VLAN schemes optimized for on-prem equipment frequently conflict with FWaaS deployment models, obliging network teams to rethink segmentation. These hurdles raise switching costs and dampen short-term growth potential in the Firewall-as-a-Service market even as long-term benefits remain compelling.
Other drivers and restraints analyzed in the detailed report include:
- Hybrid/Remote Workforces Demanding Distributed Security
- AI-Driven Policy Automation Lowering SME TCO
- Latency and Data-Sovereignty Concerns in Regulated Sectors
For complete list of drivers and restraints, kindly check the Table Of Contents.
Segment Analysis
SaaS-delivered firewalls captured 46.75% of 2025 revenue, demonstrating immediate appeal among enterprises seeking turnkey deployment without infrastructure overhead. This segment forms the economic backbone of the Firewall-as-a-Service market, offering pre-tuned policies, elastic scaling, and integrated threat-intel feeds that auto-update with minimal customer intervention. The model resonates with IT teams under pressure to shorten provisioning cycles while maintaining audit readiness, especially in heavily regulated verticals. Vendors capitalize by bundling value-added features such as cloud access security broker (CASB) and secure web gateway (SWG) into a unified SaaS subscription.
Platform-as-a-Service, though smaller, is growing at a 17.08% CAGR as DevOps-oriented organizations demand code-centric security workflows. API-first PaaS firewalls integrate with CI/CD pipelines, enabling "security as code" and automating posture checks pre-deployment. Infrastructure-as-a-Service retains a niche for customers requiring granular control over kernel modules or custom forwarding paths. Together, these models illustrate a continuum of control versus convenience that shapes purchasing decisions across the Firewall-as-a-Service market.
Public cloud remained dominant in 2025 with a 57.95% share of the Firewall-as-a-Service market size; hyperscale fabric presence, integrated IAM, and pre-peered connectivity simplify onboarding. However, hybrid deployments are expanding at a 16.84% CAGR as organizations chase millisecond-level latency and regulatory compliance through on-prem coexistence. This trajectory signals a move away from binary cloud decisions toward workload-specific placement.
Successful providers now abstract policy orchestration so that a single ruleset follows traffic whether it traverses cloud, edge, or campus sites. Private cloud persists for sovereign data repositories and ultra-low-latency industrial controls, reinforcing the need for portable licensing and federated management consoles.
Complete Report Scope:
- By Service Model
- SaaS
- IaaS
- PaaS
- By Deployment Model
- Public Cloud
- Private Cloud
- Hybrid Cloud
- By End-user Enterprise Size
- Large Enterprises
- Small and Medium-sized Enterprises (SMEs)
- By Industry Vertical
- BFSI
- IT and Telecom
- Healthcare
- Retail and E-commerce
- Industrial and Defense
- Energy and Utilities
- Manufacturing
- Other Industry Verticals
- By Security Type
- Next-Generation Firewall (NGFW)
- Web Application Firewall (WAF)
- Distributed / Micro-segmentation Firewall
- Virtual Firewall (vFW)
- By Geography
- North America
- United States
- Canada
- Mexico
- South America
- Brazil
- Argentina
- Chile
- Rest of South America
- Europe
- Germany
- United Kingdom
- France
- Italy
- Spain
- Rest of Europe
- Asia-Pacific
- China
- India
- Japan
- South Korea
- Malaysia
- Singapore
- Australia
- Rest of Asia-Pacific
- Middle East and Africa
- Middle East
- United Arab Emirates
- Saudi Arabia
- Turkey
- Rest of Middle East
- Africa
- South Africa
- Nigeria
- Rest of Africa
- Middle East
- North America
Geography Analysis
North America generated 35.72% of global 2025 revenue, a reflection of mature cloud adoption, a dense vendor ecosystem, and federal cybersecurity directives that mandate continuous monitoring. Enterprises benefit from abundant local hyperscale regions that reduce latency to FWaaS PoPs and from robust venture investment fueling product innovation. Cross-border data flows under the U.S.-EU Data Privacy Framework also ease compliance for multinationals.
Asia-Pacific is the fastest-growing region with an 17.74% CAGR projected through 2031. Government-funded digital initiatives, expanding 5G backbones, and rising ransomware exposure are together catalyzing spend across India, Australia, Japan, and ASEAN economies. Local hyperscale expansions by AWS, Azure, and Alibaba Cloud multiply PoP density, allowing providers to meet data-localization mandates and latency requirements in heavily populated metros. Competitive entry by regional telcos bundling FWaaS inside managed SD-WAN further lifts adoption curves.
Europe advances steadily as GDPR and the forthcoming NIS2 directive intensify focus on verifiable cyber-controls. Local-cloud strategies, including Gaia-X and sovereign cloud zones, influence provider footprint planning, prompting vendors to open additional data centers in Frankfurt, Paris, and Madrid. While Brexit caused temporary procurement uncertainty, United Kingdom enterprises continue investing in FWaaS to comply with the National Cyber Strategy 2025 objectives.
South America and the Middle East, and Africa represent emerging demand clusters. Cloud adoption curves in Brazil, Mexico, South Africa, and the Gulf Cooperation Council are steep; however, limited local PoPs and price sensitivity slow near-term growth. Global vendors are therefore partnering with regional ISPs to offer edge-hosted inspection that satisfies sovereignty requirements without massive CapEx. This localization effort will be pivotal for capturing long-term revenue as these economies digitize supply chains.
- Barracuda Networks Inc.
- Cato Networks Ltd.
- Check Point Software Technologies Ltd.
- Cisco Systems Inc.
- Cloudflare Inc.
- Forcepoint LLC
- Fortinet Inc.
- Hillstone Networks Co. Ltd.
- IntraSystems Inc.
- Juniper Networks Inc.
- Microsoft Corporation
- Netskope Inc.
- Open Systems AG
- Palo Alto Networks Inc.
- Perimeter 81 Ltd.
- SonicWall Inc.
- Sophos Ltd.
- Sprout Technologies Ltd.
- Tufin Software Technologies Ltd.
- Versa Networks Inc.
- VMware Inc.
- Vocus Communications Ltd.
- WatchGuard Technologies Inc.
- Zscaler Inc.
Additional Benefits:
- The market estimate (ME) sheet in Excel format
- 3 months of analyst support
TABLE OF CONTENTS
1 INTRODUCTION
- 1.1 Study Assumptions and Market Definition
- 1.2 Scope of the Study
2 RESEARCH METHODOLOGY
3 EXECUTIVE SUMMARY
4 MARKET LANDSCAPE
- 4.1 Market Overview
- 4.2 Market Drivers
- 4.2.1 Explosive growth of multi-cloud and SaaS adoption
- 4.2.2 Escalating cost and frequency of cloud-borne data breaches
- 4.2.3 Hybrid/remote workforces demanding distributed security
- 4.2.4 Post-2025 hardware-firewall supply-chain constraints
- 4.2.5 AI-driven policy-automation lowering SME TCO
- 4.2.6 Cloud-marketplace-embedded procurement incentives
- 4.3 Market Restraints
- 4.3.1 Complexity integrating FWaaS with legacy appliances
- 4.3.2 Latency and data-sovereignty concerns in regulated sectors
- 4.3.3 Rising public-cloud egress fees eroding OPEX advantage
- 4.3.4 Vendor-platform consolidation fatigue among CISOs
- 4.4 Industry Value Chain Analysis
- 4.5 Regulatory Landscape
- 4.6 Technological Outlook
- 4.7 Porter's Five Forces Analysis
- 4.7.1 Threat of New Entrants
- 4.7.2 Bargaining Power of Buyers
- 4.7.3 Bargaining Power of Suppliers
- 4.7.4 Threat of Substitutes
- 4.7.5 Intensity of Competitive Rivalry
- 4.8 Impact of Macroeconomic Factors on the Market
5 MARKET SIZE AND GROWTH FORECASTS (VALUES)
- 5.1 By Service Model
- 5.1.1 SaaS
- 5.1.2 IaaS
- 5.1.3 PaaS
- 5.2 By Deployment Model
- 5.2.1 Public Cloud
- 5.2.2 Private Cloud
- 5.2.3 Hybrid Cloud
- 5.3 By End-user Enterprise Size
- 5.3.1 Large Enterprises
- 5.3.2 Small and Medium-sized Enterprises (SMEs)
- 5.4 By Industry Vertical
- 5.4.1 BFSI
- 5.4.2 IT and Telecom
- 5.4.3 Healthcare
- 5.4.4 Retail and E-commerce
- 5.4.5 Industrial and Defense
- 5.4.6 Energy and Utilities
- 5.4.7 Manufacturing
- 5.4.8 Other Industry Verticals
- 5.5 By Security Type
- 5.5.1 Next-Generation Firewall (NGFW)
- 5.5.2 Web Application Firewall (WAF)
- 5.5.3 Distributed / Micro-segmentation Firewall
- 5.5.4 Virtual Firewall (vFW)
- 5.6 By Geography
- 5.6.1 North America
- 5.6.1.1 United States
- 5.6.1.2 Canada
- 5.6.1.3 Mexico
- 5.6.2 South America
- 5.6.2.1 Brazil
- 5.6.2.2 Argentina
- 5.6.2.3 Chile
- 5.6.2.4 Rest of South America
- 5.6.3 Europe
- 5.6.3.1 Germany
- 5.6.3.2 United Kingdom
- 5.6.3.3 France
- 5.6.3.4 Italy
- 5.6.3.5 Spain
- 5.6.3.6 Rest of Europe
- 5.6.4 Asia-Pacific
- 5.6.4.1 China
- 5.6.4.2 India
- 5.6.4.3 Japan
- 5.6.4.4 South Korea
- 5.6.4.5 Malaysia
- 5.6.4.6 Singapore
- 5.6.4.7 Australia
- 5.6.4.8 Rest of Asia-Pacific
- 5.6.5 Middle East and Africa
- 5.6.5.1 Middle East
- 5.6.5.1.1 United Arab Emirates
- 5.6.5.1.2 Saudi Arabia
- 5.6.5.1.3 Turkey
- 5.6.5.1.4 Rest of Middle East
- 5.6.5.2 Africa
- 5.6.5.2.1 South Africa
- 5.6.5.2.2 Nigeria
- 5.6.5.2.3 Rest of Africa
- 5.6.5.1 Middle East
- 5.6.1 North America
6 COMPETITIVE LANDSCAPE
- 6.1 Market Concentration
- 6.2 Strategic Moves
- 6.3 Market Share Analysis
- 6.4 Company Profiles (includes Global level Overview, Market level overview, Core Segments, Financials as available, Strategic Information, Market Rank/Share, Products and Services, and Recent Developments)
- 6.4.1 Barracuda Networks Inc.
- 6.4.2 Cato Networks Ltd.
- 6.4.3 Check Point Software Technologies Ltd.
- 6.4.4 Cisco Systems Inc.
- 6.4.5 Cloudflare Inc.
- 6.4.6 Forcepoint LLC
- 6.4.7 Fortinet Inc.
- 6.4.8 Hillstone Networks Co. Ltd.
- 6.4.9 IntraSystems Inc.
- 6.4.10 Juniper Networks Inc.
- 6.4.11 Microsoft Corporation
- 6.4.12 Netskope Inc.
- 6.4.13 Open Systems AG
- 6.4.14 Palo Alto Networks Inc.
- 6.4.15 Perimeter 81 Ltd.
- 6.4.16 SonicWall Inc.
- 6.4.17 Sophos Ltd.
- 6.4.18 Sprout Technologies Ltd.
- 6.4.19 Tufin Software Technologies Ltd.
- 6.4.20 Versa Networks Inc.
- 6.4.21 VMware Inc.
- 6.4.22 Vocus Communications Ltd.
- 6.4.23 WatchGuard Technologies Inc.
- 6.4.24 Zscaler Inc.
7 MARKET OPPORTUNITIES AND FUTURE OUTLOOK
- 7.1 White-space and Unmet-need Assessment