

|
시장보고서
상품코드
2123130
서버리스 컴퓨팅 시장 : 시장 점유율 분석, 업계 동향 및 통계, 성장 예측(2026-2031년)Serverless Computing - Market Share Analysis, Industry Trends & Statistics, Growth Forecasts (2026 - 2031) |
||||||
 Mordor Intelligence
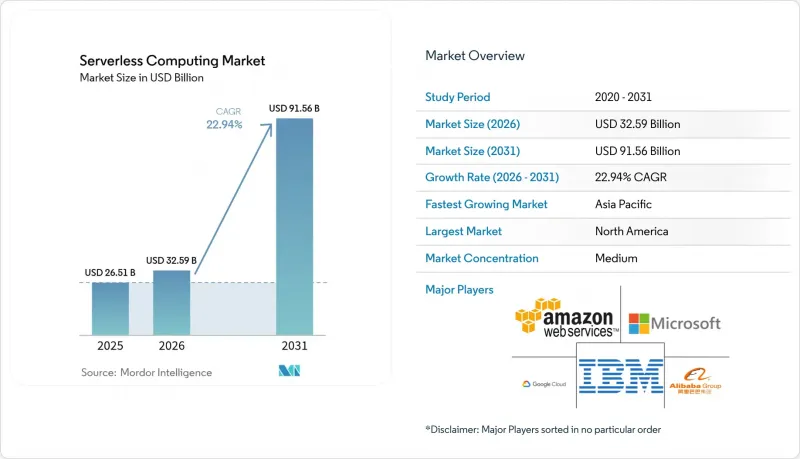
Mordor Intelligence에 의하면, 2026년 서버리스 컴퓨팅 시장 규모는 325억 9,000만 달러로 추정되고, 2025년 265억 1,000만 달러에서 성장하여 2031년에는 915억 6,000만 달러에 이를 것으로 예측됩니다.
2026-2031년 연평균 성장률(CAGR)은 22.94%를 나타낼 전망입니다.
본 보고서는 서비스 모델별(전문 서비스 및 관리형 서비스), 서비스 유형별(Function-As-A-Service(FaaS), Backend-As-A-Service(BaaS) 등), 구축 모델별(퍼블릭 클라우드, 프라이빗 클라우드 등), 최종 사용자 산업별(IT 및 통신, BFSI 등), 그리고 지역별로 분류되어 있습니다.
세계의 서버리스 컴퓨팅 시장 동향 및 인사이트
북미 BFSI 분야의 현대화가 진행됨에 따라 이벤트 주도형 마이크로서비스로의 전환이 가속화되고 있습니다.
은행과 보험사는 모놀리식 시스템을 카드 스와이프, 대출 견적, 부정 징후 등에 거의 실시간으로 반응하는 세밀한 서비스로 대체하고 있습니다. 서버리스 함수를 활용함으로써 북미의 주요 금융 기관들은 개발 주기를 35-40% 단축하고, 인프라 비용을 28.3% 절감하는 데 성공하여 새로운 디지털 기능 개발을 위한 예산을 확보했습니다. 이 모델의 ‘실행당 과금’ 방식은 결제 및 자산 운용 플랫폼에서 흔히 볼 수 있는 불규칙한 거래량에 적합합니다. 또한, API 우선 설계 덕분에 각 함수가 개별적으로 로그 기록, 암호화, 버전 관리를 수행할 수 있어 규제 감사도 간소화됩니다. 제로 트러스트(Zero Trust) 규정이 엄격해지는 가운데, BFSI 팀은 공격 표면을 축소하면서도 엄격한 감사 추적 요건을 충족하는 일시적인 컴퓨팅 환경을 선호하고 있습니다.
유럽 소매 및 전자상거래 업계에서 DevSecOps 지원 멀티 클라우드 파이프라인에 대한 수요 급증
유럽의 소매업체들은 GDPR(EU 개인정보보호규정)을 준수하면서도 즉시 결제 및 맞춤형 제안에 대응하기 위해 경쟁하고 있습니다. 현재 89%의 기업이 락인(lock-in)을 피하고 지역별 데이터 상주 요건을 유지하기 위해 서버리스 워크로드를 최소 두 개의 클라우드로 분산하고 있습니다. 내장된 정책 엔진이 커밋마다 코드를 스캔하고, 보안 테스트를 CI/CD에 통합하며, 시크릿을 자동으로 암호화함으로써 취약점이 노출되는 기간을 단축합니다. 보안 조치를 ‘왼쪽(개발 단계)’으로 앞당김으로써, 팀은 수정 시간을 단축하고 ‘싱글스 데이’나 ‘블랙 프라이데이’와 같은 계절적 성수기에도 더 신속하게 기능을 출시할 수 있게 됩니다.
고도로 분산된 마이크로 함수에서의 디버깅 및 가시성 과제
기존 APM 에이전트는 밀리초 단위로 실행되는 일시적인 함수를 추적할 수 없기 때문에 근본 원인 분석에 사각지대가 발생합니다. 기업에 따르면 서버리스 용도의 문제 해결에는 모놀리식 용도보다 2.4배 더 많은 시간이 소요된다고 합니다. 이는 로그가 서비스 전체에 흩어져 있고, 콜드 스타트로 인해 지연 시간의 이상치가 숨겨지기 때문입니다. 새로운 솔루션에서는 경량 스팬 ID를 주입하여 개방형 표준 백엔드로 내보낼 수 있게 되었지만, 그 성숙도는 아직 주류 도구에 미치지 못합니다. 트레이스, 메트릭, 로그가 원활하게 통합되기 전까지는 리스크 회피 성향이 강한 업계에서 미션 크리티컬 시스템의 마이그레이션을 주저할 것입니다.
부문 분석
조직이 턴키 운영을 우선시한 결과, 2025년 매출의 61.20%를 매니지드 서비스가 차지했지만, 기업들이 복잡한 현대화 프로그램을 추진함에 따라 프로페셔널 서비스는 2031년까지 연평균 성장률(CAGR) 17.65%로 확대되고 있습니다. 많은 규제 대상 기업들은 본격 가동 전에 이벤트 스키마 재설계, 모놀리식 애플리케이션 리팩토링, 규정 준수 검증을 수행하기 위해 컨설팅 파트너를 기용하고 있습니다. 자문 팀은 서버리스 보안 패턴, 정책-어-코드(Policy-as-Code), FinOps 대시보드를 통합하여 비즈니스 가치를 극대화합니다. 또한, 프로페셔널 서비스는 문화적 변혁도 지원하며, 제품 팀을 대상으로 비동기 설계 및 가시성 모범 사례에 대한 교육을 실시했습니다. 서버리스의 적용 범위가 애널리틱스, AI, 엣지로 확대됨에 따라, 지속적인 거버넌스와 플랫폼 엔지니어링이 개발 지원과 결합된 종합적인 서비스로 제공되고 있습니다. 이러한 진화를 통해 통합 업체는 높은 수익률의 성장을 유지하면서 기업의 가치 실현까지 걸리는 시간을 단축할 수 있습니다.
2025년에는 Function-as-a-Service(FaaS)가 지출의 57.30%를 차지했으며, 2031년까지 서버리스 컴퓨팅 시장의 기반을 유지할 것으로 전망됩니다. 그러나 팀들이 인증, 스토리지, 실시간 동기화를 API 호출에 통합하는 고수준의 구성을 요구함에 따라, Backend-as-a-Service(BaaS)는 연평균 성장률(CAGR) 24.32%를 기록하는 눈부신 성장 부문으로 부상하고 있습니다. 특히 모바일 개발자들은 로그인 및 푸시 알림을 위한 한 줄의 통합을 높이 평가하고 있으며, 이를 통해 릴리스 주기가 몇 주에서 몇 시간으로 단축되고 있습니다. BaaS는 반복적인 작업을 오프로드하여 FaaS를 보완하고, 함수가 차별화된 로직에 집중할 수 있도록 합니다. 통합 API 게이트웨이는 두 패러다임 전반에 걸쳐 트래픽을 균등하게 라우팅하고, 서버리스 컨테이너는 더 긴 수명의 프로세스가 필요한 성능 격차를 메워줍니다. 이러한 광범위한 추상화 옵션을 통해 아키텍트는 비용, 지연 시간, 규정 준수 요구 사항에 따라 조합을 유연하게 조정할 수 있습니다.
지역별 분석
북미는 풍부한 클라우드 인재, 적극적인 디지털 뱅킹 로드맵, 그리고 공격 표면을 축소하기 위해 일시적인 컴퓨팅을 권장하는 미국 연방 정부의 제로 트러스트 지침에 힘입어 2025년 서버리스 매출의 37.60%를 차지했습니다. 기업들은 서버리스를 활용하여 레거시 스택을 현대화하고, 이벤트 스트림을 통해 고객 개인화를 실현하며, 규정 준수를 위한 로깅 파이프라인을 운영하고 있습니다. 캐나다에서도 유사한 경향이 나타나며, 특히 5G 엣지 기능을 통합하는 통신 사업자에서 두드러집니다. 한편, 멕시코의 핀테크 스타트업들은 결제 API를 안전하게 확장하기 위해 서버리스를 채택하고 있습니다.
아시아태평양은 가장 빠르게 성장하는 지역으로, 2031년까지 연평균 성장률(CAGR)이 19.05%를 나타낼 것으로 예측됩니다. 중국의 주요 인터넷 기업들은 네이티브 서버리스 AI 서비스에 투자하고 있으며, 인도의 급성장하는 SaaS 부문은 예측 불가능한 전 세계 수요에 대응하기 위해 종량제 과금 모델을 채택하고 있습니다. 일본과 한국의 제조업체들은 예측 유지보수를 위해 엣지 기능을 통합하고 있는 반면, 아세안(ASEAN)의 핀테크 및 전자상거래 기업들은 저지연으로 지역 고객에게 도달하기 위해 멀티 클라우드 서버리스 스택을 도입하고 있습니다. 5G MEC, 합리적인 가격의 클라우드 스팟, 개발자 역량 향상이 맞물려 이 지역 전반에 걸쳐 도입이 가속화되고 있습니다.
유럽에서는 조직들이 GDPR(EU 개인정보보호규정) 및 국가 주권 관련 규제를 준수하기 위해 멀티클라우드를 채택하고 있어 여전히 견고한 입지를 유지하고 있습니다. 영국, 독일, 프랑스가 주도하여 소매, 은행, 공공 부문의 시범 프로젝트에서 암호화, 감사, 데이터 거주에 관한 공통된 청사진을 공유하고 있습니다. 북유럽 국가들은 친환경 데이터센터 통합 및 이벤트 기반 전력망 도입을 통해 새로운 지평을 열고 있습니다. 각 벤더들은 지역에 최적화된 존과 이식성이 뛰어난 런타임을 제공함으로써 이에 대응하고 있으며, 규제 환경이 엄격해지고 있음에도 불구하고 성장을 견인하고 있습니다.
기타 혜택 :
- 엑셀 형식 시장 예측(ME) 시트
- 3개월간의 애널리스트 지원
자주 묻는 질문
목차
제1장 서론
제2장 조사 방법
제3장 주요 요약
제4장 시장 구도
제5장 시장 규모 및 성장 예측
제6장 경쟁 구도
제7장 시장 기회 및 향후 전망
AJY 26.09.07According to Mordor Intelligence, serverless computing market size in 2026 is estimated at USD 32.59 billion, growing from 2025 value of USD 26.51 billion with 2031 projections showing USD 91.56 billion, growing at 22.94% CAGR over 2026-2031.
This report is Segmented by Service Model (Professional Services and Managed Services), Service Type (Function-As-A-Service (FaaS), Backend-As-A-Service (BaaS), and More), Deployment Model (Public Cloud, Private Cloud, and More), End-User Industry (IT and Telecommunications, BFSI, and More), and Geography
Global Serverless Computing Market Trends and Insights
Accelerating Shift to Event-Driven Microservices in North American BFSI Modernization
Banks and insurers are replacing monoliths with granular services that react to card swipes, loan quotes and fraud signals in near real time. Using serverless functions, leading North American institutions trimmed development cycles by 35-40% and shaved 28.3% off infrastructure spend, freeing budget for new digital features. The model's pay-per-execute billing fits irregular transaction volumes common in payments and wealth platforms. API-first designs also simplify regulatory audits because each function can log, encrypt and version individually. As zero-trust rules tighten, BFSI teams prefer ephemeral compute that reduces attack surface while meeting stringent audit trails.
Surging Demand for DevSecOps-Ready Multi-Cloud Pipelines Across European Retail and E-commerce
European retailers race to match instant checkout and personalized offers while obeying GDPR. Eighty-nine percent now distribute serverless workloads across at least two clouds to avoid lock-in and maintain regional data residency. Built-in policy engines scan code on every commit, integrate security tests into CI/CD and auto-encrypt secrets, shrinking vulnerability windows. By shifting security left, teams cut remediation time and push features faster during seasonal peaks such as Singles' Day and Black Friday.
Debugging and Observability Gaps in Highly Distributed Micro-Functions
Traditional APM agents cannot trace ephemeral functions that live for milliseconds, leaving blind spots during root-cause analysis. Enterprises report troubleshooting serverless apps takes 2.4 times longer than monoliths because logs scatter across services and cold-starts mask latency outliers. Emerging solutions now inject lightweight span IDs and export them to open-standard back ends, yet maturity lags mainstream tooling. Until traces, metrics and logs consolidate seamlessly, risk-averse sectors will hesitate to migrate mission-critical systems.
Other drivers and restraints analyzed in the detailed report include:
- Roll-out of Edge-Native 5G MEC Driving Serverless Adoption Among Asia Telecom Operators
- Real-Time AI/ML Inference Workloads Propelling Function-as-a-Service Uptake in Healthcare
- Vendor Lock-In Risk Amplified by Proprietary Event Orchestration Engines
For complete list of drivers and restraints, kindly check the Table Of Contents.
Segment Analysis
Managed Services held 61.20% of 2025 revenue as organizations prioritized turnkey operations, but Professional Services is expanding at an 17.65% CAGR to 2031 as firms tackle complex modernization programs. Many regulated enterprises hire consulting partners to redesign event schemas, refactor monoliths and validate compliance before going live. Advisory teams integrate serverless security patterns, policy-as-code and FinOps dashboards to maximize business value.Professional Services also support culture change, training product squads on asynchronous design and observability best practices. As serverless footprints widen to analytics, AI and edge, continuous governance and platform engineering join development assistance in bundled engagements. This evolution sustains high-margin growth for integrators while improving enterprise time-to-value.
Function-as-a-Service captured 57.30% of spending in 2025 and will keep anchoring the serverless computing market through 2031. Yet Backend-as-a-Service is the star growth segment at 24.32% CAGR as teams seek higher-level constructs that collapse authentication, storage and real-time sync into API calls. Mobile developers in particular appreciate one-line integration for login and push notifications, cutting launch cycles from weeks to hours.BaaS complements FaaS by offloading boilerplate tasks, letting functions focus on differentiated logic. Unified API gateways route traffic uniformly across both paradigms, while serverless containers fill performance gaps that demand longer-lived processes. The spectrum of abstractions allows architects to mix and match for cost, latency and compliance needs.
Complete Report Scope:
- By Service Model
- Professional Services
- Managed Services
- By Service Type
- Function-as-a-Service (FaaS)
- Backend-as-a-Service (BaaS)
- API Gateway
- Container-as-a-Service (CaaS)
- By Deployment Model
- Public Cloud
- Private Cloud
- Hybrid Cloud
- Multi-Cloud
- By End-user Industry
- IT and Telecommunications
- BFSI
- Retail and E-commerce
- Government and Public Sector
- Healthcare and Life Sciences
- Industrial and Manufacturing
- Media and Entertainment
- Others
- By Geography
- North America
- United States
- Canada
- Mexico
- South America
- Brazil
- Argentina
- Rest of South America
- Europe
- United Kingdom
- Germany
- France
- Italy
- Spain
- Rest of Europe
- Nordics
- Sweden
- Norway
- Denmark
- Finland
- Middle East
- Saudi Arabia
- United Arab Emirates
- Turkey
- Rest of Middle East
- Africa
- South Africa
- Nigeria
- Egypt
- Rest of Africa
- Asia Pacific
- China
- India
- Japan
- South Korea
- ASEAN
- Rest of Asia Pacific
- North America
Geography Analysis
North America drove 37.60% of 2025 serverless revenue, supported by abundant cloud talent, aggressive digital banking roadmaps, and U.S. federal zero-trust directives that favor ephemeral compute for reduced attack surface. Enterprises leverage serverless to modernize legacy stacks, employ event streams for customer personalization, and run compliance-ready logging pipelines. Canada mirrors these patterns, especially among telcos integrating 5G edge functions, while Mexico's fintech startups adopt serverless to scale payment APIs securely.
Asia Pacific is the fastest-growing region, projected at 19.05% CAGR to 2031. China's internet majors invest in native serverless AI services, and India's booming SaaS sector embraces the pay-as-you-go model to manage unpredictable global demand. Japanese and South Korean manufacturers integrate edge functions for predictive maintenance, whereas ASEAN fintech and e-commerce players deploy multi-cloud serverless stacks to reach regional customers with low latency. The confluence of 5G MEC, affordable cloud spots and developer upskilling accelerates uptake across the region.
Europe maintains a strong position as organizations adopt multi-cloud to satisfy GDPR and state sovereignty rules. The United Kingdom, Germany and France lead with retail, banking and public-sector pilots that share common blueprints for encryption, audit and residency. Nordic countries push boundaries with green data-center integrations and event-driven energy grids. Vendors respond with localized zones and portable runtimes, reinforcing growth despite stricter compliance landscapes.
- Amazon Web Services Inc.
- Microsoft Corp.
- Google LLC
- Alibaba Group Holding Ltd.
- IBM Corp.
- Oracle Corp.
- SAP SE
- VMware Inc.
- Red Hat Inc.
- Cloudflare Inc.
- Fastly Inc.
- Tencent Cloud
- Huawei Cloud
- Netlify Inc.
- Vercel Inc.
- DigitalOcean Inc.
- Iron.io
- TriggerMesh Inc.
- Serverless Inc.
- Stackery Inc.
Additional Benefits:
- The market estimate (ME) sheet in Excel format
- 3 months of analyst support
TABLE OF CONTENTS
1 INTRODUCTION
- 1.1 Study Assumptions and Market Definition
- 1.2 Scope of the Study
2 RESEARCH METHODOLOGY
3 EXECUTIVE SUMMARY
4 MARKET LANDSCAPE
- 4.1 Market Overview
- 4.2 Market Drivers
- 4.2.1 Accelerating shift to event-driven microservices in North American BFSI modernisation
- 4.2.2 Surging demand for DevSecOps-ready multi-cloud pipelines across European retail and e-commerce
- 4.2.3 Roll-out of edge-native 5G MEC driving serverless adoption among Asia telecom operators
- 4.2.4 Real-time AI/ML inference workloads propelling Function-as-a-Service uptake in healthcare
- 4.2.5 Government Zero-Trust mandates boosting serverless security toolchains in US federal IT
- 4.2.6 Rapid expansion of API monetisation platforms in LATAM fintech ecosystems
- 4.3 Market Restraints
- 4.3.1 Debugging and observability gaps in highly distributed micro-functions
- 4.3.2 Vendor lock-in risk amplified by proprietary event orchestration engines
- 4.3.3 Data residency compliance hurdles for multi-region serverless data stores
- 4.3.4 Cold-start latency constraints in high-frequency trading and gaming workloads
- 4.4 Value Chain Analysis
- 4.5 Regulatory Outlook
- 4.6 Technological Outlook
- 4.7 Porter's Five Forces Analysis
- 4.7.1 Bargaining Power of Suppliers
- 4.7.2 Bargaining Power of Buyers
- 4.7.3 Threat of New Entrants
- 4.7.4 Threat of Substitutes
- 4.7.5 Intensity of Competitive Rivalry
- 4.8 Investment Analysis
- 4.9 Technology Snapshot
- 4.9.1 API Gateway
- 4.9.2 Function-as-a-Service (FaaS)
- 4.9.3 Backend-as-a-Service (BaaS)
- 4.9.4 Database-as-a-Service (DBaaS)
5 MARKET SIZE AND GROWTH FORECASTS (VALUE)
- 5.1 By Service Model
- 5.1.1 Professional Services
- 5.1.2 Managed Services
- 5.2 By Service Type
- 5.2.1 Function-as-a-Service (FaaS)
- 5.2.2 Backend-as-a-Service (BaaS)
- 5.2.3 API Gateway
- 5.2.4 Container-as-a-Service (CaaS)
- 5.3 By Deployment Model
- 5.3.1 Public Cloud
- 5.3.2 Private Cloud
- 5.3.3 Hybrid Cloud
- 5.3.4 Multi-Cloud
- 5.4 By End-user Industry
- 5.4.1 IT and Telecommunications
- 5.4.2 BFSI
- 5.4.3 Retail and E-commerce
- 5.4.4 Government and Public Sector
- 5.4.5 Healthcare and Life Sciences
- 5.4.6 Industrial and Manufacturing
- 5.4.7 Media and Entertainment
- 5.4.8 Others
- 5.5 By Geography
- 5.5.1 North America
- 5.5.1.1 United States
- 5.5.1.2 Canada
- 5.5.1.3 Mexico
- 5.5.2 South America
- 5.5.2.1 Brazil
- 5.5.2.2 Argentina
- 5.5.2.3 Rest of South America
- 5.5.3 Europe
- 5.5.3.1 United Kingdom
- 5.5.3.2 Germany
- 5.5.3.3 France
- 5.5.3.4 Italy
- 5.5.3.5 Spain
- 5.5.3.6 Rest of Europe
- 5.5.4 Nordics
- 5.5.4.1 Sweden
- 5.5.4.2 Norway
- 5.5.4.3 Denmark
- 5.5.4.4 Finland
- 5.5.5 Middle East
- 5.5.5.1 Saudi Arabia
- 5.5.5.2 United Arab Emirates
- 5.5.5.3 Turkey
- 5.5.5.4 Rest of Middle East
- 5.5.6 Africa
- 5.5.6.1 South Africa
- 5.5.6.2 Nigeria
- 5.5.6.3 Egypt
- 5.5.6.4 Rest of Africa
- 5.5.7 Asia Pacific
- 5.5.7.1 China
- 5.5.7.2 India
- 5.5.7.3 Japan
- 5.5.7.4 South Korea
- 5.5.7.5 ASEAN
- 5.5.7.6 Rest of Asia Pacific
- 5.5.1 North America
6 COMPETITIVE LANDSCAPE
- 6.1 Market Concentration
- 6.2 Strategic Moves
- 6.3 Market Share Analysis
- 6.4 Company Profiles (includes Global level Overview, Market level overview, Core Segments, Financials as available, Strategic Information, Market Rank/Share for key companies, Products and Services, and Recent Developments)
- 6.4.1 Amazon Web Services Inc.
- 6.4.2 Microsoft Corp.
- 6.4.3 Google LLC
- 6.4.4 Alibaba Group Holding Ltd.
- 6.4.5 IBM Corp.
- 6.4.6 Oracle Corp.
- 6.4.7 SAP SE
- 6.4.8 VMware Inc.
- 6.4.9 Red Hat Inc.
- 6.4.10 Cloudflare Inc.
- 6.4.11 Fastly Inc.
- 6.4.12 Tencent Cloud
- 6.4.13 Huawei Cloud
- 6.4.14 Netlify Inc.
- 6.4.15 Vercel Inc.
- 6.4.16 DigitalOcean Inc.
- 6.4.17 Iron.io
- 6.4.18 TriggerMesh Inc.
- 6.4.19 Serverless Inc.
- 6.4.20 Stackery Inc.
7 MARKET OPPORTUNITIES AND FUTURE OUTLOOK
- 7.1 White-space and Unmet-need Assessment


