

|
시장보고서
상품코드
2123131
디지털 지도 시장 : 점유율 분석, 산업 동향 및 통계 데이터, 성장 예측(2026-2031년)Digital Map - Market Share Analysis, Industry Trends & Statistics, Growth Forecasts (2026 - 2031) |
||||||
 Mordor Intelligence
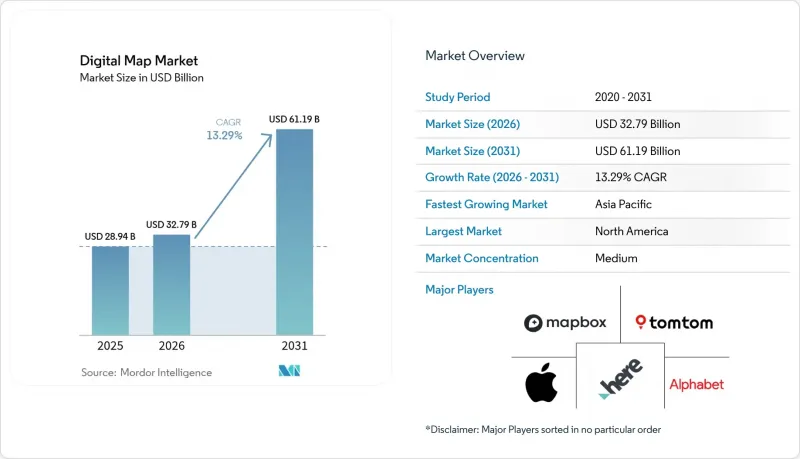
Mordor Intelligence에 의하면, 디지털 지도 시장 규모는 2025년에 289억 4,000만 달러, 2026년에 327억 9,000만 달러가 되어, 2031년까지 611억 9,000만 달러에 이를 것으로 예측되며, 2026년부터 2031년까지 CAGR 13.29%로 성장할 전망입니다.
본 보고서는 솔루션(소프트웨어, 서비스), 배포 방식(On-Premise, 클라우드), 지도 유형(내비게이션 지도, HD(고해상도)·실시간 지도, 지형도·주제 지도),최종 이용 산업(자동차, 엔지니어링·건설, 기타), 지역(북미, 남미, 유럽, 아시아태평양, 중동 및 아프리카)별로 분류되어 있습니다. 시장 예측은 금액(달러) 기준으로 제시되어 있습니다.
세계 디지털 지도 시장 동향 및 인사이트
ADAS·자율주행차용 HD 지도의 급속한 보급
현재 SAE 레벨 3 및 레벨 4 기능을 도입하고 있는 자동차 제조업체들은 센티미터 단위의 정밀도를 갖춘 HD 베이스맵을 안전상 필수적인 장비로 간주하고 있습니다. 메르세데스-벤츠는 HERE사의 ‘HD Live Map’을 활용하여 캘리포니아주 및 네바다주에서 ‘Drive Pilot’을 가동했습니다. 이 시스템은 500만 대 이상의 차량에서 수집된 센서 데이터를 융합하여 차선 표시 정확도를 10센티미터 이내로 유지하고 있습니다. BMW와 폭스바겐의 ‘Dynamic Map Platform’은 매일 15테라바이트의 프로브 데이터를 처리하여 120만 킬로미터에 달하는 유럽 및 일본 지역의 네트워크를 업데이트하고 있으며, 이를 통해 순수한 LiDAR 측량의 높은 비용이 부각되고 있습니다. 2025년 SAE 기술 논문에 따르면, 정적 HD 레이어에 크라우드소싱을 통한 업데이트 정보를 중첩시킴으로써 정확도를 저하시키지 않고 업데이트 비용을 약 40% 절감할 수 있는 것으로 나타났습니다. 이러한 하이브리드 모델을 통해 정기적인 실주행 조사에만 의존하는 대신, 차량 탑재 센서 융합과 클라우드 분석을 결합한 서비스 제공업체에 대한 투자가 확대되고 있습니다.
커넥티드카용 OTA 지도 업데이트 생태계의 폭발적인 성장
운전자와 안전 규제 당국이 최신 도로 데이터를 요구함에 따라, 무선 배포(OTA)는 단순한 프리미엄 추가 기능에서 규제 기준으로 전환되었습니다. 포드는 2024년에 6,300만 개의 델타 압축 지도 패키지를 배포하여 셀룰러 통신 데이터 전송량을 85% 줄이고 데이터 비용을 대폭 절감했습니다. 스텔란티스는 스냅드래곤 라이드 플렉스(Snapdragon Ride Flex) 칩을 탑재하여 차량 충전 중에 업데이트가 자동으로 실행되도록 함으로써, 과거 중요한 패치 적용을 지연시켰던 문제를 해결했습니다. 테슬라는 매월 15억 플릿 마일의 데이터를 수집하고, 제3자에게 로열티를 지불하지 않고도 차선 형태를 업데이트함으로써 수직 통합을 통한 이익률 향상 가능성을 입증하고 있습니다. 다양한 텔레매틱스 스택과 원활하게 통합될 수 있는 경량 API 제공을 꺼리는 지도 공급업체는 독자적인 파이프라인을 구축하는 OEM에 시장 점유율을 빼앗길 위험에 직면해 있습니다.
지속적인 센티미터 수준의 지도 업데이트에 따른 비용 급증
대륙 규모의 도로 네트워크 전체에서 10센티미터 미만의 정확도를 실현하려면 대규모 LiDAR 차량 군, 항공 사진 및 클라우드 처리가 필요하며, 이는 세계의 대기업만이 감당할 수 있는 것입니다. HERE의 200대로 구성된 라이다 차량군은 업데이트 주기가 분기별에서 주간으로 단축되었을 때, HD 서비스의 매출 총이익률을 320 베이시스 포인트 하락시켰습니다. TomTom은 2차 시장에서의 측량 빈도를 줄이고 위성을 통한 변화 감지로 전환했습니다. 이를 통해 비용을 30% 절감했지만, 업데이트 지연은 며칠에서 몇 주로 늘어났습니다. 소규모 신생 기업들은 대시캠의 컴퓨터 비전에 의존하고 있지만, 그럼에도 레벨 4의 정확도 목표를 달성하는 데 어려움을 겪고 있습니다. 이러한 경제적 요인들이 기존 기업들의 경쟁 우위를 더욱 공고히 하고, 업계의 지각변동을 둔화시키고 있습니다.
부문 분석
2025년 현재, 소프트웨어는 디지털 지도 시장 점유율의 64.33%를 차지하고 있으며, 이러한 입지는 수십 년에 걸친 데스크톱 GIS 라이선스 및 임베디드 내비게이션 스택을 통해 구축되어 왔습니다. 그럼에도 불구하고, 지속적인 지도 업데이트 구독에서 클라우드 통합 컨설팅에 이르는 서비스 매출은 2031년까지 연평균 성장률(CAGR) 13.71%로 증가할 것으로 예상되며, 이 기간 동안 디지털 지도 시장 증가분에서 가장 큰 비중을 차지할 것입니다. 기업들은 현재 일시적인 설비 투자보다 예측 가능한 운영비 모델을 선호하는 경향을 보이고 있습니다. 트림블(Trimble)이 2024년에 경로 계획 API와 물류 컨설팅을 결합한 서비스를 제공하는 트랜스포레온(Transporeon)을 인수함에 따라, 2025년 상반기 구독 계약 건수는 전년 동기 대비 28% 증가했습니다. Esri와 Maxar 역시 지자체를 대상으로 한 디지털 트윈 프로젝트에서 유사한 추세를 보고하고 있으며, 고객들은 라이선스 수보다는 갱신 빈도에 연동된 성과 기반 계약을 강력히 요구하고 있습니다.
서비스로의 전환은 인재 전략의 측면도 가지고 있습니다. 사내에 지리공간 전문가를 보유한 기업은 거의 없기 때문에 데이터 융합, 맞춤형 지도 제작, API 거버넌스를 서비스 수준 계약(SLA)을 보장할 수 있는 공급업체에 외주하고 있습니다. 절대액으로 보면 소프트웨어가 여전히 더 큰 수익원이지만, 클라우드 네이티브 오픈소스 스택이 가격 결정력을 약화시키고 있어 라이선싱 매출의 성장세는 둔화되고 있습니다. 탄탄한 컨설팅 부문이나 매니지드 호스팅 부문을 구축하지 못한 벤더는 이미 고객과의 관계를 확립한 시스템 통합사업자나 하이퍼스케일러에게 매출 점유율을 빼앗길 위험이 있습니다.
2025년 매출 중 클라우드 배포가 71.42%를 차지하며, 2031년까지 연평균 성장률(CAGR) 13.66%를 유지할 것으로 예측됩니다. 이에 따라 디지털 지도 시장 전체에서 ‘클라우드 퍼스트’ 기조가 더욱 강화될 것입니다. AWS Location Service가 HERE, Esri, Grab의 타일을 단일 종량제 엔드포인트를 통해 제공함으로써, 기업은 여러 차례의 협상에 수반되는 복잡성을 피할 수 있습니다. 마이크로소프트는 2025년 3월, 한 걸음 더 나아가 Azure Maps를 Power BI에 통합했습니다. 이를 통해 분석가는 코드를 작성하지 않고도 영업 구역을 중첩할 수 있게 되었습니다. 이러한 움직임은 도입 장벽을 대폭 낮추고, GIS 전문가가 아닌 사용자층의 채택을 가속화하여 디지털 지도 시장 규모 중 새로운 부분을 클라우드 분야로 끌어올리게 될 것입니다.
On-Premise 서버는 주권 데이터나 에어갭 요건이 여전히 확고한 국방, 중요 인프라, 그리고 규제가 엄격한 공공 서비스 분야에서 여전히 사용되고 있습니다. Esri는 2025년 사용자 컨퍼런스에서 ArcGIS Enterprise 라이선스의 약 30%가 여전히 고객의 자체 서버에서 운영되고 있다고 밝혔습니다. 이는 2020년의 55%에서 감소한 수치입니다. 유럽, 인도, 중동에서 주권 클라우드 리전이 개설됨에 따라 이러한 워크로드의 일부조차도 이전될 것으로 예측됩니다. 분석가들은 2031년까지 On-Premise 디지털 지도 시장 점유율이 20-25% 수준에서 안정화될 것으로 전망하며, 제로 연결 요건을 충족할 수 있는 벤더들에게는 전문적이면서도 수익성이 높은 틈새 시장을 형성할 것으로 보고 있습니다.
지역별 분석
북미는 2025년 매출의 36.83%를 차지하며, 기준 연도에 디지털 지도 시장에서 가장 큰 점유율을 기록했습니다. 캘리포니아주와 네바다주에서 진행 중인 자율주행차 실증 실험이 보급을 주도하고 있으며, 테슬라의 대규모 차량 텔레메트리 데이터와 견조한 미국 국방 분야의 지리공간 관련 예산도 기여하고 있습니다. 연방통신위원회(FCC)가 2024년에 ‘Cellular Vehicle-to-Everything(C-V2X)’ 주파수 대역을 할당함에 따라 커넥티드카 도입이 가속화되었고, 실시간 교통 정보 및 위험 구역 정보를 표시하는 레이어에 대한 수요가 증가했습니다. 캐나다는 캐나다 천연자원부가 제공하는 개방형 기본 지도의 혜택을 받고 있어 신생 기업의 진입 장벽이 낮아진 반면, 멕시코는 지방 지역의 광대역 격차가 클라우드 GIS 도입을 제한하고 있어 뒤처지고 있습니다. 커넥티드카 보급률이 포화 상태에 가까워짐에 따라, 해당 지역의 성장률은 세계 평균 연평균 성장률(CAGR) 13.29%를 밑돌 것으로 예상되지만, 국방 기관에 의한 고해상도 지형 데이터 업데이트에 따라 절대적인 지출액은 여전히 확대될 전망입니다.
아시아태평양은 2031년까지 14.24%라는 가장 높은 연평균 성장률(CAGR)을 보일 것으로 예측되며, 예측 기간 동안 디지털 지도 시장 증가분에서 가장 큰 비중을 차지할 전망입니다. 중국의 ‘바이두 맵(Baidu Maps)’은 전기차 충전소 설치 현황 및 자율주행 택시 경로 안내 기능을 통합한 후, 2024년 4분기에 월간 활성 사용자 수 6억 5,000만 명을 기록했습니다. 인도의 ‘스마트 시티 미션(Smart City Mission)’에서는 지정된 100개 지자체 모두에 폐기물, 모빌리티, 수자원 관리를 위한 GIS 플랫폼 도입이 의무화되어 있으며, 이로 인해 MapmyIndia와 Esri India에 수년에 걸친 계약이 성사되었습니다. 일본의 젠린과 토요타의 제휴를 통해 레벨 3 ‘렉서스 팀메이트’용 고정밀 지도가 구축되고 있는 한편,한국은 2027년 부산 엑스포를 앞두고 도로망을 10센티미터 해상도로 디지털화하기 위해 5,000억 원(3억 7,500만 달러)을 배정했습니다. 이러한 프로그램들은 급속한 5G 확산과 맞물려 이 지역의 지속적인 두 자릿수 성장을 뒷받침하고 있습니다.
유럽은 2025년에 25% 중반대의 점유율을 기록했습니다. 이는 EU의 eCall 의무화와 갈릴레오 위성의 정확도 향상에 힘입은 결과입니다. ‘디지털 시장법’에 따라 애플과 구글은 지도 API 공개가 의무화되었으며, 이 규제로 인해 HERE나 TomTom과 같은 지역 전문 기업으로 수요가 이동할 가능성이 있습니다. 엄격한 GDPR(EU 개인정보보호규정)의 현지화 요건은 프랑크푸르트나 암스테르담에 주권형 클라우드를 보유한 벤더에게 유리하게 작용하여 기존 기업의 입지를 강화하고 있습니다. 중동 및 아프리카에서는 아랍에미리트(UAE)와 사우디아라비아가 스마트 시티 쌍둥이 프로젝트에 자금을 투입하고 있지만, 사하라 이남 아프리카에서의 도입은 지적 데이터베이스 부족으로 인해 제약을 받고 있습니다. 남미 수요는 브라질과 아르헨티나에 집중되어 있으며, 이들 국가에서는 도시 물류 플랫폼에 신뢰할 수 있는 경로 안내가 요구되고 있지만, 환율 변동이 장기적인 인프라 투자를 억제하고 있습니다.
기타 혜택:
- Excel 형식 시장 예측(ME) 시트
- 3개월간 애널리스트 지원
자주 묻는 질문
목차
제1장 서론
제2장 분석 방법
제3장 주요 요약
제4장 시장 구도
제5장 시장 규모 및 성장률 예측
제6장 경쟁 구도
제7장 시장 기회와 향후 전망
JHS 26.09.09According to Mordor Intelligence, the digital map market size is projected to be USD 28.94 billion in 2025, USD 32.79 billion in 2026, and reach USD 61.19 billion by 2031, growing at a CAGR of 13.29% from 2026 to 2031.
This report is Segmented by Solution (Software, and Services), Deployment (On-Premise, and Cloud), Map Type (Navigation Maps, HD and Real-Time Maps, Topographic and Thematic Maps), End-Use Industry (Automotive, Engineering and Construction, and More), and Geography (North America, South America, Europe, Asia-Pacific, Middle East and Africa). The Market Forecasts are Provided in Terms of Value (USD).
Global Digital Map Market Trends and Insights
Rapid Uptake of HD Maps for ADAS and Autonomous Vehicles
Automakers rolling out SAE Level 3 and Level 4 features now treat centimeter-grade HD basemaps as non-negotiable safety equipment. Mercedes-Benz activated Drive Pilot in California and Nevada using HERE's HD Live Map, which fuses sensor data from more than 5 million vehicles to keep lane markings accurate within 10 centimeters. BMW and Volkswagen's Dynamic Map Platform processes 15 terabytes of probe data each day to refresh a 1.2-million-kilometer European-Japanese network, revealing the high cost of pure LiDAR surveys. A 2025 SAE technical paper showed that overlaying crowd-sourced updates on a static HD layer can trim refresh expense by roughly 40% without losing accuracy. This hybrid model is steering investment toward providers that pair on-board sensor fusion with cloud analytics rather than rely on periodic drive-outs.
Explosive Growth of Connected-Car OTA Map-Update Ecosystems
Over-the-air delivery has moved from a premium add-on to a regulatory baseline as drivers and safety agencies demand up-to-the-minute road data. Ford pushed 63 million delta-compressed map packages in 2024, cutting cellular payloads 85% and slashing data costs. Stellantis embedded Snapdragon Ride Flex chips so updates run automatically while vehicles charge, eliminating the latency that once delayed critical patches. Tesla ingests 1.5 billion fleet miles each month, refreshing lane geometry without third-party royalties and proving the margin upside of vertical integration. Map vendors unwilling to offer lightweight APIs that integrate seamlessly with diverse telematics stacks risk losing share to OEMs writing their own pipelines.
Escalating Costs of Continuous, Centimeter-Level Map Refresh
Sub-10-centimeter accuracy across continental road networks demands heavy LiDAR fleets, aerial imagery, and cloud processing that only global incumbents can afford. HERE's 200-vehicle LiDAR armada cut gross margin on HD services by 320 basis points when refresh cycles tightened from quarterly to weekly. TomTom trimmed survey cadence in secondary markets and pivoted to satellite change detection, lowering costs 30% but stretching update latency from days to weeks. Smaller challengers rely on dash-cam computer vision yet still struggle to meet Level 4 precision targets. The economics widen incumbents' moats and slow competitive churn.
Other drivers and restraints analyzed in the detailed report include:
- Mainstream Adoption of Cloud-Native GIS Platforms
- Smart-City Digital-Twin Programs Scaling Globally
- Heightened Data-Privacy and Localization Statutes (GDPR, PIPL)
For complete list of drivers and restraints, kindly check the Table Of Contents.
Segment Analysis
Software accounted for 64.33% of the digital map market share in 2025, a position built on decades of desktop GIS licenses and embedded navigation stacks. Even so, service revenues, ranging from continuous map-refresh subscriptions to cloud-integration consulting, are forecast to climb at a 13.71% CAGR through 2031, adding the largest slice of the incremental digital map market over the period. Enterprises now favor predictable operating expense models over one-time capital outlays; Trimble's 2024 purchase of Transporeon, which bundles routing APIs with logistics consulting, produced a 28% year-over-year lift in subscription lines during 1H 2025. Esri and Maxar report the same pattern in municipal digital-twin engagements, where customers insist on outcome-based contracts tied to refresh frequency rather than seat counts.
The tilt toward services is also a talent play. Few enterprises employ in-house geospatial experts, so they outsource data fusion, custom cartography, and API governance to suppliers that can guarantee service-level agreements. Software will remain the larger revenue pool in absolute terms, but licensing growth is decelerating as cloud-native open-source stacks undercut pricing power. Vendors that fail to build substantial consulting and managed-hosting arms risk ceding wallet share to systems integrators or hyperscalers that already command the customer relationship.
Cloud installations accounted for 71.42% of 2025 revenue and are projected to maintain a 13.66% CAGR through 2031, reinforcing a cloud-first stance across the digital map market. With AWS Location Service exposing HERE, Esri, and Grab tiles behind a single pay-as-you-go endpoint, enterprises avoid the complexity of multiple negotiations. Microsoft went further in March 2025, embedding Azure Maps inside Power BI so analysts can overlay sales territories without writing code. These moves slash deployment friction and accelerate adoption among non-GIS specialists, driving new chunks of the digital map market size into the cloud column.
On-premises servers persist in defense, critical infrastructure, and heavily regulated utilities where sovereign data or air-gap mandates remain immovable. Esri disclosed at its 2025 user conference that roughly 30% of ArcGIS Enterprise seats still run on customer metal, down from 55% in 2020. As sovereign cloud regions open in Europe, India, and the Middle East, even some of those workloads are expected to migrate. By 2031, analysts see on-premises stabilizing at 20-25% of the digital map market share, anchoring a specialized but profitable niche for vendors able to meet zero-connectivity requirements.
Complete Report Scope:
- By Solution
- Software
- Services
- By Deployment
- On-Premise
- Cloud
- By Map Type
- Navigation Maps
- HD and Real-Time Maps
- Topographic and Thematic Maps
- By End-Use Industry
- Automotive
- Engineering and Construction
- Telecommunications
- Public Sector and Defense
- Retail and Geomarketing
- Other End-Use Industries
- By Geography
- North America
- United States
- Canada
- Mexico
- South America
- Brazil
- Argentina
- Rest of South America
- Europe
- United Kingdom
- Germany
- France
- Italy
- Rest of Europe
- Asia Pacific
- China
- Japan
- India
- South Korea
- Rest of Asia Pacific
- Middle East and Africa
- Middle East
- United Arab Emirates
- Saudi Arabia
- Rest of Middle East
- Africa
- South Africa
- Egypt
- Rest of Africa
- Middle East
- North America
Geography Analysis
North America accounted for 36.83% of 2025 revenue, giving the region the largest share of the digital map market in the base year. Autonomous-vehicle pilots in California and Nevada drive uptake, Tesla's high-volume fleet telemetry, and robust U.S. defense geospatial budgets. The Federal Communications Commission's 2024 allocation of Cellular Vehicle-to-Everything spectrum accelerated connected-car deployments and boosted demand for real-time traffic and hazard layers. Canada benefits from Natural Resources Canada's open basemaps, which lower entry barriers for start-ups, while Mexico lags because rural broadband gaps limit cloud GIS adoption. As connected-vehicle penetration nears saturation, regional growth is expected to trail the 13.29% global CAGR, but absolute spending will still expand as defense agencies refresh HD terrain data.
Asia-Pacific is projected to post the fastest 14.24% CAGR through 2031 and will add the largest share of the incremental digital map market over the forecast window. China's Baidu Maps recorded 650 million monthly active users in Q4 2024 after integrating EV-charger availability and autonomous-taxi routing. India's Smart Cities Mission requires all 100 designated municipalities to deploy GIS platforms for waste, mobility, and water management, feeding multiyear contracts to MapmyIndia and Esri India. Japan's Zenrin-Toyota partnership is building HD maps for Level 3 Lexus Teammate, while South Korea earmarked KRW 500 billion (USD 375 million) to digitize its road grid at 10-centimeter resolution ahead of the 2027 Busan World Expo. These programs, combined with rapid 5G rollout, underpin sustained double-digit regional growth.
Europe captured a mid-20s share in 2025, supported by the EU's eCall mandate and improvements in Galileo satellite accuracy. The Digital Markets Act now obliges Apple and Google to open mapping APIs, a rule that could redirect traffic to regional specialists such as HERE and TomTom. Strict GDPR localization favors vendors with sovereign clouds in Frankfurt and Amsterdam, reinforcing incumbent positions. In the Middle East and Africa, the United Arab Emirates and Saudi Arabia bankroll smart-city twins, yet sub-Saharan African adoption is constrained by limited cadastral databases. South American demand is centered on Brazil and Argentina, where urban logistics platforms need reliable routing, but currency volatility tempers long-horizon infrastructure investment.
- Alphabet Inc.
- HERE Global B.V.
- TomTom International B.V.
- Environmental Systems Research Institute, Inc.
- Mapbox, Inc.
- Apple Inc.
- Maxar Technologies Inc.
- Collins Bartholomew Limited
- Digital Map Products Inc.
- Digital Mapping Solutions Pty Ltd
- DMTI Spatial Inc.
- Lepton Software Export & Research (P) Ltd.
- ThinkGeo LLC
- MapData Services Pty Ltd
- NavInfo Co., Ltd.
- AutoNavi Holdings Limited
- Baidu Inc.
- Nearmap Ltd
- Zenrin Co., Ltd.
- Trimble Inc.
- CartoDB Inc.
- OpenStreetMap Foundation
- MapQuest, Inc.
Additional Benefits:
- The market estimate (ME) sheet in Excel format
- 3 months of analyst support
TABLE OF CONTENTS
1 INTRODUCTION
- 1.1 Study Assumptions and Market Definition
- 1.2 Scope of the Study
2 RESEARCH METHODOLOGY
3 EXECUTIVE SUMMARY
4 MARKET LANDSCAPE
- 4.1 Market Overview
- 4.2 Market Drivers
- 4.2.1 Rapid Uptake of HD Maps for ADAS and Autonomous Vehicles
- 4.2.2 Explosive Growth of Connected-Car OTA Map-Update Ecosystems
- 4.2.3 Mainstream Adoption of Cloud-Native GIS Platforms
- 4.2.4 Smart-City Digital-Twin Programs Scaling Globally
- 4.2.5 Mandatory EU eCall and Next-Gen Road-Safety Regulations
- 4.2.6 Corporate Scope-3 Carbon Mapping Requirements
- 4.3 Market Restraints
- 4.3.1 Escalating Costs of Continuous, Centimetre-Level Map Refresh
- 4.3.2 Heightened Data-Privacy and Localization Statutes (GDPR, PIPL)
- 4.3.3 IP-Licensing Disputes Among Data Providers and OEMs
- 4.3.4 Algorithmic Bias and Liability Concerns in AI-Generated Maps
- 4.4 Industry Value Chain Analysis
- 4.5 Regulatory Landscape
- 4.6 Technological Outlook
- 4.7 Impact of Macroeconomic Factors on the Market
- 4.8 Porter's Five Forces Analysis
- 4.8.1 Threat of New Entrants
- 4.8.2 Bargaining Power of Buyers
- 4.8.3 Bargaining Power of Suppliers
- 4.8.4 Threat of Substitutes
- 4.8.5 Intensity of Competitive Rivalry
5 MARKET SIZE AND GROWTH FORECASTS (VALUE)
- 5.1 By Solution
- 5.1.1 Software
- 5.1.2 Services
- 5.2 By Deployment
- 5.2.1 On-Premise
- 5.2.2 Cloud
- 5.3 By Map Type
- 5.3.1 Navigation Maps
- 5.3.2 HD and Real-Time Maps
- 5.3.3 Topographic and Thematic Maps
- 5.4 By End-Use Industry
- 5.4.1 Automotive
- 5.4.2 Engineering and Construction
- 5.4.3 Telecommunications
- 5.4.4 Public Sector and Defense
- 5.4.5 Retail and Geomarketing
- 5.4.6 Other End-Use Industries
- 5.5 By Geography
- 5.5.1 North America
- 5.5.1.1 United States
- 5.5.1.2 Canada
- 5.5.1.3 Mexico
- 5.5.2 South America
- 5.5.2.1 Brazil
- 5.5.2.2 Argentina
- 5.5.2.3 Rest of South America
- 5.5.3 Europe
- 5.5.3.1 United Kingdom
- 5.5.3.2 Germany
- 5.5.3.3 France
- 5.5.3.4 Italy
- 5.5.3.5 Rest of Europe
- 5.5.4 Asia Pacific
- 5.5.4.1 China
- 5.5.4.2 Japan
- 5.5.4.3 India
- 5.5.4.4 South Korea
- 5.5.4.5 Rest of Asia Pacific
- 5.5.5 Middle East and Africa
- 5.5.5.1 Middle East
- 5.5.5.1.1 United Arab Emirates
- 5.5.5.1.2 Saudi Arabia
- 5.5.5.1.3 Rest of Middle East
- 5.5.5.2 Africa
- 5.5.5.2.1 South Africa
- 5.5.5.2.2 Egypt
- 5.5.5.2.3 Rest of Africa
- 5.5.5.1 Middle East
- 5.5.1 North America
6 COMPETITIVE LANDSCAPE
- 6.1 Market Concentration
- 6.2 Strategic Moves
- 6.3 Market Share Analysis
- 6.4 Company Profiles (includes Global Level Overview, Market Level Overview, Core Segments, Financials as available, Strategic Information, Market Rank/Share, Products and Services, Recent Developments)
- 6.4.1 Alphabet Inc.
- 6.4.2 HERE Global B.V.
- 6.4.3 TomTom International B.V.
- 6.4.4 Environmental Systems Research Institute, Inc.
- 6.4.5 Mapbox, Inc.
- 6.4.6 Apple Inc.
- 6.4.7 Maxar Technologies Inc.
- 6.4.8 Collins Bartholomew Limited
- 6.4.9 Digital Map Products Inc.
- 6.4.10 Digital Mapping Solutions Pty Ltd
- 6.4.11 DMTI Spatial Inc.
- 6.4.12 Lepton Software Export & Research (P) Ltd.
- 6.4.13 ThinkGeo LLC
- 6.4.14 MapData Services Pty Ltd
- 6.4.15 NavInfo Co., Ltd.
- 6.4.16 AutoNavi Holdings Limited
- 6.4.17 Baidu Inc.
- 6.4.18 Nearmap Ltd
- 6.4.19 Zenrin Co., Ltd.
- 6.4.20 Trimble Inc.
- 6.4.21 CartoDB Inc.
- 6.4.22 OpenStreetMap Foundation
- 6.4.23 MapQuest, Inc.
7 MARKET OPPORTUNITIES AND FUTURE OUTLOOK
- 7.1 White-Space and Unmet-Need Assessment


