
|
시장보고서
상품코드
2123283
로봇 소프트웨어 시장 : 시장 점유율 분석, 업계 동향 및 통계, 성장 예측(2026-2031년)Robot Software - Market Share Analysis, Industry Trends & Statistics, Growth Forecasts (2026 - 2031) |
||||||
 Mordor Intelligence
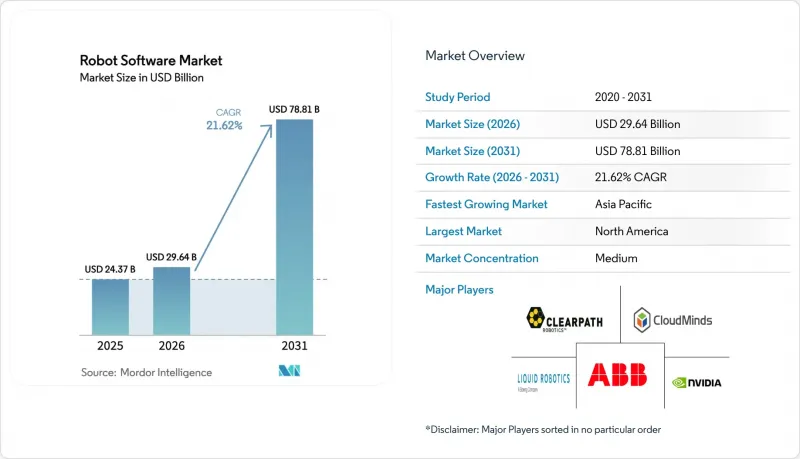
Mordor Intelligence에 의하면, 로봇 소프트웨어 시장 규모는 2025년 243억 7,000만 달러로 평가되었고, 2026년에는 296억 4,000만 달러로 추정되고, 2031년까지 788억 1,000만 달러에 이를 것으로 예측됩니다.
이는 연평균 성장률(CAGR) 21.62%를 나타내는 것으로, 공장, 병원, 창고에서의 지능형 자동화 추세를 뒷받침하고 있습니다.
본 보고서는 소프트웨어 유형별(인식, 시뮬레이션, 예측 유지보수 등), 로봇 유형별(산업용 및 서비스용), 도입 모델별(온프레미스, 클라우드, 온디맨드), 최종 사용자 산업 분야별(자동차, 제조, 의료, 운송 및 물류, 소매 및 전자상거래 등) 및 지역별로 분류되어 있습니다. 시장 전망은 금액(달러) 기준으로 제시되어 있습니다.
세계의 로봇 소프트웨어 시장 동향 및 인사이트
AI와 ML의 통합이 로봇의 능력을 향상시킵니다.
비전·언어·액션 모델은 지각과 제어를 융합하여, 로봇이 자연스러운 명령을 따르고 재학습 없이 낯선 물체에 적응할 수 있도록 합니다. Jetson Thor 모듈은 디바이스에서 2,000 TOPS의 연산 능력을 제공하여 휴머노이드 로봇이 멀티모달 모델을 로컬에서 실행할 수 있게 함으로써, 외과 수술의 정확도를 저해하는 100밀리초의 지연을 방지합니다. Intel RealSense SDK에는 깊이 인식 분할 기능이 추가되었습니다. 이를 통해 협업 로봇은 사람의 손과 가공물을 구별할 수 있게 되어, ISO 10218-2의 힘 및 하중 임계값을 충족합니다. 라벨링된 이미지의 필요량이 줄어들기 때문에 데이터셋 구축 비용이 절감되어 제조업체에 이점을 제공합니다. 그 결과, 1시간 이내에 제품 변종을 전환할 수 있는 유연한 생산 셀의 도입이 가속화됩니다.
증가하는 자동화 및 안전성 요구
노동력의 고령화와 낮은 노동 참여율은 구조적인 현실이며, 일본에서는 2025년에 제조업 근로자 수가 37만 명 부족할 것으로 예측됩니다. 개정된 ISO 10218-1에서는 케이지 없이 사람과 로봇이 공간을 공유할 수 있도록 하는 토크 및 힘 제한이 규정되어 있어, 이로 인해 실시간 충돌 감시를 수행하는 소프트웨어의 복잡성이 증가하고 있습니다. 자율 주행 로봇을 위한 최초의 전용 안전 규격인 UL 3300에서는 이중화된 제동 장치와 0.1m 해상도의 LiDAR 기반 장애물 감지가 의무화되어 있습니다. 인증된 진단 기능 및 감사 로그 기능을 통합한 공급업체는 리콜 비용을 피하고자 하는 위험 회피형 구매자들로부터 지지를 얻고 있습니다. 규정 준수 대응 예산이 부족한 소규모 개발 기업들은 사전에 검증된 스택을 제공하는 플랫폼 파트너로 무게 중심을 옮기고 있습니다.
높은 도입 비용
센서, 네트워크, 통합 비용을 포함하면 셀당 총 소유 비용은 종종 20만 달러를 초과하며, 2025년 조사에 따르면 제조업체의 58%가 이를 가장 큰 장벽으로 꼽았습니다. 이익률이 낮은 중소기업은 규모의 경제를 실현할 수 없어 비용 상각에 어려움을 겪고 있습니다. 로우코드 도구는 프로그래밍 주기를 단축하지만, 하드웨어나 센서 비용은 대체로 가격 탄력성이 낮습니다. 금융 기관은 신용도가 높은 거래 상대방을 요구하기 때문에 신흥 시장에서 리스 이용이 제한되고 있습니다. 금리가 상승세를 보이는 가운데, 현금 흐름에 민감한 기업들은 보조금이나 세액 공제를 통해 초기 비용이 상쇄되지 않는 한 프로젝트를 연기하고 있습니다.
부문 분석
데이터 관리 및 분석 소프트웨어는 2025년 시장 규모의 34.74%를 차지했으며, 이는 사용자가 가동 시간 및 에너지에 대한 인사이트를 얻기 위해 전체 차량군의 텔레메트리 데이터 집계를 중시하고 있음을 보여줍니다. 이 비율은 2025년 로봇 소프트웨어 시장 규모 약 103억 달러에 해당합니다. 진동 및 전류 특성을 분석하는 예측 유지보수 알고리즘을 통해 베어링 고장을 몇 주 전에 예측할 수 있게 되었으며, 조달 부서는 긴급 발주로 인한 할증료를 지불하지 않고도 부품 조달을 계획할 수 있게 되었습니다. OPC UA와 같은 표준화된 인터페이스를 통해 이종 혼합 차량 군에서 데이터를 추출하는 과정이 간소화되는 한편, 트랜스포머 모델은 기존에는 고주파 시계열 데이터 속에 숨어 있던 이상 패턴을 감지합니다. 물류 센터에서는 여러 제조업체의 AMR이 실시간으로 통행권을 조정하는 등 이종 혼합 차량군이 주류를 이루고 있어, 통신 관리 시장은 연평균 성장률(CAGR) 21.98%로 확대되고 있습니다. 2024년에 공개된 VDA 5050은 공통 메시지 분류 체계를 정의함으로써 이러한 급속한 성장을 뒷받침하고 있습니다. 인식 소프트웨어는 트랜스포머 비전과 융합되고 있으며, 로봇이 인간 수준의 감지 정확도를 달성할 수 있게 되었습니다. 시뮬레이션 도구에는 ISO 안전 템플릿이 내장되어 있어 가상 시운전 기간을 단축하고 있습니다. 클라우드와의 왕복 통신이 결정론적 처리 시간 범위를 벗어나기 때문에 가동 시간이 극히 중요한 공장에서는 엣지 추론이 필수적입니다.
제품 전략은 오케스트레이션, 인식, 예측 분석을 통합한 플랫폼 번들로 수렴하고 있습니다. 벤더들은 SaaS 관행에 따라 이러한 제품군을 로봇 1대당 월정액제로 가격을 책정하고 있습니다. 오픈 API를 통해 통합되지 않는 한, 독립형 단일 용도는 소외될 위험이 있습니다. 경쟁이 치열해지는 가운데, 합병을 통해 시뮬레이션 자산과 런타임 엔진을 통합하고 소프트웨어의 전체 수명 주기를 관리하는 데 초점이 맞추어지고 있습니다. 로봇 소프트웨어 시장에서는 데이터 사이언스 배경이 없는 라인 감독자를 위해, 원시 센서 로그를 실용적인 대시보드로 변환하는 제품이 계속해서 높은 평가를 받고 있습니다.
2025년에는 산업용 로봇이 도입 대수의 57.63%를 차지했으며, 이는 당시 로봇 소프트웨어 시장 규모 약 171억 달러에 해당했습니다. 이 점유율은 자동차 산업의 용접, 도장, 배터리 팩 조립 분야에서 확고한 입지를 반영하고 있습니다. 한편, 서비스 로봇은 의료 물류, 접객업, 소매업의 스캔 업무를 원동력으로 연평균 23.1%의 속도로 성장하고 있습니다. 인튜이티브 서지컬(Intuitive Surgical)의 ‘다빈치(da Vinci)’ 플랫폼은 2024년에 200만 건 이상의 수술을 수행하며, 기계 지원에 대한 임상적 수용이 입증되었습니다. 서비스 로봇은 구조화되지 않은 공간을 이동하고, 사회적 신호를 해석하며, GDPR(EU 개인정보보호규정)을 준수해야 합니다. 보스턴 다이내믹스(Boston Dynamics)의 사족 보행 로봇 ‘Spot’은 현재 LiDAR와 스테레오 융합 기술을 활용해 화학 플랜트에서 자율적인 점검을 수행하고 있으며, 이는 지각 기술이 연구실에서 위험한 현장으로 이동하고 있음을 여실히 보여줍니다.
산업용 로봇에는 힘 및 토크 감지 기능이 점점 더 많이 탑재되어, 안전 펜스 없이도 인간과 안전하게 협업할 수 있게 되었습니다. 모듈식 설계로 인해 모션 라이브러리와 태스크 로직이 분리되어 있으므로, 엔지니어는 코어 코드를 수정하지 않고도 엔드 이펙터를 교체할 수 있습니다. 서비스 플랫폼에는 클라우드 기반 언어 모델이 통합되어 호텔 카운터에서 음성 명령을 사용할 수 있게 되었습니다. 유니버설 로보틱스가 URScript 환경을 이동 기반 시스템으로 이식하여, 통합 업체가 단일 IDE 내에서 조작과 내비게이션을 통합할 수 있게 됨에 따라 기술 간의 상호 교류가 두드러지고 있습니다. 로봇 소프트웨어 시장은 추가되는 각 이용 사례가 일회성 판매가 아닌 라이선스나 구독을 통한 증분 수익으로 이어지기 때문에 혜택을 보고 있습니다.
지역별 분석
북미는 2025년에 매출의 38.73%를 차지한 것으로 평가되었으며, 자동차 및 반도체 업계에서의 조기 도입은 물론, MIT와 카네기 멜론 대학을 중심으로 한 풍부한 로봇 공학 인재 풀에 힘입고 있습니다. 수요의 대부분은 미국이 차지하고 있으며, 멕시코에서의 니어쇼어링이 급속히 확대됨에 따라 다품종 혼류 자동화 프로젝트가 유치되고 있습니다. 캐나다는 AI 연구 클러스터를 활용하여 로봇 정책 업데이트를 최적화하는 강화 학습의 상용화를 추진하고 있습니다.
아시아태평양은 2031년까지 연평균 성장률(CAGR)이 22.44%로 가장 빠른 성장세를 보이고 있으며, 2030년까지 100만 대의 휴머노이드 로봇을 도입하겠다는 중국의 계획과, 공장 자동화 설비 투자(CAPEX)의 최대 25%를 지원하는 인도의 보조금 정책이 이를 뒷받침하고 있습니다. 일본은 고령자 돌봄용 서비스 로봇을 통해 인구 동적 변화라는 역풍에 대처하고 있는 반면, 한국은 자동차 산업의 전통과 보스턴 다이내믹스의 모빌리티 관련 노하우를 융합하고 있습니다. 베트남 등 아세안(ASEAN) 국가들은 전자 산업의 이전처로 주목받고 있으며, 소량 생산 제조업체들은 노동력 부족을 보완하기 위해 클라우드 오케스트레이션으로의 전환을 추진하고 있습니다.
유럽의 동향은 가상 검증 및 신속한 패치 적용을 의무화하는 안전·사이버 보안 규제에 의해 형성되고 있으며, 이로 인해 규정 준수 전문 지식을 갖춘 벤더들이 우위를 점하고 있습니다. 독일의 자동차 및 기계 부문은 여전히 도입 대수에서 선두를 달리고 있지만, 이탈리아에서는 중소기업을 위한 정책에 힘입어 로우코드 협업 로봇이 중시되고 있습니다. 영국과 프랑스는 차세대 지각 스택 개발에 기여하는 시뮬레이션 및 AI 연구소에 공공 자금을 투입하고 있습니다. 남미는 여전히 신흥 시장이며, 브라질의 자동차 공장에서는 협업 용접 셀의 시범 운영이 진행되고 있습니다. 중동에서는 아랍에미리트(UAE)의 물류 허브가 항만 및 자유무역지대에서 AMR(자율 이동 로봇) 함대를 운영하고 있습니다. 아프리카에서는 광업 및 농산물 가공 분야에서 초기 시범 프로젝트가 진행되고 있으나, 대역폭 및 자본 제약으로 인해 규모 확대 속도는 둔화되고 있습니다. 각 지역에서 정부 인센티브, 광대역 보급 현황, 보안 체계가 도입 현황과 공급업체의 진입 전략을 좌우하고 있습니다.
기타 혜택 :
- 엑셀 형식 시장 예측(ME) 시트
- 3개월간의 애널리스트 지원
자주 묻는 질문
목차
제1장 서론
제2장 조사 방법
제3장 주요 요약
제4장 시장 구도
제5장 시장 규모 및 성장 예측
제6장 경쟁 구도
제7장 시장 기회 및 향후 전망
AJY 26.09.07According to Mordor Intelligence, the robot software market size is projected to expand from USD 24.37 billion in 2025 to USD 29.64 billion in 2026 and is forecast to reach USD 78.81 billion by 2031, reflecting a 21.62% CAGR, underscoring the momentum behind intelligent automation across factories, hospitals, and warehouses.
This report is Segmented by Software Type (Recognition, Simulation, Predictive Maintenance, and More), Robot Type (Industrial and Service), Deployment Model (On-Premise and Cloud and On-Demand), End-User Vertical (Automotive, Manufacturing, Healthcare, Transportation and Logistics, Retail and E-Commerce, and More), and Geography. The Market Forecasts are Provided in Terms of Value (USD).
Global Robot Software Market Trends and Insights
AI and ML Integration Boosts Robot Capability
Vision language action models now fuse perception and control, allowing robots to follow natural commands and adapt to unseen objects without retraining. The Jetson Thor module provides 2,000 TOPS of on-device compute, enabling humanoid robots to run multimodal models locally and prevent the 100 ms delays that jeopardize surgical precision. Intel RealSense SDK added depth-aware segmentation that lets collaborative robots differentiate a human hand from a workpiece, meeting ISO 10218-2 power-and-force thresholds. Manufacturers benefit because fewer labeled images are required, reducing dataset creation costs. The outcome is faster deployment of flexible cells that can switch product variants within an hour.
Rising Need for Automation and Safety
Aging workforces and low labor participation are structural realities, with Japan reporting a 370,000 manufacturing worker gap in 2025. The updated ISO 10218-1 sets torque and force limits that permit humans and robots to share spaces without cages, thereby increasing software complexity for real-time collision monitoring. UL 3300, the first dedicated safety standard for autonomous mobile robots, mandates redundant braking and lidar-based obstacle detection with a resolution of 0.1 m. Vendors that embed certified diagnostics and audit logging win share as risk-averse buyers aim to avoid recall costs. Smaller developers lacking compliance budgets are pivoting to platform partners for pre-validated stacks.
High Implementation Cost
Total ownership often exceeds USD 200,000 per cell once sensors, networks, and integration are counted, which 58% of manufacturers cited as the biggest hurdle in a 2025 survey. Thin-margin SMEs struggle to amortize expenses because they lack scale. Low-code tools shorten programming cycles, yet hardware and sensor bills are largely inelastic. Finance providers demand creditworthy counterparties, limiting leasing uptake in emerging markets. As interest rates trend higher, cash-flow-sensitive firms delay projects unless subsidies or tax credits offset upfront costs.
Other drivers and restraints analyzed in the detailed report include:
- Robot-as-a-Service Subscription Economics
- EU Safety-Driven ROS Virtualization Mandate (2027)
- Cyber-Security and Malware Threats
For complete list of drivers and restraints, kindly check the Table Of Contents.
Segment Analysis
Data management and analysis software held 34.74% of the 2025 base, demonstrating that users value fleet-wide telemetry aggregation for uptime and energy insights. This slice equated to roughly USD 10.3 billion of the robot software market size in 2025. Predictive maintenance algorithms reading vibration and current signatures now forecast bearing failures weeks ahead, letting procurement plan parts without expedite premiums. Standardized interfaces, such as OPC UA, simplify data extraction from mixed fleets, while transformer models detect anomaly patterns that were previously hidden in high-frequency time series. Communication management is expanding at a 21.98% CAGR because heterogeneous fleets dominate logistics centers where AMRs from several makers negotiate right of way in real time. VDA 5050, released in 2024, underpins this surge by defining a common message taxonomy. Recognition software is converging with transformer vision, enabling robots to achieve human-level detection accuracy. Simulation tools incorporate ISO safety templates, which shorten virtual commissioning. Edge inference is now compulsory in uptime-critical factories because cloud round trips breach deterministic budgets.
Product strategies are coalescing into platform bundles that merge orchestration, recognition, and predictive analytics. Vendors price these suites on a per-robot per-month basis, mirroring SaaS norms. Stand-alone point applications risk marginalization unless they integrate via open APIs. As competitive intensity rises, mergers focus on uniting simulation assets with runtime engines to control the full software lifecycle. The robot software market continues to reward products that convert raw sensor logs into actionable dashboards for line supervisors who lack data-science backgrounds.
Industrial robots owned 57.63% of deployments in 2025, equal to around USD 17.1 billion of robot software market size at that time. The share reflects deep entrenchment in automotive welding, painting, and battery pack assembly. Yet service robots are expanding at 23.1% annually, propelled by healthcare logistics, hospitality, and retail scanning. Intuitive Surgical's da Vinci platform performed more than two million procedures in 2024, validating clinical acceptance of machine assistance. Service robots must navigate unstructured spaces, interpret social cues, and comply with GDPR. Boston Dynamics' Spot quadruped now runs autonomous inspection in chemical plants via lidar and stereo fusion, highlighting how perception stacks migrate from labs to hazardous field sites.
Industrial units increasingly feature force-torque sensing, enabling safe human collaboration without cages. Modular designs decouple motion libraries from task logic so engineers swap end effectors without rewriting core code. Service platforms integrate cloud-based language models to enable voice commands at hotel counters. Cross-pollination is evident as Universal Robots ports its URScript environment to mobile bases, allowing integrators to blend manipulation and navigation within a single IDE. The robot software market benefits because each added use case translates into incremental license or subscription revenue rather than one-off sales.
Complete Report Scope:
- By Software Type
- Recognition Software
- Simulation Software
- Predictive Maintenance Software
- Data Management and Analysis Software
- Communication Management Software
- By Robot Type
- Industrial Robots
- Service Robots
- By Deployment Model
- On-Premise
- Cloud / On-Demand
- By End-user Vertical
- Automotive
- Manufacturing
- Healthcare
- Transportation and Logistics
- Retail and E-commerce
- IT and Telecommunications
- Government and Defense
- BFSI
- Aerospace and Defense
- Media and Entertainment
- Other End-user Verticals
- By Geography
- North America
- United States
- Canada
- Mexico
- South America
- Brazil
- Argentina
- Rest of South America
- Europe
- Germany
- United Kingdom
- France
- Italy
- Spain
- Rest of Europe
- Asia-Pacific
- China
- Japan
- India
- South Korea
- ASEAN
- Rest of Asia-Pacific
- Middle East and Africa
- Middle East
- Saudi Arabia
- United Arab Emirates
- Rest of Middle East
- Africa
- South Africa
- Nigeria
- Rest of Africa
- Middle East
- North America
Geography Analysis
North America held 38.73% revenue in 2025, buoyed by early automotive and semiconductor adoption plus a deep robotics talent pool anchored by MIT and Carnegie Mellon. The United States supplies the bulk of demand, with Mexico's nearshoring boom pulling in high-mix automation projects. Canada leverages AI research clusters to commercialize reinforcement learning that optimizes robot policy updates.
Asia-Pacific is the fastest climber with a 22.44% CAGR through 2031, propelled by China's plan to deploy 1 million humanoid robots by 2030 and India's subsidies covering up to 25% of capex for factory automation. Japan combats demographic headwinds with service robots in eldercare, while South Korea intersects automotive heritage with Boston Dynamics mobility know-how. ASEAN nations such as Vietnam attract electronics relocations, nudging small batch manufacturers toward cloud orchestration to compensate for labor gaps.
Europe's trajectory is shaped by safety and cybersecurity regulations that mandate virtual validation and prompt patching, thereby advantaging vendors with compliance expertise. Germany's automotive and machinery sectors still dominate installations, but Italy's SME-focused schemes favor low-code cobots. The United Kingdom and France channel public funds into simulation and AI labs that inform next-generation perception stacks. South America remains emergent, with Brazilian car plants piloting collaborative welding cells. The Middle East leans on logistics hubs in the United Arab Emirates that run AMR fleets in ports and free zones. Africa sees early pilots in mining and agro-processing, though bandwidth and capital bottlenecks slow scaling. Across regions, public incentives, broadband coverage, and security regimes shape uptake and vendor entry strategies.
- ABB Ltd.
- IBM Corporation
- NVIDIA Corporation
- Brain Corporation
- CloudMinds Technology Inc.
- Clearpath Robotics Inc.
- Liquid Robotics, Inc.
- AIBrain Inc.
- Furhat Robotics AB
- Neurala Inc.
- Energid Technologies Corporation
- H2O.ai Inc.
- Oxbotica Ltd.
- Anscer Robotics Pvt. Ltd.
- Quale Infotech Pvt. Ltd.
- Universal Robots A/S
- FANUC Corporation
- KUKA Aktiengesellschaft
- Yaskawa Electric Corporation
- Boston Dynamics Inc.
- Microsoft Corporation
- Amazon Web Services Inc.
Additional Benefits:
- The market estimate (ME) sheet in Excel format
- 3 months of analyst support
TABLE OF CONTENTS
1 INTRODUCTION
- 1.1 Study Assumptions and Market Definition
- 1.2 Scope of the Study
2 RESEARCH METHODOLOGY
3 EXECUTIVE SUMMARY
4 MARKET LANDSCAPE
- 4.1 Market Overview
- 4.2 Market Drivers
- 4.2.1 Rising Need for Automation and Safety
- 4.2.2 Rapid SME Adoption to Cut Labor / Energy Cost
- 4.2.3 AI/ML Integration Boosts Robot Capability
- 4.2.4 Low-/no-code Robot-app Platforms Expand Adoption
- 4.2.5 EU Safety-driven ROS Virtualization Mandate (2027)
- 4.2.6 Robot-as-a-Service Subscription Economics
- 4.3 Market Restraints
- 4.3.1 High Implementation Cost
- 4.3.2 Cyber-security and Malware Threats
- 4.3.3 Shortage of Safety-Certified Software Engineers
- 4.3.4 Vendor Lock-in from Proprietary OS Stacks
- 4.4 Industry Value Chain Analysis
- 4.5 Regulatory Landscape
- 4.6 Technological Outlook
- 4.7 Porter's Five Forces Analysis
- 4.7.1 Bargaining Power of Suppliers
- 4.7.2 Bargaining Power of Consumers
- 4.7.3 Threat of New Entrants
- 4.7.4 Threat of Substitutes
- 4.7.5 Intensity of Competitive Rivalry
- 4.8 Assessment of Macroeconomic Factors on the Market
- 4.9 Investment Analysis
5 MARKET SIZE AND GROWTH FORECASTS (VALUE)
- 5.1 By Software Type
- 5.1.1 Recognition Software
- 5.1.2 Simulation Software
- 5.1.3 Predictive Maintenance Software
- 5.1.4 Data Management and Analysis Software
- 5.1.5 Communication Management Software
- 5.2 By Robot Type
- 5.2.1 Industrial Robots
- 5.2.2 Service Robots
- 5.3 By Deployment Model
- 5.3.1 On-Premise
- 5.3.2 Cloud / On-Demand
- 5.4 By End-user Vertical
- 5.4.1 Automotive
- 5.4.2 Manufacturing
- 5.4.3 Healthcare
- 5.4.4 Transportation and Logistics
- 5.4.5 Retail and E-commerce
- 5.4.6 IT and Telecommunications
- 5.4.7 Government and Defense
- 5.4.8 BFSI
- 5.4.9 Aerospace and Defense
- 5.4.10 Media and Entertainment
- 5.4.11 Other End-user Verticals
- 5.5 By Geography
- 5.5.1 North America
- 5.5.1.1 United States
- 5.5.1.2 Canada
- 5.5.1.3 Mexico
- 5.5.2 South America
- 5.5.2.1 Brazil
- 5.5.2.2 Argentina
- 5.5.2.3 Rest of South America
- 5.5.3 Europe
- 5.5.3.1 Germany
- 5.5.3.2 United Kingdom
- 5.5.3.3 France
- 5.5.3.4 Italy
- 5.5.3.5 Spain
- 5.5.3.6 Rest of Europe
- 5.5.4 Asia-Pacific
- 5.5.4.1 China
- 5.5.4.2 Japan
- 5.5.4.3 India
- 5.5.4.4 South Korea
- 5.5.4.5 ASEAN
- 5.5.4.6 Rest of Asia-Pacific
- 5.5.5 Middle East and Africa
- 5.5.5.1 Middle East
- 5.5.5.1.1 Saudi Arabia
- 5.5.5.1.2 United Arab Emirates
- 5.5.5.1.3 Rest of Middle East
- 5.5.5.2 Africa
- 5.5.5.2.1 South Africa
- 5.5.5.2.2 Nigeria
- 5.5.5.2.3 Rest of Africa
- 5.5.5.1 Middle East
- 5.5.1 North America
6 COMPETITIVE LANDSCAPE
- 6.1 Market Concentration
- 6.2 Strategic Moves
- 6.3 Market Share Analysis
- 6.4 Company Profiles (includes Global level Overview, Market level overview, Core Segments, Financials as available, Strategic Information, Market Rank/Share for key companies, Products and Services, and Recent Developments)
- 6.4.1 ABB Ltd.
- 6.4.2 IBM Corporation
- 6.4.3 NVIDIA Corporation
- 6.4.4 Brain Corporation
- 6.4.5 CloudMinds Technology Inc.
- 6.4.6 Clearpath Robotics Inc.
- 6.4.7 Liquid Robotics, Inc.
- 6.4.8 AIBrain Inc.
- 6.4.9 Furhat Robotics AB
- 6.4.10 Neurala Inc.
- 6.4.11 Energid Technologies Corporation
- 6.4.12 H2O.ai Inc.
- 6.4.13 Oxbotica Ltd.
- 6.4.14 Anscer Robotics Pvt. Ltd.
- 6.4.15 Quale Infotech Pvt. Ltd.
- 6.4.16 Universal Robots A/S
- 6.4.17 FANUC Corporation
- 6.4.18 KUKA Aktiengesellschaft
- 6.4.19 Yaskawa Electric Corporation
- 6.4.20 Boston Dynamics Inc.
- 6.4.21 Microsoft Corporation
- 6.4.22 Amazon Web Services Inc.
7 MARKET OPPORTUNITIES AND FUTURE OUTLOOK
- 7.1 White-space and Unmet-need Assessment