|
시장보고서
상품코드
2123290
애플리케이션 컨테이너 시장 : 점유율 분석, 업계 동향과 통계, 성장 예측(2026-2031년)Application Container - Market Share Analysis, Industry Trends & Statistics, Growth Forecasts (2026 - 2031) |
||||||
 Mordor Intelligence
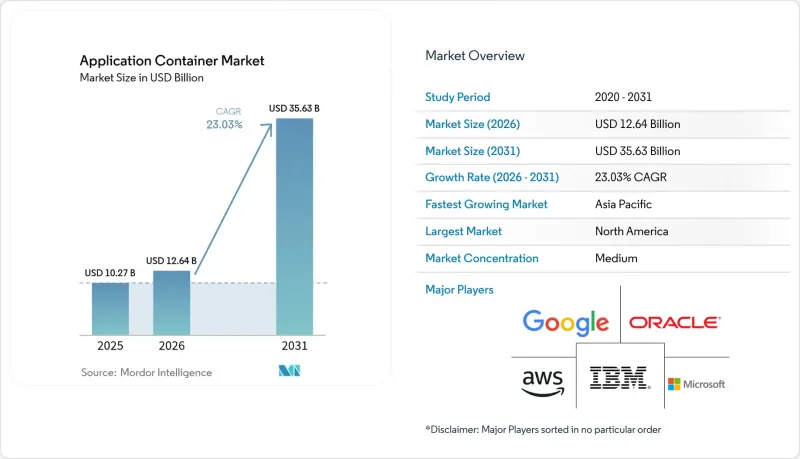
애플리케이션 컨테이너 시장 규모는 2025년 102억 7,000만 달러에서 2026년에는 126억 4,000만 달러로 확대되어 2026년부터 2031년까지 CAGR 23.03%로 성장을 지속하여, 2031년에는 356억 3,000만 달러에 이를 것으로 예측됩니다.
본 보고서는 구성 요소(플랫폼 및 서비스), 도입 모델(퍼블릭 클라우드, 프라이빗 클라우드 등), 조직 규모(대기업 및 중소기업), 업종(의료, 제조 등), 컨테이너 활용 분야(모니터링, 보안, 네트워크, 스토리지 등), 그리고 지역별로 분류되어 있습니다. 시장 예측은 금액(달러) 기준으로 제시되어 있습니다.
세계 애플리케이션 컨테이너 시장 동향 및 인사이트
마이크로서비스 아키텍처 도입 가속화
모놀리식 아키텍처에서 마이크로서비스로의 전환이 가속화되고 있습니다. 이는 기업이 개별 기능을 독립적으로 확장하고, 릴리스 주기를 단축하며, 장애 발생 시 영향 범위를 축소할 수 있기 때문입니다. Docker의 2024년 조사에 따르면, 컨테이너화된 서비스의 도입은 모놀리식 스택에 비해 40% 더 빠른 것으로 나타났습니다. JPMorgan Chase를 비롯한 주요 금융 기관들은 시장 변동이 심한 상황에서 회복력을 높이기 위해 거래 및 리스크 관리 시스템의 60% 이상을 컨테이너화했습니다. 소매 플랫폼에서는 비용을 절감하면서도 플래시 세일 시의 트래픽에 대응하기 위해 자동 확장 기능을 갖춘 마이크로서비스가 활용되고 있습니다. 서비스 메시의 무분별한 확대나 분산 추적의 오버헤드가 복잡성을 초래하는 반면, 생산성 향상은 애플리케이션 컨테이너 시장의 급속한 성장을 계속해서 뒷받침하고 있습니다.
하이브리드 및 멀티 클라우드 민첩성에 대한 수요
GDPR(EU 개인정보보호규정) 및 중국의 ‘데이터 보안법’과 같은 데이터 소재지 관련 법률로 인해, 2025년에는 다국적 기업의 58%가 워크로드를 여러 클라우드로 분산할 수밖에 없게 되었습니다. 컨테이너는 코드를 재작성할 필요 없이 AWS EKS, Google GKE, Azure AKS에서 실행되는 일관된 런타임을 제공하여, 기업이 벤더 종속성을 피할 수 있는 수단이 됩니다. 레드햇은 OpenShift 고객들이 현재 배포 1회당 평균 2.7개의 클라우드 공급자를 이용하고 있다고 밝혔습니다. 이종 혼합 환경 전반에 걸쳐 ID 관리와 가시성을 조화시키는 운영상의 부담은 결코 사소하지 않지만, 주권에 관한 규제 요건을 충족해야 하는 전략적 필요성이 컨테이너 플랫폼에 대한 투자를 촉진하고 애플리케이션 컨테이너 시장을 강화하고 있습니다.
컨테이너의 보안 취약점 및 설정 오류
CISA가 2025년 1월에 발표한 보안 강화 가이드에 따르면, 컨테이너 관련 침해 사고의 67%는 RBAC 설정 오류, API 노출 또는 오래된 이미지에서 기인한 것으로 나타났습니다. National Vulnerability Database(NVD)에는 2024년에 342건의 컨테이너 관련 CVE가 등록되어 전년 대비 28% 증가했습니다. Unit 42의 조사에 따르면, 설정 오류가 있는 클러스터를 대상으로 한 암호화폐 채굴 공격 시도가 하루 평균 1,200건 확인되었습니다. 규제 당국은 현재 런타임 위협 감지 및 사고 대응에 대한 증명을 의무화하고 있으며, 이로 인해 규정 준수 관련 비용이 증가하는 한편, 애플리케이션 컨테이너 시장의 구매 기준도 엄격해지고 있습니다.
부문 분석
플랫폼 솔루션은 2025년 애플리케이션 컨테이너 시장 점유율의 56.74%를 차지하며, 이는 라이선스가 부여된 런타임, 레지스트리 및 번들된 오케스트레이션 제품군에 대한 초기 선호도를 뒷받침합니다. 서비스 부문은 연평균 성장률(CAGR) 23.41%로 확대될 것으로 예측됩니다. 이는 기업들이 분기별 Kubernetes 릴리스, 멀티 클러스터 거버넌스, 그리고 격화되는 규정 준수 심사에 제대로 대응하지 못하고 있어, 외부 전문 지식에 대한 대가를 지불하려는 의향이 높아지고 있기 때문입니다. 따라서 서비스 기반 애플리케이션 컨테이너 시장은 구매자들이 기능의 균등성보다 운영상의 복원력을 우선시하는 경향이 있기 때문에 플랫폼 매출을 상회하는 성장을 보일 것으로 예측됩니다. IBM의 컨테이너 자문 매출은 2025년에 45% 증가했으며, 이는 주요 은행 및 보험사들이 인력 부족에 시달리는 시스템 관리자를 고용하는 것보다 관리형 업그레이드가 비용 효율적이라고 판단하고 있음을 보여줍니다. 각 벤더는 현재 AI를 활용한 리소스 튜닝을 서비스 계약에 포함하고 있으며, 이를 통해 문제 해결 주기가 단축되고 비용 배분의 정확도가 향상되고 있습니다.
매니지드 서비스 제공업체는 연중무휴 24시간 사고 대응, SBOM 자동화, 재해 복구 훈련도 패키지로 제공하고 있으며, 이는 대부분의 사내 플랫폼 팀이 상시 인력을 배치할 수 없는 분야입니다. 소규모 툴 벤더들은 클릭 한 번으로 조작할 수 있는 콘솔을 통해 중견 시장의 요구를 충족시키고 있지만, 규제 산업에서 요구하는 인증이나 보상 제도가 부족한 경우가 많습니다. 전 세계의 시스템 통합사업자들은 멀티 클라우드 랜딩 존, GitOps 파이프라인, FinOps의 차지백 장부를 통합함으로써 이러한 격차를 메우고 있습니다. 기술 인력 부족은 2028년까지 해소될 기미가 보이지 않으므로, 정기적인 서비스 지출은 애플리케이션 컨테이너 시장의 견고한 버팀목으로 남아 있을 것입니다. 시간이 지남에 따라 플랫폼 코드는 상품화될 것이지만, 신뢰할 수 있는 운영 노하우가 서비스의 수익성을 건전하게 유지해 줄 것입니다.
2025년 매출 중 퍼블릭 클라우드가 71.34%를 차지했습니다. 이는 매니지드 쿠버네티스가 컨트롤 플레인의 복잡한 작업을 해소하고, 네이티브 로드 밸런서, IAM, 오브젝트 스토리지와 원활하게 연동되었기 때문입니다. 그러나 데이터 거주지에 관한 법률과 지연 시간 목표에 따라 기업들은 클러스터를 사용자나 규제 대상 데이터 세트 근처에 배치할 수밖에 없게 되었기 때문에 하이브리드 및 멀티 클라우드 환경은 연평균 성장률(CAGR) 23.67%로 확대될 것으로 예측됩니다. 페더레이션 프레임워크를 통해 코드를 재작성하지 않고도 On-Premise 랙이나 여러 하이퍼스케일러에 걸쳐 포드를 스케줄링할 수 있게 됨에 따라, 하이브리드 배포용 애플리케이션 컨테이너 시장 규모는 급속히 확대되고 있습니다. 유럽 데이터법 및 인도, 인도네시아의 유사한 법규는 소비자 데이터의 국내 처리를 의무화함으로써 이러한 추세를 더욱 강화하고 있습니다.
통신 사업자들은 이미 5G 코어 기능을 프라이빗 클라우드 간에 분산시켜 10밀리초 미만의 지연 시간을 실현하는 동시에, 분석 워크로드를 저비용 퍼블릭 리전으로 오프로드함으로써 다른 업계가 따를 수 있는 참조 아키텍처를 구축하고 있습니다. 중국 기업들은 2025년에 하이브리드 쿠버네티스(Kubernetes) 이용률을 80%로 끌어올려, 소버린 클라우드와 공장 및 지점에 위치한 엣지 노드를 융합했습니다. 네트워크 정책, 서비스 메쉬 인증서, 감사 로그를 클러스터 간에 일관되게 유지해야 하기 때문에 일관성을 확보하는 것은 여전히 어렵지만, 새로운 정책 엔진과 메쉬 페더레이션 도구를 통해 이러한 마찰은 점차 완화되고 있습니다. 거버넌스 프레임워크가 확립됨에 따라 하이브리드 배포는 더 이상 드문 현상으로 간주되지 않을 것이며, 오히려 컨테이너 도입 과정에서 당연한 단계가 될 것입니다. 이러한 변화로 인해 단일 공급업체에 대한 종속에서 벗어나 수익원이 다양화되고, 이식성을 실현할 수 있는 벤더 전반에 걸쳐 성장이 분산될 것입니다.
지역별 분석
북미는 금융 서비스, 연방 정부 기관, 디지털 네이티브 기술 기업에서의 쿠버네티스 조기 도입의 혜택을 받아 2025년 애플리케이션 컨테이너 시장 점유율 41.22%를 유지했습니다. 이 지역의 하이퍼스케일러들은 관리형 컨트롤 플레인에서 신속하게 반복 작업을 수행하여 가치 실현까지의 시간을 단축하는 동시에 고객 유지율을 높이고 있습니다. CISA, NIST 및 연방 위험 및 승인 관리 프로그램(FedRAMP)은 컨테이너 보안 강화에 관한 규범적 지침을 발표했으며, 이를 통해 위험 관리 담당자는 클라우드 네이티브 도입을 자신 있게 승인할 수 있게 되었습니다. 또한, 주 차원의 데이터 상주법을 충족하는 로컬 주권 클라우드 리전 이용이 가능해짐에 따라 구매가 가속화되고 있습니다. 이러한 이점에도 불구하고, 레거시 미들웨어 벤더의 CPU 기반 라이선싱 모델에 따른 비용 압박은 노드 통합을 저해하고 있으며, 일부 기업들은 오픈소스 대체 솔루션으로의 전환을 촉진하고 있습니다.
아시아태평양은 2031년까지 연평균 성장률(CAGR) 24.07%로 지역별 가장 빠른 성장이 예상되며, 이 지역의 애플리케이션 컨테이너 시장 규모는 다른 어떤 지역보다 훨씬 빠른 속도로 확대될 전망입니다. 중국의 ‘데이터 보안법’ 및 ‘동쪽에는 데이터, 서쪽에는 컴퓨팅’ 프로그램은 기밀 데이터를 그레이트 파이어월 내부에 보관하면서 분석 처리를 내륙의 메가 센터로 오프로드하는 듀얼 클러스터 아키텍처를 추진하고 있습니다. 인도의 디지털 공공 인프라, 특히 2025년 12월에 134억 건의 거래를 처리한 ‘통합 결제 인터페이스(UPI)’는 컨테이너화된 마이크로서비스에 의존하여 1초 미만의 결제 처리라는 목표를 달성하고 있습니다. 일본의 제조업체들은 스마트 팩토리의 게이트웨이에 매니지드 쿠버네티스를 통합하고 있는 반면, 호주의 은행들은 재해 복구를 위한 격리를 목적으로 멀티클라우드를 채택하고 있습니다. 인력 부족은 여전히 지속되고 있지만, 정부 자금 지원 재교육 프로그램과 벤더가 주최하는 교육 아카데미를 통해 기술 격차는 점차 줄어들고 있습니다.
유럽의 동향은 일반 데이터 보호 규정(GDPR(EU 개인정보보호규정)) 및 2024년 데이터법에 의해 형성되고 있으며, 이 두 가지 모두 개인 데이터를 EU 역내에 보관하는 하이브리드 아키텍처에 대한 수요를 높이고 있습니다. 독일의 BaFin은 현재 은행들에게 실제 환경에서의 페일오버 훈련을 통해 컨테이너화된 워크로드의 내결함성을 입증할 것을 요구하고 있으며, 이에 따라 플랫폼에 대한 투자가 가속화되고 있습니다. 프랑스와 북유럽 국가들은 미국 하이퍼스케일러에 대한 의존도를 제한하기 위해 자국 주도의 오픈소스 스택을 추진하는 한편, 영국은 간소화된 규제 샌드박스를 통해 핀테크 기업 유치를 도모하고 있습니다. 남미, 중동 및 아프리카는 아직 발전 단계에 있지만 활기가 넘칩니다. 브라질의 즉시 결제 네트워크와 아랍에미리트(UAE)의 스마트 시티 프로젝트는 모두 자원이 제한된 엣지 노드에 배포 가능한 경량 런타임에 의존하고 있습니다. 현지 클라우드 리전이 제한적이라는 점과 데이터 전송 비용이 높다는 점이 도입의 걸림돌이 되고 있지만, 5G 보급률 상승과 새로운 디지털 이니셔티브는 장기적으로 꾸준한 성장 가능성을 시사하고 있습니다.
기타 혜택:
- 엑셀 형식 시장 예측(ME) 시트
- 3개월간의 애널리스트 지원
자주 묻는 질문
목차
제1장 서론
제2장 조사 방법
제3장 주요 요약
제4장 시장 구도
제5장 시장 규모와 성장 예측
제6장 경쟁 구도
제7장 시장 기회와 향후 전망
JHS 26.09.09According to Mordor Intelligence, the application container market size is expected to grow from USD 10.27 billion in 2025 to USD 12.64 billion in 2026 and is forecast to reach USD 35.63 billion by 2031 at a 23.03% CAGR over 2026-2031.
This report is Segmented by Component (Platform, and Services), Deployment Model (Public Cloud, Private Cloud, and More), Organization Size (Large Enterprises, and Small and Medium Enterprises), Industry Vertical (Healthcare, Manufacturing, and More), Container Use-Case Area (Monitoring, Security, Networking, Storage, and More), and Geography. The Market Forecasts are Provided in Terms of Value (USD).
Global Application Container Market Trends and Insights
Accelerating Adoption of Microservices Architecture
The shift from monoliths to microservices is accelerating because enterprises can scale individual functions independently, shorten release cycles, and reduce blast radius during outages. Docker's 2024 study found that containerized services are deployed 40% faster than monolithic stacks. Large financial institutions, including JPMorgan Chase, containerized more than 60% of trading and risk systems to improve resilience during volatile market events. Retail platforms use auto-scaling microservices to handle flash-sale traffic while keeping costs in check. Although service mesh sprawl and distributed tracing overhead introduce complexity, the productivity upside keeps the application container market on a steep growth trajectory.
Demand for Hybrid and Multi-Cloud Agility
Data residency laws such as GDPR and China's Data Security Law forced 58% of multinational firms to split workloads across multiple clouds in 2025. Containers offer a consistent runtime that runs on AWS EKS, Google GKE, and Azure AKS without code rewrites, giving enterprises a way to avoid vendor lock-in. Red Hat disclosed that OpenShift customers now span an average of 2.7 cloud providers per deployment. The operational burden of harmonizing identity management and observability across heterogeneous estates is non-trivial, yet the strategic need to meet sovereignty mandates catalyzes spending on container platforms, strengthening the application container market.
Container Security Vulnerabilities and Misconfigurations
CISA's January 2025 hardening guide attributed 67% of container breaches to misconfigured RBAC, exposed APIs, or stale images. The National Vulnerability Database logged 342 container CVEs in 2024, up 28% year on year. Unit 42 observed 1,200 daily attempts at cryptomining against misconfigured clusters. Regulators now require runtime threat detection and incident response attestations, adding compliance spend but also tightening buying criteria in the application container market.
Other drivers and restraints analyzed in the detailed report include:
- Surge in DevOps and CI/CD Pipelines
- Need for Resource Optimization and Cost Efficiency
- Complexity of Large-Scale Orchestration
For complete list of drivers and restraints, kindly check the Table Of Contents.
Segment Analysis
Platform solutions captured 56.74% of the 2025 application container market share, underscoring the early preference for licensed runtimes, registries, and bundled orchestration suites. Services are forecast to expand at a 23.41% CAGR because enterprises struggle to keep pace with quarterly Kubernetes releases, multi-cluster governance, and escalating compliance reviews, leading them to be willing to pay for outside expertise. The application container market, attributable to services, is therefore positioned to outgrow platform revenue as buyers prioritize operational resilience over feature parity. IBM's container advisory revenues grew 45% in 2025, showing that large banks and insurers view managed upgrades as cheaper than hiring scarce administrators. Vendors now embed AI-driven resource tuning into service contracts, shortening troubleshooting cycles and improving cost allocation accuracy.
Managed service providers also bundle 24x7 incident response, SBOM automation, and disaster-recovery drills that most internal platform teams cannot staff continuously. Smaller tools vendors answer mid-market needs with click-driven consoles, yet they often lack the certifications and indemnities sought by regulated industries. Global systems integrators fill that gap, stitching together multicloud landing zones, GitOps pipelines, and FinOps chargeback ledgers. Skills shortages are unlikely to ease before 2028, so recurring services spend should remain a durable pillar of the application container market. Over time, platform code will commoditize, but trusted operational expertise will keep service margins healthy.
Public cloud accounted for 71.34% of 2025 revenue because managed Kubernetes eliminated control-plane toil and paired seamlessly with native load balancers, IAM, and object storage. Hybrid and multi-cloud estates, however, are projected to climb at a 23.67% CAGR as data-residency laws and latency targets force enterprises to place clusters near users or regulated datasets. The application container market size for hybrid deployments is growing rapidly, as federation frameworks now let teams schedule pods across on-prem racks and multiple hyperscalers without code rewrites. The European Data Act and similar statutes in India and Indonesia heighten this trend by mandating in-country processing for consumer data.
Telecommunications operators have already split 5G core functions across private clouds to achieve sub-10-millisecond latency while shipping analytics workloads to inexpensive public regions, creating reference architectures that other industries follow. Chinese enterprises lifted hybrid Kubernetes usage by 80% in 2025, blending sovereign clouds with edge nodes in factories and branch offices. Consistency remains hard because network policies, service-mesh certificates, and audit logs must align across clusters, yet new policy engines and mesh federation tools are easing that friction. As governance frameworks solidify, hybrid rollouts will no longer be seen as exotic; rather, they will become an expected stage in the container adoption journey. The shift diversifies revenue away from single-provider lock-in, spreading growth across vendors that can power portability.
Complete Report Scope:
- By Component
- Platform
- Services
- By Deployment Model
- Public Cloud
- Private Cloud
- Hybrid and Multi-Cloud
- By Organization Size
- Large Enterprises
- Small and Medium Enterprises
- By Industry Vertical
- IT and Telecom
- BFSI
- Healthcare
- Retail and e-Commerce
- Manufacturing
- Government and Public Sector
- By Container Use-Case Area
- Management and Orchestration
- Monitoring
- DevOps Tool-chain
- Security
- Networking
- Storage
- By Geography
- North America
- United States
- Canada
- Mexico
- South America
- Brazil
- Argentina
- Rest of South America
- Europe
- United Kingdom
- Germany
- France
- Italy
- Rest of Europe
- Asia Pacific
- China
- Japan
- India
- South Korea
- Rest of Asia Pacific
- Middle East and Africa
- Middle East
- United Arab Emirates
- Saudi Arabia
- Rest of Middle East
- Africa
- South Africa
- Egypt
- Rest of Africa
- Middle East
- North America
Geography Analysis
North America retained 41.22% of the 2025 container application market share, benefiting from early Kubernetes adoption across financial services, federal agencies, and digital-native technology firms. Regional hyperscalers iterate rapidly on managed control planes, shortening time-to-value and reinforcing customer stickiness. CISA, NIST, and the Federal Risk and Authorization Management Program have published prescriptive guidance on container hardening, giving risk officers the confidence to approve cloud-native rollouts. Accelerated purchasing has also been fueled by the availability of local sovereign cloud regions that satisfy state-level data residency laws. Despite this lead, cost pressures tied to CPU-based licensing models from legacy middleware suppliers temper node densification and motivate some enterprises to migrate to open-source alternatives.
Asia-Pacific is projected to generate the fastest regional growth at a 24.07% CAGR through 2031, lifting the region's application container market size far more quickly than any other geography. China's Data Security Law and "Eastern-Data, Western-Compute" program are driving dual-cluster architectures that keep sensitive data behind the Great Firewall while offloading analytics to inland megacenters. India's digital public infrastructure, particularly the Unified Payments Interface, which processed 13.4 billion transactions in December 2025, relies on containerized microservices to achieve sub-second settlement targets. Japan's manufacturers embed managed Kubernetes on smart-factory gateways, while Australia's banks adopt multi-cloud for disaster-recovery separation. Talent shortages persist, yet government-funded reskilling programs and vendor-hosted training academies are narrowing the skills gap.
Europe's trajectory is shaped by the General Data Protection Regulation and the 2024 Data Act, both of which amplify demand for hybrid architectures that keep personal data inside EU borders. Germany's BaFin now requires banks to demonstrate containerized workload resilience through live failover drills, accelerating platform investments. France and the Nordics promote sovereign open-source stacks to limit dependence on U.S. hyperscalers, while the United Kingdom courts fintechs with simplified regulatory sandboxes. South America and the Middle East, and Africa remain nascent but vibrant; Brazil's instant-payments network and the United Arab Emirates' smart-city projects both rely on lightweight runtimes deployable on resource-constrained edge nodes. Limited local cloud regions and high data-egress fees slow adoption, yet rising 5G penetration and green-field digital initiatives point to steady long-term upside.
- Red Hat, Inc.
- Mirantis, Inc.
- VMware, Inc.
- SUSE SE
- Canonical Ltd.
- Docker, Inc.
- Amazon Web Services, Inc.
- Google LLC
- Microsoft Corporation
- Oracle Corporation
- IBM Corporation
- Rancher Labs, Inc.
- Alibaba Cloud Computing Co., Ltd.
- Hewlett Packard Enterprise Company
- Cisco Systems, Inc.
- Palo Alto Networks, Inc.
- Portainer Ltd.
- Heroku LLC
- NetApp, Inc.
- HashiCorp, Inc.
- Sysdig, Inc.
- Pure Storage, Inc.
Additional Benefits:
- The market estimate (ME) sheet in Excel format
- 3 months of analyst support
TABLE OF CONTENTS
1 INTRODUCTION
- 1.1 Study Assumptions and Market Definition
- 1.2 Scope of the Study
2 RESEARCH METHODOLOGY
3 EXECUTIVE SUMMARY
4 MARKET LANDSCAPE
- 4.1 Market Overview
- 4.2 Market Drivers
- 4.2.1 Accelerating Adoption of Microservices Architecture
- 4.2.2 Demand for Hybrid and Multi-cloud Agility
- 4.2.3 Surge in DevOps and CI/CD Pipelines
- 4.2.4 Need for Resource Optimization and Cost Efficiency
- 4.2.5 Edge-native AI Workloads Needing Lightweight Runtimes
- 4.2.6 Confidential Computing Requirements Favor Containerized Secure Enclaves
- 4.3 Market Restraints
- 4.3.1 Container Security Vulnerabilities and Misconfigurations
- 4.3.2 Complexity of Large-scale Orchestration
- 4.3.3 Rising SBOM Compliance Overhead for Open-source Containers
- 4.3.4 CPU-based Licensing Models Penalizing High-density Containers
- 4.4 Industry Value Chain Analysis
- 4.5 Regulatory Landscape
- 4.6 Technological Outlook
- 4.7 Porter's Five Forces Analysis
- 4.7.1 Bargaining Power of Suppliers
- 4.7.2 Bargaining Power of Buyers
- 4.7.3 Threat of New Entrants
- 4.7.4 Threat of Substitutes
- 4.7.5 Competitive Rivalry
- 4.8 Impact of Macroeconomic Factors on the Market
- 4.9 Industry Ecosystem Analysis
- 4.10 Key Use Cases and Case Studies
- 4.11 Investment Analysis
5 MARKET SIZE AND GROWTH FORECASTS (VALUE)
- 5.1 By Component
- 5.1.1 Platform
- 5.1.2 Services
- 5.2 By Deployment Model
- 5.2.1 Public Cloud
- 5.2.2 Private Cloud
- 5.2.3 Hybrid and Multi-Cloud
- 5.3 By Organization Size
- 5.3.1 Large Enterprises
- 5.3.2 Small and Medium Enterprises
- 5.4 By Industry Vertical
- 5.4.1 IT and Telecom
- 5.4.2 BFSI
- 5.4.3 Healthcare
- 5.4.4 Retail and e-Commerce
- 5.4.5 Manufacturing
- 5.4.6 Government and Public Sector
- 5.5 By Container Use-Case Area
- 5.5.1 Management and Orchestration
- 5.5.2 Monitoring
- 5.5.3 DevOps Tool-chain
- 5.5.4 Security
- 5.5.5 Networking
- 5.5.6 Storage
- 5.6 By Geography
- 5.6.1 North America
- 5.6.1.1 United States
- 5.6.1.2 Canada
- 5.6.1.3 Mexico
- 5.6.2 South America
- 5.6.2.1 Brazil
- 5.6.2.2 Argentina
- 5.6.2.3 Rest of South America
- 5.6.3 Europe
- 5.6.3.1 United Kingdom
- 5.6.3.2 Germany
- 5.6.3.3 France
- 5.6.3.4 Italy
- 5.6.3.5 Rest of Europe
- 5.6.4 Asia Pacific
- 5.6.4.1 China
- 5.6.4.2 Japan
- 5.6.4.3 India
- 5.6.4.4 South Korea
- 5.6.4.5 Rest of Asia Pacific
- 5.6.5 Middle East and Africa
- 5.6.5.1 Middle East
- 5.6.5.1.1 United Arab Emirates
- 5.6.5.1.2 Saudi Arabia
- 5.6.5.1.3 Rest of Middle East
- 5.6.5.2 Africa
- 5.6.5.2.1 South Africa
- 5.6.5.2.2 Egypt
- 5.6.5.2.3 Rest of Africa
- 5.6.5.1 Middle East
- 5.6.1 North America
6 COMPETITIVE LANDSCAPE
- 6.1 Market Concentration
- 6.2 Strategic Moves
- 6.3 Market Share Analysis
- 6.4 Company Profiles (includes Global Level Overview, Market Level Overview, Core Segments, Financials as available, Strategic Information, Market Rank/Share, Products and Services, Recent Developments)
- 6.4.1 Red Hat, Inc.
- 6.4.2 Mirantis, Inc.
- 6.4.3 VMware, Inc.
- 6.4.4 SUSE SE
- 6.4.5 Canonical Ltd.
- 6.4.6 Docker, Inc.
- 6.4.7 Amazon Web Services, Inc.
- 6.4.8 Google LLC
- 6.4.9 Microsoft Corporation
- 6.4.10 Oracle Corporation
- 6.4.11 IBM Corporation
- 6.4.12 Rancher Labs, Inc.
- 6.4.13 Alibaba Cloud Computing Co., Ltd.
- 6.4.14 Hewlett Packard Enterprise Company
- 6.4.15 Cisco Systems, Inc.
- 6.4.16 Palo Alto Networks, Inc.
- 6.4.17 Portainer Ltd.
- 6.4.18 Heroku LLC
- 6.4.19 NetApp, Inc.
- 6.4.20 HashiCorp, Inc.
- 6.4.21 Sysdig, Inc.
- 6.4.22 Pure Storage, Inc.
7 MARKET OPPORTUNITIES AND FUTURE OUTLOOK
- 7.1 White-space and Unmet-Need Assessment