
|
시장보고서
상품코드
2123293
커넥티드 물류 시장 : 점유율 분석, 업계 동향과 통계, 성장 예측(2026-2031년)Connected Logistics - Market Share Analysis, Industry Trends & Statistics, Growth Forecasts (2026 - 2031) |
||||||
 Mordor Intelligence
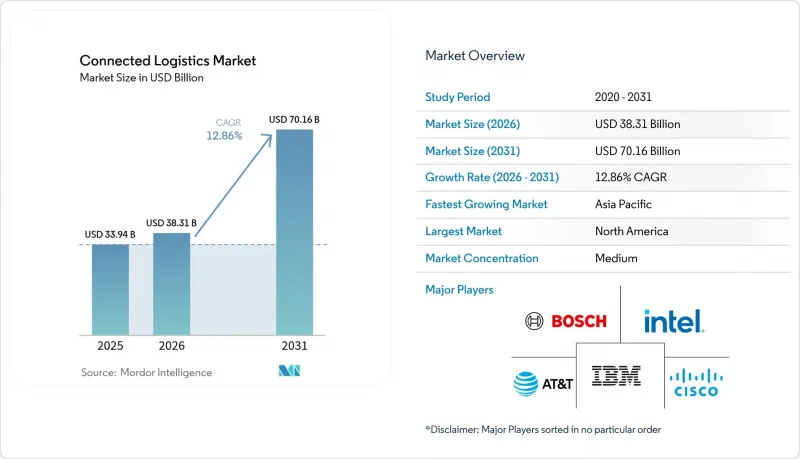
커넥티드 물류 시장 규모는 2025년에 339억 4,000만 달러로 평가되었고 2026년 383억 1,000만 달러에서 2031년까지 701억 6,000만 달러에 이를 것으로 예측되며, 예측 기간(2026-2031년) CAGR은 12.86%를 나타낼 전망입니다.
본 보고서는 소프트웨어 솔루션(자산 관리, 보안 등), 제품 유형(디바이스 관리, 용도 관리 등), 운송 수단(도로, 철도 등), 최종 사용자 산업(자동차, 제조 등),서비스 유형(관리형 서비스 등), 도입 형태(클라우드, 하이브리드 등), 조직 규모(대기업 등) 및 지역별로 분류되어 있습니다.
세계 커넥티드 물류 시장 동향 및 인사이트
IoT를 활용한 자산 추적의 급증
저전력 센서와 전 세계적인 LPWAN 커버리지 덕분에 기업들은 위치 정보, 온도, 충격을 실시간으로 모니터링할 수 있게 되었으며, 일부 LoRaWAN 도입 사례에서는 배터리 수명이 10년까지 연장되었습니다. BMW가 블루투스 비콘을 활용하여 창고 내 차량을 추적한 결과, 수색 시간이 획기적으로 단축되었습니다. 카디널 헬스(Cardinal Health)사의 스마트 센서를 활용한 시범 프로젝트는 병원 비품실의 유효기간 관리를 개선하고 있습니다. AI 분석의 융합을 통해 이력 데이터가 예측 유지보수 경보로 변환되어, 차량 관리 방식이 사후 대응형에서 사전 대응형으로 전환되고 있습니다.
화주 측의 화물 가시화 실시간화 요구
FourKites의 TrackX Yard Solutions 인수로 야드 관리 데이터와 장거리 운송 가시화가 통합되어, 화주에게는 트레일러 위치 정보가 1시간 미만의 간격으로 업데이트되고 있습니다. 자동차 마감 센터에 RFID를 도입함으로써, OEM의 ERP 시스템으로 실시간 상태가 전송되어 엄격한 적시 생산(JIT) 지표를 충족하고 있습니다. 생명과학 분야의 화주들은 적정 유통 기준(GDP)에 따른 연속 온도 기록 요건을 충족하기 위해 멀티 센서 태그를 도입하고 있습니다. 가시화 데이터는 생성형 AI를 활용한 경로 최적화 포털에 활용되며, 2028년까지 물류 KPI 보고의 4분의 1을 처리할 것으로 예측됩니다.
다중 테넌트형 차량 플릿의 사이버 보안 위험
2024년에는 운송 분야에서 보고된 보안 침해 사례가 181% 증가했으며, 랜섬웨어가 차량 텔레매틱스 및 전자 기록 장치를 표적으로 삼았습니다. 화물 도난으로 인한 피해액은 4억 5,500만 달러에 달했으며, 그 대부분은 중개인을 사칭하여 트럭 한 대 분량의 화물 전체를 우회시키는 수법에 의한 것이었습니다. 물류 업계의 CISO(최고정보보안책임자)들은 현재 보안 지출이 두 자릿수 성장을 보일 것으로 예상하고 있으며, 이는 2037년까지 366억 달러에 달할 것이라는 머스크(Maersk)사의 예측을 반영한 것입니다. 멀티테넌트형 SaaS 플랫폼은 테넌트 간의 분리를 복잡하게 만들어 횡방향 이동(lateral movement)의 위험을 높이고 있습니다.
부문 분석
자산 관리는 유휴 시간 단축 및 컨테이너 회전율 향상을 통해 기업이 즉각적인 ROI(투자 수익률)를 얻을 수 있기 때문에 2025년 커넥티드 물류 시장 규모의 40.40%를 차지했습니다. 기업들은 RFID, GNSS, 환경 센서를 통합 대시보드에 통합하여 이용률이 낮은 트레일러나 온도 편차를 실시간으로 감지하고 있습니다. 조직이 트럭의 예상 도착 시간(ETA) 변동이나 체류 시간이 긴 구역에 대해 1초 미만의 인사이트를 요구함에 따라, 스트리밍 분석은 연평균 성장률(CAGR) 16.07%로 발전하고 있으며, 예측적 경로 재설정 엔진을 뒷받침하고 있습니다. 진화하는 창고용 IoT 오버레이는 이용 사례를 피킹 작업자 안내에서 환경 제어 최적화로 확대하여 콜드체인 SKU의 품질 저하율을 줄이고 있습니다. 보안 분석 제품군은 비정상적인 데이터 패킷 흐름을 분석하여 기기 침해의 초기 징후를 감지합니다. 마이크로소프트가 엣지 AI 툴킷을 물류 게이트웨이로 확장함에 따라, 공급업체들은 자산 상태 및 교통량 예측을 단일 추천 엔진에 통합하고 있습니다.
2025년에는 장치 관리가 43.30%의 점유율을 차지했습니다. 이는 펌웨어 패치 적용과 수천 개에 달하는 트럭, 팔레트, 야드용 센서의 인증 작업이 얼마나 복잡한지를 반영한 것입니다. 제로 터치 온보딩 도구를 통해 트럭과 도크의 활성화 시간이 단축되어 대규모 업데이트 주기를 뒷받침하고 있습니다. 프라이빗 5G 및 위성 링크의 보급에 따라 자산별로 조정이 필요한 계약 프로파일이 증가하고 있어, 연결성 관리 시장은 연평균 성장률(CAGR) 15.25%로 확대되고 있습니다. 용도 관리 플랫폼은 지연 시간 허용 범위 및 데이터 상주 요건을 충족하기 위해 클라우드 리전과 엣지 게이트웨이 간에 워크로드를 이동시킵니다. 텐센트와 삼성의 특허 출원은 차량 속도에 따라 무선 매개변수를 조정하는 새로운 트래픽 우선순위 지정 알고리즘을 제시하고 있습니다. 현재 블록체인 지원 장치에는 암호화 모듈이 내장되어 있어, 장치의 수명 주기 관리에 대한 장벽이 높아지고 있습니다.
2025년, 도로 운송은 고밀도 라스트 마일 네트워크와 성숙한 텔레매틱스 사후 장착 도입을 통해 커넥티드 물류 시장 점유율의 38.10%를 차지했습니다. 카메라 기반 ADAS(첨단 운전자 보조 시스템) 및 ELD(전자 운행 기록 장치)의 의무화가 데이터 흐름을 촉진하여 운전자의 안전과 규정 준수를 향상시키는 데 기여하고 있습니다. 해운은 스마트 컨테이너의 원격 측정 및 자동화된 터미널 운영에 힘입어 연평균 성장률(CAGR) 14.72%를 나타낼 것으로 예측됩니다. 철도 업계에서는 바퀴 평탄화 결함을 예측하는 선로 센서 어레이의 도입으로 현대화가 진행되어, 간선 운송 중단이 감소하고 있습니다. 항공 업계에서는 화물 허브에서 ULD 추적기와 AI를 활용한 슬롯 관리 도구가 통합되고 있습니다. 유로테이너(Eurotainer)사의 탱크 컨테이너 원격 측정 기술은 가열 주기를 단축함으로써 공급망 비용을 40% 절감했습니다. 오로라 이노베이션(Aurora Innovation)사가 댈러스와 휴스턴 사이에 구축한 무인 화물 수송 회랑은 인간 운영자 없이 1,200마일을 주행했습니다.
지역별 분석
북미는 2025년, 견고한 고속도로망과 자율주행차 시범 운행을 지원하는 혁신 샌드박스의 뒷받침으로 34.90%의 점유율을 유지했습니다. 아마존은 익일 배송 지역을 4,000개의 지방 커뮤니티까지 확대하기 위해 40억 달러를 투자하고 있으며, 이는 인프라 투자 규모가 얼마나 큰지를 여실히 보여줍니다. UPS의 앤드라우어 헬스케어 그룹 인수는 해당 지역 내 콜드체인에 대한 전문성을 한층 더 강화했습니다. 사이버 위험은 여전히 심각하지만, 벤처 자금과 민관 협력을 통한 테스트베드가 기술 보급을 가속화하고 있습니다. 아시아태평양은 2031년까지 연평균 성장률(CAGR) 13.12%로 성장을 주도할 것으로 예측됩니다. 일본 국토교통성은 도쿄와 오사카를 연결하는 500킬로미터의 자동 화물 운송 노선의 실현 가능성을 평가했습니다. 호주의 물류 자동화 투자액은 40억 달러를 넘어, 창고 로봇 및 야드 자동화 분야까지 확대되고 있습니다. GEODIS사는 4조 5,000억 달러 규모로 성장할 것으로 예상되는 지역 물류 부문을 염두에 두고, 싱가포르에서 중국에 이르는 GPS 추적이 가능한 육상 운송 노선을 확대되고 있습니다. 베트남은 2025년 FIATA 세계 대회 개최국으로서 아세안(ASEAN) 내 물류의 요충지로서의 지위를 확립하고자 하고 있습니다. 유럽에서는 엄격한 데이터 보호 규제와 차량의 전기차 전환 및 지속 가능한 항공 연료로의 전환을 촉진하는 탈탄소화 의무 간의 균형을 모색하고 있습니다. CEVA는 전기 트럭 23대를 추가로 도입하여 저탄소 차량 보유 대수를 1,100대 이상으로 늘렸습니다(cevalogistics.com). DHL은 네스테(Neste)와 SAF(지속 가능한 항공 연료) 공급 모델로 제휴하여 EU 운송 부문의 넷제로 목표를 지원하고 있습니다. 유럽연합 집행위원회는 지역 내 물류 경제 규모를 8,780억 유로로 추산하고 있으며, 국경을 넘는 행정 절차를 줄이기 위해 규정 조화를 추진하고 있습니다.
기타 혜택:
- 엑셀 형식 시장 예측(ME) 시트
- 3개월간의 애널리스트 지원
자주 묻는 질문
목차
제1장 서론
제2장 조사 방법
제3장 주요 요약
제4장 시장 구도
제5장 시장 규모와 성장 예측
제6장 경쟁 구도
JHS 26.09.09According to Mordor Intelligence, the connected logistics market size was valued at USD 33.94 billion in 2025 and estimated to grow from USD 38.31 billion in 2026 to reach USD 70.16 billion by 2031, at a CAGR of 12.86% during the forecast period (2026-2031).
This report is Segmented by Software Solution (Asset Management, Security, and More), Product Type (Device Management, Application Management, and More), Transportation Mode (Roadways, Railways, and More), End-User Industry (Automotive, Manufacturing and More), Service Type (Managed Services and More), Deployment Mode (Cloud, Hybrid, and More), Organization Size (Large Enterprises and More), and Geography.
Global Connected Logistics Market Trends and Insights
Surge in IoT-enabled asset tracking
Low-power sensors and global LPWAN coverage let companies monitor location, temperature, and shock in real time, extending battery life to a decade in some LoRaWAN deployments. BMW's use of Bluetooth beacons to trace vehicles across warehouses cut search times dramatically. Cardinal Health's smart-sensor pilots improve expiry management in hospital supply rooms. Converging AI analytics transform historical data into predictive maintenance alerts, shifting fleets from reactive to proactive coordination.
Real-time freight visibility mandates from shippers
FourKites' purchase of TrackX Yard Solutions pairs yard-management data with over-the-road visibility, giving shippers sub-hourly updates on trailer locations. RFID deployments in automotive finishing centers stream live status to OEM ERP systems, satisfying strict just-in-time metrics. Life-science consignors deploy multi-sensor tags to meet continuous-temperature logging rules under Good Distribution Practice. Visibility feeds generative-AI route optimization portals expected to handle one-quarter of logistics KPI reporting by 2028.
Cyber-security liabilities across multi-tenant fleets
Reported breaches in transport rose 181% in 2024, with ransomware targeting fleet telematics and electronic logging devices. Cargo theft hit USD 455 million, often via broker impersonation that reroutes entire truckloads. Logistics CISOs now budget double-digit growth in security spend, mirroring Maersk's forecast of USD 36.6 billion by 2037. Multi-tenant SaaS platforms complicate isolation-of-tenants, elevating lateral-movement risks
Other drivers and restraints analyzed in the detailed report include:
- M&A-driven platform consolidation
- 5G private networks in yards and ports
- Fragmented global data-sovereignty laws
For complete list of drivers and restraints, kindly check the Table Of Contents.
Segment Analysis
Asset Management represented 40.40% of the connected logistics market size in 2025 thanks to the immediate ROI firms gain by trimming idle time and improving container turns. Enterprises mesh RFID, GNSS, and environmental sensors into unified dashboards that flag under-utilized trailers and temperature excursions in real time. Streaming Analytics is advancing at 16.07% CAGR as organizations demand sub-second insight into truck ETA variance and dwell-time hot spots, fueling predictive rerouting engines.Evolving warehouse IoT overlays expand use cases from picker guidance to climate optimization, cutting spoilage rates for cold-chain SKUs. Security analytics suites analyze atypical data-packet flows to detect early indicators of device compromise. As Microsoft extends edge AI toolkits into logistics gateways, providers stitch asset health and traffic forecasts into single recommendation engines.
Device Management captured 43.30% share in 2025, reflecting the complexity of patching firmware and certifying thousands of truck, pallet, and yard sensors. Zero-touch onboarding tools reduce truck-dock activation times, supporting large-scale refresh cycles. Connectivity Management is rising at a 15.25% CAGR as private 5G and satellite links multiply subscription profiles that must be orchestrated per asset.Application Management platforms move workloads between cloud regions and edge gateways to honor latency budgets and data-residency constraints. Patent filings by Tencent and Samsung illustrate new traffic-prioritization algorithms that adapt radio parameters by vehicle speed. Blockchain-enabled devices now embed cryptographic modules, raising the bar for device-lifecycle orchestration
Roadways held 38.10% of the connected logistics market share in 2025 due to dense last-mile networks and mature telematics retrofits. Camera-based ADAS and ELD mandates fuel data flows that improve driver safety and regulatory compliance. Seaways is expected to post a 14.72% CAGR, propelled by smart-container telemetry and automated terminal operations.Railways modernize with wayside-sensor arrays that predict wheel-flat defects, reducing line-haul interruptions. Airways integrate ULD trackers and AI-driven slot-management tools at cargo hubs. Eurotainer's tank-container telemetry cut supply-chain costs 40% by shrinking heating cycles. Aurora Innovation's driverless freight corridor between Dallas and Houston logged 1,200 miles without a human operator
Complete Report Scope:
- By Software Solution
- Asset Management
- Warehouse IoT
- Security
- Data Management
- Network Management
- Streaming Analytics
- By Product Type
- Device Management
- Application Management
- Connectivity Management
- By Transportation Mode
- Roadways
- Railways
- Airways
- Seaways
- By End-user Industry
- Automotive
- Manufacturing
- Oil and Gas
- IT and Telecom
- Healthcare
- Retail and E-commerce
- Food and Beverage
- Other Industries
- By Service Type
- Consulting and Integration
- Managed Services
- Support and Maintenance
- By Deployment Mode
- Cloud
- On-Premise
- Hybrid
- By Organisation Size
- Large Enterprises
- Small and Medium Enterprises (SMEs)
- By Geography
- North America
- United States
- Canada
- Mexico
- South America
- Brazil
- Argentina
- Chile
- Rest of South America
- Europe
- Germany
- United Kingdom
- France
- Italy
- Spain
- Netherlands
- Russia
- Rest of Europe
- Asia Pacific
- China
- India
- Japan
- South Korea
- ASEAN
- Rest of Asia Pacific
- Middle East and Africa
- Middle East
- GCC (Saudi Arabia, UAE, Qatar, etc.)
- Turkey
- Rest of Middle East
- Africa
- South Africa
- Rest of Africa
- Middle East
- North America
Geography Analysis
North America retained 34.90% share in 2025, buoyed by robust highway networks and supportive innovation sandboxes for autonomous vehicle pilots. Amazon is investing USD 4 billion to extend next-day coverage to 4,000 rural communities, underscoring the scale of infrastructure spend. UPS's purchase of Andlauer Healthcare Group deepens cold-chain specialization in the region. Cyber-risk remains acute, yet venture funding and public-private testbeds accelerate technology diffusion. Asia Pacific is projected to lead growth at a 13.12% CAGR through 2031. Japan's transport ministry is evaluating a 500-kilometer automated freight link between Tokyo and Osaka. Australia's logistics-automation outlays exceed USD 4 billion, spanning warehouse robotics and yard automation. GEODIS is extending GPS-tracked road corridors from Singapore to China in anticipation of a USD 4.5 trillion regional logistics sector. Vietnam positions itself as an ASEAN logistics pivot by hosting the 2025 FIATA World Congress. Europe balances stringent data-protection rules with decarbonization mandates that push fleets toward EVs and sustainable aviation fuels. CEVA added 23 electric trucks, raising its low-carbon fleet beyond 1,100 vehicles cevalogistics.com. DHL collaborates with Neste on SAF supply models, supporting the EU's net-zero transport goal. The European Commission estimates the regional logistics economy at EUR 878 billion and continues harmonizing rules to cut cross-border paperwork
- Bosch Service Solutions GmbH
- Cisco Systems Inc.
- AT&T Inc.
- IBM Corporation
- Intel Corporation
- SAP SE
- Oracle Corporation
- Freightgate Inc.
- ORBCOMM Inc.
- HCL Technologies Ltd.
- Honeywell International Inc.
- Microsoft Corporation
- Siemens AG
- Zebra Technologies Corp.
- Trimble Inc.
- Descartes Systems Group
- Sensitech Inc.
- Project44 Inc.
- FourKites Inc.
- Huawei Technologies Co. Ltd.
- JD Logistics
- DHL Supply Chain
- FedEx Corp.
- UPS Inc.
Additional Benefits:
- The market estimate (ME) sheet in Excel format
- 3 months of analyst support
TABLE OF CONTENTS
1 INTRODUCTION
- 1.1 Study Assumptions and Market Definition
- 1.2 Scope of the Study
2 RESEARCH METHODOLOGY
3 EXECUTIVE SUMMARY
4 MARKET LANDSCAPE
- 4.1 Market Overview
- 4.2 Market Drivers
- 4.2.1 Surge in IoT-enabled asset tracking
- 4.2.2 Real-time freight visibility mandates from shippers
- 4.2.3 MandA-driven platform consolidation
- 4.2.4 5G private networks in yards and ports
- 4.2.5 De-risking supply chains via digital twins
- 4.3 Market Restraints
- 4.3.1 Cyber-security liabilities across multi-tenant fleets
- 4.3.2 Fragmented global data-sovereignty laws
- 4.3.3 Scarcity of interoperable APIs for brown-field assets
- 4.3.4 Margin pressure from "ship-for-free" e-commerce models
- 4.4 Value Chain Analysis
- 4.5 Regulatory Landscape
- 4.6 Technological Outlook
- 4.7 Porter's Five Forces Analysis
- 4.7.1 Threat of New Entrants
- 4.7.2 Bargaining Power of Buyers
- 4.7.3 Bargaining Power of Suppliers
- 4.7.4 Threat of Substitutes
- 4.7.5 Competitive Rivalry
5 MARKET SIZE AND GROWTH FORECASTS (VALUE)
- 5.1 By Software Solution
- 5.1.1 Asset Management
- 5.1.2 Warehouse IoT
- 5.1.3 Security
- 5.1.4 Data Management
- 5.1.5 Network Management
- 5.1.6 Streaming Analytics
- 5.2 By Product Type
- 5.2.1 Device Management
- 5.2.2 Application Management
- 5.2.3 Connectivity Management
- 5.3 By Transportation Mode
- 5.3.1 Roadways
- 5.3.2 Railways
- 5.3.3 Airways
- 5.3.4 Seaways
- 5.4 By End-user Industry
- 5.4.1 Automotive
- 5.4.2 Manufacturing
- 5.4.3 Oil and Gas
- 5.4.4 IT and Telecom
- 5.4.5 Healthcare
- 5.4.6 Retail and E-commerce
- 5.4.7 Food and Beverage
- 5.4.8 Other Industries
- 5.5 By Service Type
- 5.5.1 Consulting and Integration
- 5.5.2 Managed Services
- 5.5.3 Support and Maintenance
- 5.6 By Deployment Mode
- 5.6.1 Cloud
- 5.6.2 On-Premise
- 5.6.3 Hybrid
- 5.7 By Organisation Size
- 5.7.1 Large Enterprises
- 5.7.2 Small and Medium Enterprises (SMEs)
- 5.8 By Geography
- 5.8.1 North America
- 5.8.1.1 United States
- 5.8.1.2 Canada
- 5.8.1.3 Mexico
- 5.8.2 South America
- 5.8.2.1 Brazil
- 5.8.2.2 Argentina
- 5.8.2.3 Chile
- 5.8.2.4 Rest of South America
- 5.8.3 Europe
- 5.8.3.1 Germany
- 5.8.3.2 United Kingdom
- 5.8.3.3 France
- 5.8.3.4 Italy
- 5.8.3.5 Spain
- 5.8.3.6 Netherlands
- 5.8.3.7 Russia
- 5.8.3.8 Rest of Europe
- 5.8.4 Asia Pacific
- 5.8.4.1 China
- 5.8.4.2 India
- 5.8.4.3 Japan
- 5.8.4.4 South Korea
- 5.8.4.5 ASEAN
- 5.8.4.6 Rest of Asia Pacific
- 5.8.5 Middle East and Africa
- 5.8.5.1 Middle East
- 5.8.5.1.1 GCC (Saudi Arabia, UAE, Qatar, etc.)
- 5.8.5.1.2 Turkey
- 5.8.5.1.3 Rest of Middle East
- 5.8.5.2 Africa
- 5.8.5.2.1 South Africa
- 5.8.5.2.2 Rest of Africa
- 5.8.5.1 Middle East
- 5.8.1 North America
6 COMPETITIVE LANDSCAPE
- 6.1 Market Concentration
- 6.2 Strategic Moves
- 6.3 Market Share Analysis
- 6.4 Company Profiles {(includes Global level Overview, Market level overview, Core Segments, Financials as available, Strategic Information, Market Rank/Share for key companies, Products and Services, and Recent Developments)}
- 6.4.1 Bosch Service Solutions GmbH
- 6.4.2 Cisco Systems Inc.
- 6.4.3 AT&T Inc.
- 6.4.4 IBM Corporation
- 6.4.5 Intel Corporation
- 6.4.6 SAP SE
- 6.4.7 Oracle Corporation
- 6.4.8 Freightgate Inc.
- 6.4.9 ORBCOMM Inc.
- 6.4.10 HCL Technologies Ltd.
- 6.4.11 Honeywell International Inc.
- 6.4.12 Microsoft Corporation
- 6.4.13 Siemens AG
- 6.4.14 Zebra Technologies Corp.
- 6.4.15 Trimble Inc.
- 6.4.16 Descartes Systems Group
- 6.4.17 Sensitech Inc.
- 6.4.18 Project44 Inc.
- 6.4.19 FourKites Inc.
- 6.4.20 Huawei Technologies Co. Ltd.
- 6.4.21 JD Logistics
- 6.4.22 DHL Supply Chain
- 6.4.23 FedEx Corp.
- 6.4.24 UPS Inc.