
|
시장보고서
상품코드
2123306
커넥티드 선박 시장 : 점유율 분석, 업계 동향과 통계, 성장 예측(2026-2031년)Connected Ship - Market Share Analysis, Industry Trends & Statistics, Growth Forecasts (2026 - 2031) |
||||||
 Mordor Intelligence
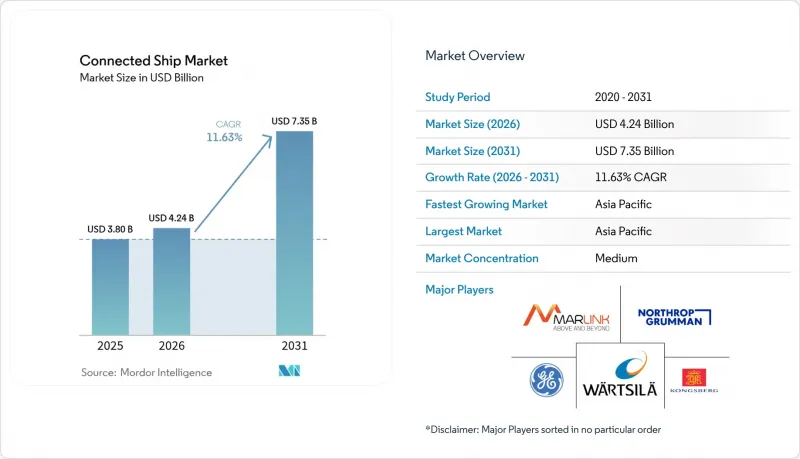
Mordor Intelligence에 의하면, 2026년 커넥티드 선박 시장 규모는 42억 4,000만 달러로 추정되고 있어 2025년 38억 달러에서 확대해, 2031년에는 73억 5,000만 달러에 이를 것으로 예측됩니다.
2026년부터 2031년까지 연평균 성장률(CAGR) 11.63%로 성장할 것으로 전망됩니다.
본 보고서는 선박 유형(상업용, 국방 및 해안 경비대), 용도(선박 항행 관리, 선단 운영, 선단 상태 모니터링), 도입 형태(신규 도입, 개조) 및 지역별로 분류되어 있습니다.
세계 커넥티드 선박 시장 동향 및 인사이트
IMO의 e-네비게이션 및 CII 의무화
정기적인 항해 일지 제출 대신 지속적인 데이터 보고가 의무화됨에 따라, 선박은 함교, 기관실 및 육상 사무실을 연결하는 실시간 연결 기능을 통합해야 합니다. 2024년 1월부터 운영이 시작된 해사 싱글 윈도우(Maritime Single Window)에 따라 항만은 표준화된 전자 신청 접수가 의무화되었으며, 이로 인해 전 세계 연결성에 대한 기본 요건이 높아지고 있습니다. 2025년부터 운영이 시작되는 새로운 S-100 수로 측량 기준에서는 자율 항해에 사용되는 디지털 트윈에 정보를 제공하는 상세한 수심 데이터 레이어가 추가됩니다. 개정된 국제해사기구(IMO) 전략은 2030년까지 CO2 배출 강도를 40% 감축하는 것을 목표로 하고 있으며, 선주들은 진행 상황을 확인하고 벌칙을 피하기 위해 센서를 장착하고 있습니다. 2025년에 도입될 선원용 전자 증명서를 통해 승무원 관리의 디지털화가 더욱 진전되어, 행정 처리 지연이 완화될 것입니다.
선내 ICT 및 IoT 도입 확대
선단 관리자들은 현재 예측 분석 엔진에 데이터를 제공하는 수천 개의 저전력 센서를 도입하고 있으며, 이를 통해 유지보수 팀은 부품이 고장 나기 전에 수리를 수행할 수 있게 되었습니다. Maersk와 Onomondo의 제휴를 통해 전 세계 휴대전화 회선 및 위성 통신을 통해 컨테이너가 연결되며, 대형 해운사가 IoT를 활용하여 운항 일정의 신뢰성을 향상시키고 있는 실제 사례가 제시되고 있습니다. NB-IoT 및 BLE 메시 장치는 컨테이너 내부의 습도, 진동, 충격을 추적하여 종단 간 화물 가시성을 지속적으로 보장합니다. 엣지 컴퓨팅 모듈이 데이터를 로컬에서 처리함으로써 위성 대역폭 사용량을 줄이고 지연에 민감한 기능을 유지합니다. 한국과 일본의 항만 운영 사업자는 선박이 접안했을 때 데이터를 백홀로 전송하는 선박-항만 간 5G 네트워크를 지원하여 정보의 순환을 완성하고 있습니다.
광대역 연결에 따른 높은 CAPEX/OPEX
하드웨어, 설치, 통신료, 승무원 교육 등의 비용이 합쳐져 선주의 예산을 압박하고 있으며, 특히 소규모 불규칙 선박 운항사에게는 큰 부담이 되고 있습니다. 미국 해안경비대의 사이버 보안 규제로 인해 규정 준수 비용이 연간 1억 3,870만 달러 증가하여 디지털 전환의 장벽이 높아지고 있습니다. 반도체 부족으로 인해 2024년 내내 전자기기 가격이 상승했으며, 중국산 부품에 대한 관세가 생산 비용을 추가로 25% 끌어올렸습니다. 많은 선주들은 가동 중단 시간을 최소화하기 위해 선박이 드라이독에 입항할 때까지 라인 핏(선체에 설비 설치) 프로젝트를 연기하고 있지만, 이러한 접근 방식은 투자 회수 기간을 길어지게 합니다. 자본 부담을 줄이기 위해 리스 모델이나 Bandwidth-as-a-Service(BaaS) 플랜이 등장하고 있지만, 이에 대한 도입에는 여전히 신중한 태도가 나타나고 있습니다.
부문 분석
2025년, 커넥티드 선박 시장 매출의 84.40%를 상업 부문이 차지했습니다. 이는 상선의 선박 수가 방대할 뿐만 아니라 규제 준수 비용이 상승하고 있음을 반영합니다. 상업용 선박을 위한 커넥티드 선박 시장 규모는 연평균 성장률(CAGR) 11.21%로 확대될 것으로 예측되며, 이는 연료 최적화, 화물 가시화, 승무원 연결성에 대한 투자를 뒷받침하고 있습니다. 해군이 자율형 초계정, 안전한 통신, 통합된 전장 상황 인식을 추구하는 가운데, 방위 분야의 용도는 연평균 성장률(CAGR) 12.96%로 확대되고 있습니다. 인도-태평양 지역의 지정학적 긴장 고조와 합동 훈련이 방위 수요를 더욱 부추기고 있지만, 예산 주기의 영향으로 조달 지연이 발생하여 단기적인 수요를 억제하고 있습니다. 민간 해운사들은 메시 네트워크 및 견고한 사이버 보안과 같은 국방 분야의 혁신을 통해 비용 대비 효과가 높은 민간용 파생 기술의 활용을 모색하고 있습니다.
민간 분야의 선단 디지털화는 연료 소비량 감소와 기항 효율 향상을 통해 투자 수익률(ROI)을 공고히 하고 있습니다. 한편, 국방 분야 구매자들은 대역폭 가격보다 중복된 위성 통신 링크와 전자기 내성을 더 중요시하고 있으며, 이러한 차이가 공급업체의 로드맵을 형성하고 있습니다. 소프트웨어 정의 무선(SDR)의 소형화 및 저비용화가 진행됨에 따라, 하드웨어의 차이를 최소화하면서 상선, 해안 경비대, 해군 고객을 아우르는 부문 간 통합 플랫폼이 등장하고 있습니다. 이러한 융합으로 인해 개발 주기가 단축되고, 연구개발비가 더 넓은 판매 대수 기반으로 분산됨에 따라, 전문 사이버 보안 벤더들에게 있어 기존이면서도 개방적인 틈새 시장이 강화되고 있습니다.
지역별 분석
아시아태평양은 2025년에 커넥티드 선박 시장 점유율의 34.60%를 차지하고, 2031년까지 20.95%의 성장 궤도를 그리는 등 전 세계 보급을 주도하고 있습니다. 2025년까지 탄소 제로 선박의 점유율 50%를 목표로 하는 중국의 친환경 조선 행동 계획에 따라, 조선소는 연료전지, 배터리, 대체 연료를 모니터링하는 디지털 시스템의 통합을 요구받고 있습니다. 일본의 Society 5.0 프로그램은 선박과 육지 간의 데이터 교환 및 해상 자율형 수상 함정에 대한 조사에 자금을 지원하며, 국내 수요를 뒷받침하고 있습니다. 한국의 수출 신용 지원에 힘입어 선주들은 신조선 입찰 시 고대역폭 위성 통신을 사양으로 지정하도록 권장받고 있으며, 이로 인해 LEO(저궤도) 대응 하이브리드 네트워크로의 조기 전환이 확실해지고 있습니다.
북미는 매출액 기준 2위를 차지하고 있으며, 엄격한 사이버 보안 규제와 높은 인건비로 인해 예측 유지보수가 주목받고 있습니다. 2025년 7월에 발효되는 미국 해안경비대의 지침에 따라 존스법 적용 선단의 사이버 보안 대책 개선이 가속화되고 있습니다. 한편, 해상 에너지 사업자들은 안전성과 가동 시간을 확보하기 위해 커넥티드 시추선이 필수적이라고 보고 있습니다. 캐나다의 사업자들은 북극해 항해 보고 요건 준수와 육상 인프라가 부족한 지역에서의 원격 기술 지원을 실현하기 위해 커넥티비티를 활용하고 있습니다.
유럽에서는 도입 수준이 성숙 단계에 이르렀으나, 환경 관련 법규에 따라 여전히 성장이 전망되고 있습니다. FuelEU Maritime 및 EU 배출권 거래 제도(EU ETS)에 해운업이 임베디드됨에 따라, 커넥티드 플랫폼만이 제공할 수 있는 상세한 데이터 보고가 요구되고 있습니다. 스칸디나비아, 네덜란드, 스페인의 각 항만에서는 디지털 방식으로 검증된 탄소 배출 감축에 대해 항만 사용료 감면 조치가 도입되어 비즈니스 타당성이 강화되고 있습니다. EU 내 근해 운항 사업자들은 연안 수역 내에서도 안정적인 데이터 통신을 유지하기 위해, 저전력 단말기와 이동통신 회선을 통한 백홀을 결합한 시스템에 투자하고 있습니다. 이러한 요인들이 복합적으로 작용하여 2030년까지 유럽 선단의 꾸준한 디지털화 추진을 뒷받침하고 있습니다.
기타 혜택:
- 엑셀 형식 시장 예측(ME) 시트
- 3개월간의 애널리스트 지원
자주 묻는 질문
목차
제1장 서론
제2장 조사 방법
제3장 주요 요약
제4장 시장 구도
제5장 시장 규모와 성장 예측
제6장 경쟁 구도
제7장 시장 기회와 향후 전망
JHS 26.09.09According to Mordor Intelligence, connected ship market size in 2026 is estimated at USD 4.24 billion, growing from 2025 value of USD 3.80 billion with 2031 projections showing USD 7.35 billion, growing at 11.63% CAGR over 2026-2031.
This report is Segmented by Ship Type (Commercial, Defence, and Coast-Guard), by Application Type (Vessel Traffic Management, Fleet Operations, Fleet Health Monitoring), by Fit (Line Fit, Retrofit), and Geography.
Global Connected Ship Market Trends and Insights
IMO e-navigation and CII mandates
Continuous data reporting now replaces periodic logs, forcing vessels to integrate real-time connectivity that links bridge, engine room, and shore offices. The Maritime Single Window, live since January 2024, obliges ports to accept standardized electronic submissions, which raises baseline connectivity requirements worldwide. New S-100 hydrographic standards, operational from 2025, add granular bathymetric layers that feed digital twins used for autonomous navigation. The revised International Maritime Organization strategy targets a 40% cut in CO2 intensity by 2030, so ship owners equip sensors that validate progress and avoid penalties.Electronic certificates for seafarers, adopted in 2025, further digitize crew management and reduce administrative lags.
Growing incorporation of ICT and IoT on board
Fleet managers now deploy thousands of low-power sensors that feed predictive analytics engines, allowing maintenance teams to fix components before failure. Maersk's collaboration with Onomondo connects containers through global cellular and satellite links, showing how large carriers exploit IoT to raise schedule reliability. NB-IoT and BLE Mesh devices track humidity, vibration, and shock inside boxes, creating continuous end-to-end cargo visibility. Edge computing modules process data locally to lower satellite bandwidth use and preserve latency-sensitive functions. Port operators in South Korea and Japan support ship-to-shore 5 G networks that backhaul the data once vessels berth, closing the information loop.
High CAPEX / OPEX of broadband connectivity
Hardware, installation, airtime, and crew training together stretch shipowner budgets, especially for smaller tramp operators. The United States Coast Guard cyber rules add USD 138.7 million per year in compliance costs, raising the hurdle for digital upgrades. Semiconductor scarcity lifted electronics pricing throughout 2024, and tariffs on Chinese components added a further 25% to production costs. Many owners delay line-fit projects until vessels dry-dock to minimize downtime, yet this approach prolongs payback periods. Leasing models and bandwidth-as-a-service plans are emerging to ease capital strain, though adoption remains cautious.
Other drivers and restraints analyzed in the detailed report include:
- Rapid roll-out of LEO constellations
- Carbon-intensity targets driving data-driven voyage optimization
- Escalating cyber-risk and insurance premiums
For complete list of drivers and restraints, kindly check the Table Of Contents.
Segment Analysis
The commercial segment generated 84.40% of the connected ship market revenue in 2025, reflecting the sheer number of merchant hulls and rising regulatory compliance costs. The connected ship market size for commercial vessels is projected to grow at an 11.21% CAGR, underpinning investments in fuel optimisation, cargo visibility, and crew connectivity. Defense applications are expanding at 12.96% CAGR as navies pursue autonomous patrol craft, secure communications, and integrated battlespace awareness. Growing geopolitical tensions and joint exercises in the Indo-Pacific further drive defense demand, yet budget cycles introduce procurement delays that temper near-term volumes. Commercial carriers look to defense innovations-such as mesh networking and hardened cybersecurity-for cost-effective civilian spin-offs.
Fleet digitization in the commercial arena anchors financial return on investment through lower fuel burn and port call efficiency. Meanwhile, defense buyers value redundant satcom links and electromagnetic resilience over bandwidth price, a distinction that shapes vendor roadmaps. As software-defined radios shrink in size and cost, cross-segment platforms emerge that serve merchants, coast guard, and naval customers with minimal hardware variance. The convergence shortens development cycles and spreads R&D cost across a wider volume base, reinforcing incumbent yet open niches for specialized cybersecurity vendors.
Complete Report Scope:
- By Ship Type
- Commercial
- Defence and Coast-Guard
- By Application
- Vessel Traffic Management
- Fleet Operations
- Fleet Health Monitoring
- By Fit
- Retrofit
- Line-fit
- By Geography
- North America
- United States
- Canada
- Europe
- United Kingdom
- Germany
- France
- Rest of Europe
- Asia-Pacific
- China
- Japan
- India
- South Korea
- Rest of Asia-Pacific
- Middle East and Africa
- South America
- North America
Geography Analysis
Asia Pacific leads global adoption with 34.60% connected ship market share in 2025 and a 20.95% growth trajectory to 2031. China's green shipbuilding action plan, targeting 50% share in zero-carbon vessels by 2025, pushes yards to integrate digital systems that monitor fuel cells, batteries, and alternative fuels. Japan's Society 5.0 program funds research on ship-to-shore data exchange and maritime autonomous surface ships, reinforcing domestic demand. South Korea's export credit support encourages fleets to specify high-bandwidth satcom during newbuild tenders, ensuring early migration to LEO-enabled hybrid networks.
North America ranks second by revenue, driven by strict cybersecurity regulations and high labor costs that make predictive maintenance attractive. The United States Coast Guard mandate, effective July 2025, accelerates cyber-secure retrofits on Jones Act fleets, while offshore energy operators view connected drilling vessels as essential for safety and uptime. Canadian operators leverage connectivity to comply with Arctic voyage reporting and to enable remote technical assistance amid sparse shore infrastructure.
Europe commands mature adoption levels but remains growth-relevant due to environmental legislation. FuelEU Maritime and inclusion of shipping in the EU Emissions Trading System demand granular data reporting that only connected platforms can deliver. Ports across Scandinavia, the Netherlands, and Spain now offer reduced harbour dues for digitally verified carbon reductions, reinforcing the business case. Intra-EU short-sea operators invest in low-power terminals paired with cellular backhaul to maintain constant data flow even within coastal zones. Together, these factors underpin steady European fleet conversions through 2030.
- Northrop Grumman Corp.
- General Electric Co.
- Wartsila Oyj Abp
- Kongsberg Gruppen ASA
- Marlink AS
- Synectics Ltd.
- Atos SE
- Inmarsat (Viasat)
- Iridium Communications
- Navis (Navis LLC)
- DNV (Veracity)
- ABS Wavesight
- ABB Marine and Ports
- Thales Group
- Cobham Satcom
- KVH Industries
- Furuno Electric
- Samsung Heavy Industries
- Raytheon Technologies
- Starlink (SpaceX)
- OneWeb (Eutelsat)
Additional Benefits:
- The market estimate (ME) sheet in Excel format
- 3 months of analyst support
TABLE OF CONTENTS
1 INTRODUCTION
- 1.1 Study Assumptions and Market Definition
- 1.2 Scope of the Study
2 RESEARCH METHODOLOGY
3 EXECUTIVE SUMMARY
4 MARKET LANDSCAPE
- 4.1 Market Overview
- 4.2 Market Drivers
- 4.2.1 Increasing seaborne trade volumes
- 4.2.2 Growing incorporation of ICT and IoT on-board
- 4.2.3 Expanding maritime tourism and cruise traffic
- 4.2.4 IMO e-navigation and CII data-reporting mandates
- 4.2.5 Rapid roll-out of LEO constellations lowering broadband cost
- 4.2.6 Carbon-intensity targets driving data-driven voyage optimisation
- 4.3 Market Restraints
- 4.3.1 High CAPEX / OPEX of broadband connectivity
- 4.3.2 Escalating cyber-risk and insurance premiums
- 4.3.3 Data-ownership / interoperability gaps among OEMs
- 4.3.4 Shortage of digitally-skilled seafarers and shore staff
- 4.4 Value/Supply-Chain Analysis
- 4.5 Regulatory Landscape
- 4.6 Technological Outlook
- 4.7 Porter's Five Forces
- 4.7.1 Threat of New Entrants
- 4.7.2 Bargaining Power of Buyers
- 4.7.3 Bargaining Power of Suppliers
- 4.7.4 Threat of Substitutes
- 4.7.5 Intensity of Rivalry
5 MARKET SIZE AND GROWTH FORECASTS (VALUE)
- 5.1 By Ship Type
- 5.1.1 Commercial
- 5.1.2 Defence and Coast-Guard
- 5.2 By Application
- 5.2.1 Vessel Traffic Management
- 5.2.2 Fleet Operations
- 5.2.3 Fleet Health Monitoring
- 5.3 By Fit
- 5.3.1 Retrofit
- 5.3.2 Line-fit
- 5.4 By Geography
- 5.4.1 North America
- 5.4.1.1 United States
- 5.4.1.2 Canada
- 5.4.2 Europe
- 5.4.2.1 United Kingdom
- 5.4.2.2 Germany
- 5.4.2.3 France
- 5.4.2.4 Rest of Europe
- 5.4.3 Asia-Pacific
- 5.4.3.1 China
- 5.4.3.2 Japan
- 5.4.3.3 India
- 5.4.3.4 South Korea
- 5.4.3.5 Rest of Asia-Pacific
- 5.4.4 Middle East and Africa
- 5.4.5 South America
- 5.4.1 North America
6 COMPETITIVE LANDSCAPE
- 6.1 Market Concentration
- 6.2 Strategic Moves
- 6.3 Market Share Analysis
- 6.4 Company Profiles (includes Global level Overview, Market level overview, Core Segments, Financials, Strategic Info, Market Rank/Share, Products and Services, Recent Developments)
- 6.4.1 Northrop Grumman Corp.
- 6.4.2 General Electric Co.
- 6.4.3 Wartsila Oyj Abp
- 6.4.4 Kongsberg Gruppen ASA
- 6.4.5 Marlink AS
- 6.4.6 Synectics Ltd.
- 6.4.7 Atos SE
- 6.4.8 Inmarsat (Viasat)
- 6.4.9 Iridium Communications
- 6.4.10 Navis (Navis LLC)
- 6.4.11 DNV (Veracity)
- 6.4.12 ABS Wavesight
- 6.4.13 ABB Marine and Ports
- 6.4.14 Thales Group
- 6.4.15 Cobham Satcom
- 6.4.16 KVH Industries
- 6.4.17 Furuno Electric
- 6.4.18 Samsung Heavy Industries
- 6.4.19 Raytheon Technologies
- 6.4.20 Starlink (SpaceX)
- 6.4.21 OneWeb (Eutelsat)
7 MARKET OPPORTUNITIES AND FUTURE OUTLOOK
- 7.1 White-space and Unmet-need Assessment