|
시장보고서
상품코드
2123332
광변조기 시장 : 점유율 분석, 업계 동향과 통계, 성장 예측(2026-2031년)Optical Modulators - Market Share Analysis, Industry Trends & Statistics, Growth Forecasts (2026 - 2031) |
||||||
 Mordor Intelligence
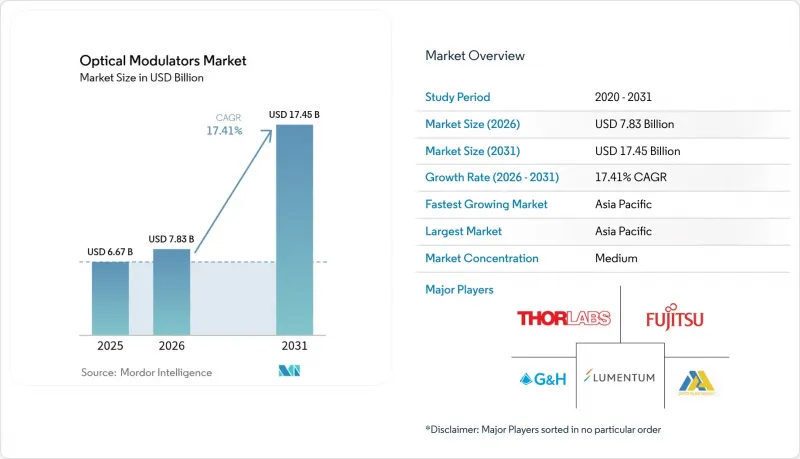
Mordor Intelligence에 의하면, 광변조기 시장 규모는 2025년 66억 7,000만 달러에서 2026년에는 78억 3,000만 달러로 확대되어 2026년부터 2031년까지 CAGR 17.41%로 성장을 지속하여, 2031년까지 174억 5,000만 달러에 이를 것으로 예측됩니다.
본 보고서는 제품 유형(진폭 변조기, 편광 변조기 등), 소재 플랫폼(리튬 니오브산염, 인듐 인화물 등), 데이터 전송 속도 등급(25Gbps 이하, 25-50 Gbps, 기타),용도(광통신, 광섬유 센서 등), 지역별로 분류되어 있습니다. 시장 전망은 금액(달러) 기준으로 제시되어 있습니다.
세계 광변조기 시장 동향 및 인사이트
광섬유 통신 인프라에 대한 투자 확대
클라우드 제공업체들이 비트당 비용 절감을 추구한 결과, AI 클러스터 구축이 사상 최고 수준에 도달했으며, 2024년에는 800G 트랜시버 출하량이 2,000만 대를 돌파했습니다. 400G에서 800G로의 전환, 그리고 224G SerDes를 사용한 Ciena사의 1.6T 코히런트 라이트 데모와 같은 초기 1.6T 실증 사례를 통해, 변조기는 전력 소비 허용 범위를 초과하지 않으면서 100Gbaud의 심볼 레이트를 달성해야할 것으로 요구되고 있습니다. 선형 플러그형 광학 시장 규모는 2024년 50억 달러에서 2026년까지 100억 달러 이상으로 두 배로 증가하여, 콤팩트하고 낮은 Vπ를 가진 아키텍처에 대한 단기적인 수요를 더욱 높이고 있습니다. 코패키지된 광학 장치 내부의 열 설계 여유는 점점 더 엄격해지고 있으며, 이는 동일한 기판상에서 드라이버 IC와 변조기의 도파관을 공동으로 최적화할 수 있는 통합 공급업체에 유리하게 작용하고 있습니다. 스위치 ASIC 로드맵이 51T 및 102T 패브릭을 확정함에 따라 광 엔진 탑재율이 가속화되고 있으며, 단기 연평균 성장률(CAGR)에 대한 드라이버의 긍정적 영향이 더욱 강화되고 있습니다.
신흥국에서의 5G 및 FTTH 구축 가속화
인도에서는 5G 개시 후 월간 광섬유 설치량이 101,550km로 급증하여 5G 도입 전 수준의 6배에 달했습니다. 이는 통신 타워의 70%를 광섬유로 전환한다는 정책 목표가 실제 광 부품 수요로 어떻게 연결되고 있는지를 여실히 보여줍니다. 각 스몰 셀에는 최소 1개의 25G 또는 50G 광 프론트홀 링크가 필요하기 때문에 비용과 내열성을 고려하여 설계된 변조기에 대한 대량 주문이 쏟아지고 있습니다. 중국의 클라우드 사업자들은 2024년에 20억-30억 달러 규모의 국내 트랜시버 시장을 창출하고 있으며, 이는 지역적인 조달 주기를 강화하고 그 파급 효과는 변조기 제조 공장까지 미치고 있습니다. 폭넓은 환경 조건에서 디바이스 인증을 획득할 수 있는 벤더는 공공 통신 사업자의 입찰에서 우선 공급업체 지위를 확보할 수 있으며, 중기적인 성장 전망이 개선됩니다.
100 Gbaud를 초과하는 설계의 복잡성과 열 관리의 한계
심볼 레이트를 100 Gbaud 이상으로 높이면 열 부하가 증가하고, 마이크로파 신호와 광 신호 간의 속도 정합이 과제가 됩니다. MIT 링컨 연구소의 인덕턴스 조정형 전극은 50옴의 임피던스를 유지하면서 대역폭을 100GHz 이상으로 확장하지만, 이러한 혁신적인 기술을 제조 가능한 모듈에 통합하는 것은 여전히 어렵습니다. 특수 기판이나 액체 금속 열 비아는 BOM을 상승시키고 인증 주기를 길게 만들어, 단기적인 공급 다양성을 제한하고 CAGR을 낮추고 있습니다.
부문 분석
위상 변조기는 여전히 코히런트 검출의 기반이 되고 있으므로, 2025년에는 광변조기 시장 점유율의 37.65%를 차지했습니다. 그러나 코패키지드 광학은 전력 소비와 지연을 줄이는 단일 기판 설계에 의존하고 있기 때문에 집적형 변조기 칩은 18.05%라는 가장 높은 CAGR을 나타낼 것으로 전망됩니다. Tower Semiconductor와 같은 파운드리 업체들이 400G/레인 유닛의 인증을 진행함에 따라, 집적형 칩과 관련된 광변조기 시장 규모는 확대되고 있습니다.
기존의 진폭 및 편광 소자는 계속해서 직접 검출 및 센싱 용도로 사용되고 있습니다. 아날로그 변조기는 속도보다 선형성이 중시되는 RoF(Radio-over-Fiber) 분야에서 틈새 시장 지위를 유지하고 있습니다. 웨이퍼 레벨 테스트로의 전환이 평균 판매 가격(ASP) 하락을 촉진하고 있으며, 이는 포토닉스와 일렉트로닉스의 공동 설계에 정통한 신규 진출기업들을 유인하고 있습니다.
리튬 니오브산은 뛰어난 전기광학 계수와 온도 안정성 덕분에 43.55%의 시장 점유율을 차지했습니다. 그러나 CMOS 팹이 대량 생산과 저비용화를 실현함에 따라 실리콘 포토닉스는 연평균 성장률(CAGR) 18.25%로 급성장하고 있습니다. 대규모 클라우드 사업자들이 엔드투엔드 방식으로 단일 공급업체의 포토닉 IC를 요구함에 따라, 실리콘 포토닉스에 기인한 광변조기 시장 규모는 확대되고 있습니다. 인듐 인화물은 집적 레이저가 필수적인 분야에서 여전히 확고한 입지를 유지하고 있는 반면, 전기광학 폴리머는 100GHz를 초과하는 마이크로파 포토닉스에 대응하고 있으나, 신뢰성과 관련된 과제는 여전히 남아 있습니다.
지역별 분석
2025년, 아시아태평양은 광변조기 시장 점유율의 38.35%를 차지했습니다. 이는 중국의 수직 통합형 트랜시버 생태계와 인도의 통신 타워 광섬유화를 위한 신속한 노력에 힘입은 결과입니다. 지역 내 제조거점이 잘 갖춰져 있어 부품 원가(BOM)를 낮게 유지할 수 있으며, 5G 및 FTTH 서비스 지역 전반에 걸쳐 신속한 확장이 가능해졌습니다. 정부의 보조금 프로그램과 현지 조달 의무도 생산을 더욱 공고히 하고 있습니다. 북미에서는 시장이 성숙 단계에 접어들었음에도 불구하고 혁신 주도형 수요가 나타나고 있습니다. 하이퍼스케일 사업자와 주요 방위 산업체들이 AI 패브릭 및 양자 연구를 지원하기 위해 최첨단 박막 LiNbO3 및 실리콘 포토닉스를 채택하고 있습니다. 유럽에서는 메트로 네트워크의 꾸준한 업그레이드가 지속되고 있으며, 자동차용 LiDAR 및 산업용 센싱이 아날로그 및 편파 변조기에 대한 새로운 관련 시장을 개척하고 있습니다. 이러한 성숙한 지역의 광변조기 시장 규모는 기술 혁신을 통해 확대되고 있으며, 이는 신흥 경제국에서의 수량 주도적 성장과는 대조적입니다.
기타 혜택:
- 엑셀 형식 시장 예측(ME) 시트
- 3개월간의 애널리스트 지원
자주 묻는 질문
목차
제1장 서론
제2장 조사 방법
제3장 주요 요약
제4장 시장 구도
제5장 시장 규모와 성장 예측
제6장 경쟁 구도
제7장 시장 기회와 향후 전망
JHS 26.09.09According to Mordor Intelligence, the optical modulators market size is expected to grow from USD 6.67 billion in 2025 to USD 7.83 billion in 2026 and is forecast to reach USD 17.45 billion by 2031 at 17.41% CAGR over 2026-2031.
This report is Segmented by Product Type (Amplitude Modulators, Polarization Modulators, and More), Material Platform (Lithium Niobate, Indium Phosphide, and More), Data-Rate Class (Less Than or Equal To 25 Gbps, 25 - 50 Gbps, and More), Application (Optical Communication, Fiber-Optic Sensors, and More), and Geography. The Market Forecasts are Provided in Terms of Value (USD).
Global Optical Modulators Market Trends and Insights
Rising investments in optical-fiber communication infrastructure
Record AI cluster build-outs lifted 800 G transceiver shipments past 20 million units in 2024 as cloud providers chased lower cost-per-bit metrics. The pivot from 400 G to 800 G, and early 1.6 T proof-points such as Ciena's 1.6 T coherent-lite demo using 224 G SerDes, compel modulators to hit 100 Gbaud symbol rates without breaking power budgets. Linear pluggable optics are doubling from USD 5 billion in 2024 to more than USD 10 billion by 2026, amplifying short-term demand for compact, low-Vπ architectures. Thermal design margins tighten inside co-packaged optics, rewarding integrated suppliers that can co-optimize driver ICs and modulator waveguides on the same substrate. As switch ASIC roadmaps lock in 51 T and 102 T fabrics, optical-engine attach rates accelerate, reinforcing the driver's positive impact on near-term CAGR.
Accelerated 5G and FTTH rollout in emerging economies
India's monthly fiber deployment spiked to 101,550 km after 5G launch, six times the pre-5G run-rate, underlining how policy targets such as 70% tower fiberization translate into real optical component pull-through. Each small cell needs at least one 25 G or 50 G optical fronthaul link, so modulators tuned for cost and temperature resilience see large-volume orders. Chinese cloud operators generated a USD 2-3 billion domestic transceiver market in 2024, reinforcing regional procurement cycles that ripple through modulator fabs. Vendors able to qualify devices under wide environmental ranges win preferred-supplier status in public-telecom tenders, elevating medium-term growth prospects.
Design complexity and thermal-management limits above 100 Gbaud
Pushing symbol rates past 100 Gbaud inflates thermal load and challenges velocity matching between microwave and optical signals. MIT Lincoln Laboratory's inductance-tuned electrodes stretch bandwidth beyond 100 GHz while holding 50-ohm impedance, but packaging such innovations into manufacturable modules remains difficult. Exotic substrates and liquid-metal thermal vias raise BOM and lengthen qualification cycles, limiting short-term supply diversity and depressing CAGR.
Other drivers and restraints analyzed in the detailed report include:
- Move to coherent optics >= 400 G on metro/long-haul links
- Commercialization of lithium-niobate-on-insulator (LNOI) modulators
- High BOM cost of InP/LiNbO3 wafers and poling processes
For complete list of drivers and restraints, kindly check the Table Of Contents.
Segment Analysis
Phase modulators owned 37.65% of the optical modulators market share in 2025 as they remain fundamental for coherent detection. Integrated modulator chips, however, will post the strongest 18.05% CAGR because co-packaged optics depends on single-substrate designs that trim power and latency. The optical modulators market size tied to integrated chips expands as foundries like Tower Semiconductor qualify 400 G-per-lane units.
Established amplitude and polarization devices continue serving direct-detection and sensing. Analog modulators keep niche radio-over-fiber footholds where linearity trumps speed. The shift toward wafer-level test drives ASP reduction, inviting new entrants that master photonic-electronic co-design.
Lithium niobate held a 43.55% share thanks to its superior electro-optic coefficient and temperature stability. Yet silicon photonics is accelerating at 18.25% CAGR because CMOS fabs unlock high-volume, low-cost runs. The optical modulators market size attributable to silicon photonics rises as large cloud buyers demand single-supplier photonic ICs end-to-end. Indium phosphide retains a foothold where integrated lasers are mandatory, while electro-optic polymers address >100 GHz microwave photonics, though reliability hurdles persist.
Complete Report Scope:
- By Product Type
- Amplitude Modulators
- Polarization Modulators
- Phase Modulators
- Analog Modulators
- Integrated (SiPh/InP/LNOI) Modulator Chips
- By Material Platform
- Lithium Niobate (LiNbO?)
- Indium Phosphide (InP)
- Silicon Photonics (SiPh)
- Electro-optic Polymer
- Others
- By Data-Rate Class
- Less than or Equal to 25 Gbps
- 25 - 50 Gbps
- 50 - 100 Gbps
- Greater than 100 Gbps
- By Application
- Optical Communication
- Datacentre Interconnect
- 5 G Fronthaul / Backhaul
- Sub-sea Cables
- Metro / Long-haul
- Fiber-optic Sensors
- Industrial and Structural Health
- Oil and Gas Monitoring
- Space and Defence
- Test and Measurement Equipment
- Quantum Computing and Cryogenic Links
- Optical Communication
- By Geography
- North America
- United States
- Canada
- Mexico
- South America
- Brazil
- Argentina
- Rest of South America
- Europe
- Germany
- United Kingdom
- France
- Italy
- Spain
- Russia
- Rest of Europe
- Asia-Pacific
- China
- Japan
- India
- South Korea
- South-East Asia
- Rest of Asia-Pacific
- Middle East and Africa
- Middle East
- Saudi Arabia
- United Arab Emirates
- Turkey
- Rest of Middle East
- Africa
- South Africa
- Nigeria
- Rest of Africa
- Middle East
- North America
Geography Analysis
Asia-Pacific accounted for 38.35% of the optical modulators market share in 2025, fueled by China's vertically integrated transceiver ecosystem and India's sprint to fiberize towers. Regional manufacturing depth keeps BOM low, allowing rapid deployment across 5G and FTTH footprints. Government subsidy programs and local sourcing mandates further anchor production. North America shows mature but innovation-led demand, with hyperscale operators and defense primes adopting cutting-edge thin-film LiNbO3 and silicon photonics to support AI fabrics and quantum research. Europe maintains steady upgrades in metro networks while automotive LiDAR and industrial sensing open adjacencies for analog and polarization modulators. The optical modulators market size in these mature regions grows via technology refresh, contrasting with volume-driven expansion in emerging economies.
- Lumentum Holdings Inc.
- Fujitsu Optical Components Ltd.
- Thorlabs Inc.
- Hamamatsu Photonics K.K.
- Lightwave Logic Inc.
- Gooch and Housego PLC
- APE Angewandte Physik and Elektronik GmbH
- AA Opto-Electronic SAS
- Conoptics Inc.
- L3Harris Technologies Inc.
- AMS Technologies AG
- Sumitomo Electric Device Innovations USA Inc.
- iXblue Photonics (Exail)
- Ciena Corporation
- Civicom Photonics
- HyperLight Corp.
- Keysight Technologies Inc.
- ThinkPhotonics Ltd.
- Optilab LLC
- Mellanox Technologies (NVIDIA Photonics)
Additional Benefits:
- The market estimate (ME) sheet in Excel format
- 3 months of analyst support
TABLE OF CONTENTS
1 INTRODUCTION
- 1.1 Study Assumptions and Market Definition
- 1.2 Scope of the Study
2 RESEARCH METHODOLOGY
3 EXECUTIVE SUMMARY
4 MARKET LANDSCAPE
- 4.1 Market Overview
- 4.2 Market Drivers
- 4.2.1 Rising investments in optical-fiber communication infrastructure
- 4.2.2 Hyperscale datacenter expansion and 800 G/1.6 T optics road-map
- 4.2.3 Accelerated 5 G and FTTH rollout in emerging economies
- 4.2.4 Move to coherent optics greater than or equal to?400 G on metro/long-haul links
- 4.2.5 Commercialisation of lithium-niobate-on-insulator (LNOI) modulators
- 4.2.6 Quantum photonics and cryogenic interconnect demand
- 4.3 Market Restraints
- 4.3.1 Design complexity and thermal-management limits above 100 Gbaud
- 4.3.2 High BOM cost of InP/LiNbO? wafers and poling processes
- 4.3.3 Skilled-labour shortage in high-speed photonics packaging
- 4.3.4 Upstream lithium-ore supply-chain concentration risk
- 4.4 Industry Supply-Chain Analysis
- 4.5 Regulatory Landscape
- 4.6 Impact of Macroeconomic Factors
- 4.7 Technological Outlook
- 4.8 Porter's Five Forces Analysis
- 4.8.1 Bargaining Power of Suppliers
- 4.8.2 Bargaining Power of Consumers
- 4.8.3 Threat of New Entrants
- 4.8.4 Threat of Substitutes
- 4.8.5 Intensity of Competitive Rivalry
5 MARKET SIZE AND GROWTH FORECASTS (VALUE)
- 5.1 By Product Type
- 5.1.1 Amplitude Modulators
- 5.1.2 Polarization Modulators
- 5.1.3 Phase Modulators
- 5.1.4 Analog Modulators
- 5.1.5 Integrated (SiPh/InP/LNOI) Modulator Chips
- 5.2 By Material Platform
- 5.2.1 Lithium Niobate (LiNbO?)
- 5.2.2 Indium Phosphide (InP)
- 5.2.3 Silicon Photonics (SiPh)
- 5.2.4 Electro-optic Polymer
- 5.2.5 Others
- 5.3 By Data-Rate Class
- 5.3.1 Less than or Equal to 25 Gbps
- 5.3.2 25 - 50 Gbps
- 5.3.3 50 - 100 Gbps
- 5.3.4 Greater than 100 Gbps
- 5.4 By Application
- 5.4.1 Optical Communication
- 5.4.1.1 Datacentre Interconnect
- 5.4.1.2 5 G Fronthaul / Backhaul
- 5.4.1.3 Sub-sea Cables
- 5.4.1.4 Metro / Long-haul
- 5.4.2 Fiber-optic Sensors
- 5.4.2.1 Industrial and Structural Health
- 5.4.2.2 Oil and Gas Monitoring
- 5.4.3 Space and Defence
- 5.4.4 Test and Measurement Equipment
- 5.4.5 Quantum Computing and Cryogenic Links
- 5.4.1 Optical Communication
- 5.5 By Geography
- 5.5.1 North America
- 5.5.1.1 United States
- 5.5.1.2 Canada
- 5.5.1.3 Mexico
- 5.5.2 South America
- 5.5.2.1 Brazil
- 5.5.2.2 Argentina
- 5.5.2.3 Rest of South America
- 5.5.3 Europe
- 5.5.3.1 Germany
- 5.5.3.2 United Kingdom
- 5.5.3.3 France
- 5.5.3.4 Italy
- 5.5.3.5 Spain
- 5.5.3.6 Russia
- 5.5.3.7 Rest of Europe
- 5.5.4 Asia-Pacific
- 5.5.4.1 China
- 5.5.4.2 Japan
- 5.5.4.3 India
- 5.5.4.4 South Korea
- 5.5.4.5 South-East Asia
- 5.5.4.6 Rest of Asia-Pacific
- 5.5.5 Middle East and Africa
- 5.5.5.1 Middle East
- 5.5.5.1.1 Saudi Arabia
- 5.5.5.1.2 United Arab Emirates
- 5.5.5.1.3 Turkey
- 5.5.5.1.4 Rest of Middle East
- 5.5.5.2 Africa
- 5.5.5.2.1 South Africa
- 5.5.5.2.2 Nigeria
- 5.5.5.2.3 Rest of Africa
- 5.5.5.1 Middle East
- 5.5.1 North America
6 COMPETITIVE LANDSCAPE
- 6.1 Market Concentration
- 6.2 Strategic Moves
- 6.3 Market Share Analysis
- 6.4 Company Profiles (includes Global-level Overview, Market-level Overview, Core Segments, Financials as available, Strategic Information, Market Rank/Share, Products and Services, Recent Developments)
- 6.4.1 Lumentum Holdings Inc.
- 6.4.2 Fujitsu Optical Components Ltd.
- 6.4.3 Thorlabs Inc.
- 6.4.4 Hamamatsu Photonics K.K.
- 6.4.5 Lightwave Logic Inc.
- 6.4.6 Gooch and Housego PLC
- 6.4.7 APE Angewandte Physik and Elektronik GmbH
- 6.4.8 AA Opto-Electronic SAS
- 6.4.9 Conoptics Inc.
- 6.4.10 L3Harris Technologies Inc.
- 6.4.11 AMS Technologies AG
- 6.4.12 Sumitomo Electric Device Innovations USA Inc.
- 6.4.13 iXblue Photonics (Exail)
- 6.4.14 Ciena Corporation
- 6.4.15 Civicom Photonics
- 6.4.16 HyperLight Corp.
- 6.4.17 Keysight Technologies Inc.
- 6.4.18 ThinkPhotonics Ltd.
- 6.4.19 Optilab LLC
- 6.4.20 Mellanox Technologies (NVIDIA Photonics)
7 MARKET OPPORTUNITIES AND FUTURE OUTLOOK
- 7.1 White-space and Unmet-need Assessment