

|
시장보고서
상품코드
2123333
플라즈마 에칭 장비 시장 : 점유율 분석, 업계 동향과 통계, 성장 예측(2026-2031년)Plasma Etching Equipment - Market Share Analysis, Industry Trends & Statistics, Growth Forecasts (2026 - 2031) |
||||||
 Mordor Intelligence
Mordor Intelligence에 의하면, 플라즈마 에칭 장비 시장 규모는 2025년에 133억 6,000만 달러, 2026년에 143억 4,000만 달러가 되어, 2031년까지 204억 2,000만 달러에 이를 것으로 예측되며, 2026년부터 2031년까지 CAGR 7.32%로 성장할 전망입니다.
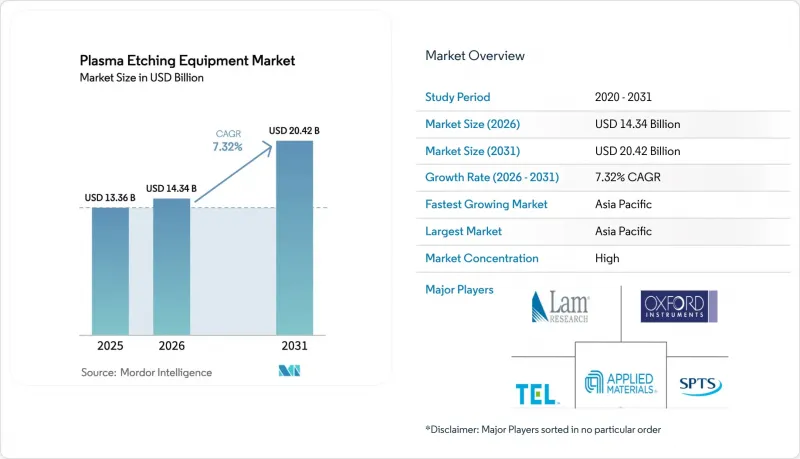
본 보고서는 유형(반응성 이온 에칭, 유도 결합 플라즈마 에칭 등), 웨이퍼 크기(150mm 미만, 200mm, 기타),소재(실리콘, 화합물 반도체 등), 용도(소비자용 전자기기, 산업용, 의료기기 등), 최종 사용자(주조 등), 지역별로 분류되어 있습니다. 시장 전망은 금액(달러) 기준으로 제시되어 있습니다.
세계 플라즈마 에칭 장비 시장 동향 및 인사이트
EUV 리소그래피의 확대가 높은 종횡비 에칭 수요를 견인
극자외선(EUV) 리소그래피는 2025년에 3nm 노드에서 파일럿 라인에서 양산 단계로 전환될 예정이며, 2027년까지 2nm 노드에 도입될 예정입니다. 각 EUV 공정 단계에서 콘택트 홀, 비아, 게이트 스페이서는 종횡비 120:1을 초과해야 하며, 크리티컬 디멘션이 10nm 미만이 되기 때문에 에칭 강도가 향상되고 있습니다. ASML은 2025년 1분기에 20대의 EUV 스캐너를 출하하여 전년 동기 대비 33% 증가했습니다. 각 스캐너에는 여러 개의 유도 결합 플라즈마(ICP) 챔버가 결합되어 있습니다. IBM은 게이트 스택당 14개의 개별 에칭 단계가 필요한 나노시트 트랜지스터의 검증에 성공했는데, 이는 핀 FET 노드에 비해 복잡성이 2배 증가한 것입니다. 그 결과, 2025년에는 에칭 장비에 대한 설비 투자가 팹 총 지출의 18-22%로 상승했습니다. 장비 제조업체들은 마이크로 트렌칭을 억제하기 위해 실시간 엔드포인트 분광 측정 기능을 탑재하고 있으며, 팹 업체들은 사이드월의 뒤틀림을 1도 이내로 억제하는 초저바이어스 공정을 실행할 수 있도록 레시피 라이브러리를 재검토하고 있습니다.
3D NAND 및 DRAM의 노드 미세화 진전
삼성은 2024년, 286층의 수직 NAND 제품을 발표했습니다. 이 제품에는 15µm을 초과하는 에칭 깊이와 2도 미만의 테이퍼가 요구되므로, 종횡비에 따른 지연을 완화하도록 조정된 심층 반응성 이온 에칭 장비에 대한 수요가 증가하고 있습니다. SK하이닉스는 2025년에 출시된 1-α-nm DRAM에서 고-k 유전체를 보호하기 위해 원자층 에칭을 채택했습니다. 한편, 실리콘 산화막과 질화막 간의 선택성을 향상시키기 위해 0°C 이하로 냉각하는 극저온 공정의 인증이 진행되고 있습니다. SEMI의 추산에 따르면, 메모리 제조업체들은 2025년에 450억 달러를 설비 투자에 지출했으며, 그 중 20%가 에칭 장비에 할당되었습니다. 3D NAND의 층 수 증가와 DRAM의 커패시터 피치 미세화로 인해, 2031년까지 매년 에칭 공정의 단계 수는 계속 증가할 전망입니다.
5nm 미만 구조에서의 플라즈마 유발 손상
에칭 공정 중 이온 충돌로 인해 발생하는 격자 결함, 전하 축적 및 계면 거칠기는 게이트 산화막 두께가 1 nm에 가까워지면 구동 전류를 저하시키고 임계 전압을 변화시킵니다. 원자층 에칭은 손상을 줄여주지만, 사이클 시간을 3배로 늘리기 때문에 웨이퍼당 비용이 증가합니다. 도쿄 일렉트론의 최신 원자층 에칭 플랫폼은 1사이클당 0.5 nm를 에칭할 수 있지만, 10 nm 트렌치를 에칭하려면 약 200사이클이 소요됩니다. 반면, 연속 플라즈마 에칭은 30초 만에 완료됩니다. 따라서 팹에서는 가장 민감한 층에만 원자층 에칭 기법을 제한하고, 중요도가 낮은 영역에서는 제어된 손상을 허용하고 있습니다.
부문 분석
2025년에는 유도 결합 플라즈마(ICP) 플랫폼이 플라즈마 에칭 장비 시장 규모의 46.83%를 차지하며 가장 큰 기여도를 보였습니다. 이온 에너지와 플라즈마 밀도를 분리할 수 있기 때문에 팹은 이방성을 미세 조정하여 깨지기 쉬운 핀이나 나노 시트를 보호할 수 있습니다. 2031년까지 연평균 성장률(CAGR) 7.99%를 나타낼 것으로 예측되는 심층 반응 이온(DRI) 장치는 종횡비 20:1 이상, 깊이 50-100µm의 깊이가 필요한 실리콘 관통 비아(TSV) 및 웨이퍼 레벨 패키징에 필수적이며, 이에 따라 이 부문이 차지하는 플라즈마 에칭 장비 시장 점유율은 확대되고 있습니다. 기존의 반응성 이온 에칭 장비는 성숙한 노드에서 여전히 수요가 있지만, 점차 트레일링 엣지 파운드리 라인으로 이동하고 있습니다.
램 리서치의 ‘Sense.i’ 플랫폼은 머신 러닝을 활용한 실시간 바이어스 조정 기능을 채택하여, 2025년 이후 콘택트 홀 에칭의 수율을 약 3퍼센트 포인트 향상시켰습니다. 애플라이드 머티리얼즈는 Centris Sym3에 인-시추(in-situ) 측정 기능을 추가하여 챔버 간 편차를 0.3nm 미만으로 줄였습니다. 이는 2nm 게이트 올 어라운드(Gate-All-Around)형 트랜지스터에 필수적인 요건입니다. 이처럼 플라즈마 기술과 데이터 사이언스의 융합이 진행됨에 따라 장비 카테고리 간의 기존 경계가 모호해지고, 공급업체 간의 경쟁이 격화되고 있습니다.
2025년 수요 중 300mm 포맷이 51.73%를 차지하며 플라즈마 에칭 장비 시장 규모를 지탱했습니다. 이는 대만 반도체 제조 회사(TSMC), 삼성,인텔이 이 직경의 팹을 합쳐 50곳 이상 가동하고 있었기 때문입니다. 450mm를 초과하는 파일럿 프로젝트가 활발해지고 있으며, 업계 컨소시엄이 규모의 경제성을 재검토하는 가운데, 이 부문은 2031년까지 연평균 8.33%의 성장이 예상됩니다. 인텔은 2024년에 450mm 파일럿 사업을 제한적으로 재개하고, 150억 달러로 예상되는 설비 개조 비용을 정당화하기 위해 웨이퍼 1장당 다이 수를 40% 늘리는 것을 목표로 하고 있습니다.
화합물 반도체 제조업체들은 실리콘 카바이드(SiC) 및 갈륨 나이탈리아드(GaN) 소자의 다이당 비용을 절감하기 위해 150mm 및 200mm 라인에서 300mm 라인으로 전환하고 있으며, 이에 따라 300mm용 장비 수요가 더욱 확대되고 있습니다. SEMI는 2025년 6월, 화합물 웨이퍼의 에칭 균일성 및 결함 사양을 인증하기 위한 최신 규격을 발표했으며, 부식성이 강한 화학 약품에 대응하기 위해 공급업체가 챔버 재질을 재설계할 수 있는 지침을 제시했습니다.
지역별 분석
아시아태평양은 2025년에 매출의 55.72%를 차지하고 연평균 성장률(CAGR) 8.66%를 달성할 것으로 예측되며, 플라즈마 에칭 장비 시장에서 계속해서 주도적인 위치를 유지할 것으로 확실시되고 있습니다. 대만의 반도체 클러스터는 2025년에 1,600억 달러의 생산액을 기록했으며, 이는 전 세계 파운드리 매출의 65%를 차지했습니다. 같은 해 한국은 DRAM의 70%, NAND의 45%를 생산하며 메모리 거점으로서의 입지를 공고히 했습니다. 수출 규제로 제약을 받은 중국은 국내산 장비 도입을 가속화하여, SMIC(중신국제집적회로제조유한공사) 및 화홍반도체가 14nm 및 28nm 공정을 위해 NAURA사와 Advanced Micro-Fabrication Equipment사의 시스템을 인증했습니다. 일본은 국내 생산 능력 확대를 위해 2조 엔(135억 달러)을 배정하며 투자를 재개했고, 대만 반도체 제조 회사(TSMC), 마이크론, 웨스턴 디지털을 유치했습니다.
북미는 2025년 수요의 약 25%를 차지하고 있으며, CHIPS법에 따른 자금이 애리조나주, 오하이오주, 뉴욕주, 텍사스주의 팹 건설을 지원함에 따라 7.8%의 성장이 예상됩니다. 인텔이 오하이오주에 건설할 2개의 팹으로 구성된 캠퍼스만 해도 2028년까지 200대 이상의 에칭 챔버가 필요할 것으로 예측됩니다. 대만 반도체 제조 회사(TSMC)의 애리조나 복합 시설에는 2030년까지 3개의 팹이 설치되어 연간 총 60만 웨이퍼의 생산 능력을 갖출 예정이며, 모든 팹에 최첨단 플라즈마 장비가 도입될 것입니다.
유럽은 2025년에 약 10%의 점유율을 차지했으나, 430억 유로 규모의 EU 칩법 배분을 바탕으로 2030년까지 전 세계 반도체 생산량의 20%를 확보하는 것을 목표로 하고 있습니다. 인텔의 마그데부르크 프로젝트, ST마이크로일렉트로닉스와 세계파운드리(GF)의 프랑스 합작 시설, 인피니언의 드레스덴 확장 계획은 이미 발표된 투자액만으로도 800억 유로(870억 달러) 이상에 달할 전망입니다. 중동 및 아프리카는 여전히 검토 단계에 있으며, 아부다비와 리야드는 설계 및 패키징 거점 구축을 추진하고 있습니다. 남미의 활동은 브라질과 아르헨티나의 조립 사업에 국한되어 있지만, 호주 및 뉴질랜드는 조사에 기여하고는 있으나 대규모 제조에는 관여하지 않고 있습니다.
기타 혜택:
- 엑셀 형식 시장 예측(ME) 시트
- 3개월간의 애널리스트 지원
자주 묻는 질문
목차
제1장 서론
제2장 조사 방법
제3장 주요 요약
제4장 시장 구도
제5장 시장 규모와 성장 예측
제6장 경쟁 구도
제7장 시장 기회와 향후 전망
JHS 26.09.07According to Mordor Intelligence, the plasma etching equipment market size is projected to be USD 13.36 billion in 2025, USD 14.34 billion in 2026, and reach USD 20.42 billion by 2031, growing at a CAGR of 7.32% from 2026 to 2031.
This report is Segmented by Type (Reactive Ion Etching, Inductively Coupled Plasma Etching, and More), Wafer Size (Below 150 Mm, 200 Mm, and More), Material (Silicon, Compound Semiconductors, and More), Application (Consumer Electronics, Industrial, Medical Devices, and More), End User (Foundries, and More), and Geography. The Market Forecasts are Provided in Terms of Value (USD).
Global Plasma Etching Equipment Market Trends and Insights
Expansion of EUV Lithography Driving High Aspect-Ratio Etch Requirements
Extreme ultraviolet lithography transitioned from pilot lines to high-volume manufacturing at the 3 nm node in 2025 and is slated for adoption at the 2 nm node by 2027. Each EUV step increases etch intensity because contact holes, vias, and gate spacers now require aspect ratios exceeding 120:1, with critical dimensions below 10 nm. ASML shipped 20 EUV scanners in Q1 2025, a 33% year-over-year increase, and every scanner is paired with multiple inductively coupled plasma chambers. IBM validated nanosheet transistors that require 14 separate etch steps per gate stack, doubling complexity over finFET nodes. Capital outlays for etch tools consequently rose to 18-22% of total fab spending in 2025. Tool makers are embedding real-time endpoint spectroscopy to suppress micro-trenching, and fabs are revising recipe libraries to execute ultra-low bias processes that cut sidewall bowing to within 1 degree.
Proliferation of 3D NAND and DRAM Node Shrinks
Samsung disclosed a 286-layer vertical NAND product in 2024 that necessitates etch depths exceeding 15 µm with sub-2-degree taper, magnifying demand for deep reactive ion equipment calibrated to mitigate aspect-ratio-dependent lag. SK Hynix adopted atomic layer etching to protect high-k dielectrics in its 1-alpha-nm DRAM, launched in 2025. Meanwhile, cryogenic processes cooled below 0 °C are being qualified to improve selectivity between silicon oxide and nitride. SEMI estimated memory companies spent USD 45 billion on capital equipment in 2025, 20% of which was devoted to etch platforms. High layer counts in 3D NAND and shrinking capacitor pitches in DRAM will keep etch process steps rising each year through 2031.
Plasma-Induced Damage in Sub-5 nm Structures
Lattice defects, charge accumulation, and interface roughness caused by ion bombardment during etch steps cut drive current and shift threshold voltage when the gate oxide thickness approaches 1 nm. Atomic layer etching reduces damage but triples the cycle time, thereby increasing the cost per wafer. Tokyo Electron's latest atomic layer platform removes 0.5 nm per cycle but requires approximately 200 cycles to clear a 10 nm trench, compared to 30 seconds for a continuous plasma etch. Fabs are therefore limiting atomic layer methods to the most sensitive layers while accepting controlled damage in less critical regions.
Other drivers and restraints analyzed in the detailed report include:
- Growing Demand for Compound-Semiconductor Power Devices
- Government-Backed Chip Sovereignty Programs
- Rising Clean-Room Construction and Utility Costs
For complete list of drivers and restraints, kindly check the Table Of Contents.
Segment Analysis
Inductively coupled plasma platforms generated the largest plasma etching equipment market size contribution at 46.83% in 2025. Their capacity to decouple ion energy from plasma density lets fabs fine-tune anisotropy and protect fragile fins and nanosheets. Deep reactive ion equipment, projected to grow at a 7.99% CAGR through 2031, is key for through-silicon vias and wafer-level packaging that require depths of 50-100 µm at aspect ratios of greater than 20:1, thereby expanding the plasma etching equipment market share held by this segment. Conventional reactive ion tools remain in demand at mature nodes but are gradually migrating toward trailing-edge foundry lines.
Lam Research's Sense.i platform employs machine learning for real-time bias adjustments that have raised yield by roughly 3 percentage points in contact-hole etch since 2025. Applied Materials added in-situ metrology to its Centris Sym3 to cut chamber-to-chamber variation below 0.3 nm, a necessity for 2 nm gate-all-around transistors. This convergence of plasma and data science is blurring legacy boundaries between tool categories and intensifying supplier competition.
The 300 mm format accounted for 51.73% of 2025 demand, anchoring the plasma etching equipment market size because Taiwan Semiconductor Manufacturing Company, Samsung, and Intel collectively ran more than 50 fabs on this diameter. Above-450 mm pilot work is picking up, and the segment is predicted to grow at 8.33% through 2031 as industry consortia revisit economies of scale. Intel restarted limited 450 mm pathfinding in 2024, seeking a 40% die-count boost per wafer to justify a projected USD 15 billion retrofit.
Compound-semiconductor makers are shifting from 150 mm and 200 mm to 300 mm lines to cut cost per die in silicon carbide and gallium nitride devices, further enlarging 300 mm tool requirements. SEMI released updated standards in June 2025 to certify etch uniformity and defect specifications for compound wafers, guiding suppliers in redesigning chamber materials for corrosive chemistries.
Complete Report Scope:
- By Type
- Reactive Ion Etching (RIE)
- Inductively Coupled Plasma Etching (ICP)
- Deep Reactive Ion Etching (DRIE)
- High Density Plasma Etching (HDPE)
- Other Types
- By Wafer Size
- Below 150 mm
- 200 mm
- 300 mm
- Above 450 mm
- By Material
- Silicon
- Compound Semiconductors
- Glass and Polymers
- Other Materials
- By Application
- Consumer Electronics
- Industrial
- Medical Devices
- Automotive Electronics
- Aerospace and Defense
- Other Applications
- By End User
- Foundries
- Integrated Device Manufacturers (IDMs)
- Research and Academic Institutions
- Other End Users
- By Geography
- North America
- United States
- Canada
- Mexico
- South America
- Brazil
- Argentina
- Rest of South America
- Europe
- United Kingdom
- Germany
- France
- Italy
- Spain
- Rest of Europe
- Asia-Pacific
- China
- Japan
- India
- South Korea
- Australia and New Zealand
- Rest of Asia Pacific
- Middle East and Africa
- Middle East
- Saudi Arabia
- United Arab Emirates
- Turkey
- Rest of Middle East
- Africa
- South Africa
- Nigeria
- Rest of Africa
- Middle East
- North America
Geography Analysis
The Asia-Pacific region generated 55.72% of the revenue in 2025 and is projected to achieve an 8.66% CAGR, ensuring it continues to dominate the plasma etching equipment market. Taiwan's cluster yielded USD 160 billion output in 2025, 65% of global foundry revenue. South Korea produced 70% of DRAM and 45% of NAND that year, cementing its position as the memory hub. China, constrained by export controls, accelerated the uptake of domestic tools, with Semiconductor Manufacturing International Corporation and Hua Hong Semiconductor qualifying NAURA and Advanced Micro-Fabrication Equipment systems for 14 nm and 28 nm flows. Japan reignited investment by allocating JPY 2 trillion (USD 13.5 billion) for local capacity, attracting Taiwan Semiconductor Manufacturing Company, Micron, and Western Digital.
North America represented roughly 25% of 2025 demand and is projected to grow 7.8% as CHIPS Act funds underwrite fabs in Arizona, Ohio, New York, and Texas. Intel's two-fab Ohio campus alone is expected to need more than 200 etch chambers by 2028. Taiwan Semiconductor Manufacturing Company's Arizona complex will host three fabs with combined capacity of 600,000 wafer starts per year by 2030, all equipped with leading-edge plasma tools.
Europe held about 10% share in 2025 but is aiming to capture 20% of global chip output by 2030 under the EUR 43 billion EU Chips Act allocation. Intel's Magdeburg project, STMicroelectronics-GlobalFoundries' French joint facility, and Infineon's Dresden expansion represent more than EUR 80 billion (USD 87 billion) in announced investments. Middle East and Africa remain in the exploratory phase, with Abu Dhabi and Riyadh pursuing design and packaging hubs. South America's activity is limited to assembly initiatives in Brazil and Argentina, while Australia and New Zealand contribute research but not large-scale fabrication.
- Applied Materials Inc.
- Lam Research Corporation
- Tokyo Electron Limited
- Hitachi High-Tech Corporation
- KLA - SPTS Technologies
- Oxford Instruments plc
- Advanced Micro-Fabrication Equipment Inc. (AMEC)
- NAURA Technology Group Co. Ltd.
- Plasma-Therm LLC
- Samco Inc.
- ULVAC Inc.
- Plasma Etch Inc.
- Sentech Instruments GmbH
- GigaLane Co. Ltd.
- Thierry Corporation
- Panasonic Factory Solutions Co.
- TRION Technology Inc.
- Veeco Instruments Inc.
- Mattson Technology Inc.
- CORIAL
Additional Benefits:
- The market estimate (ME) sheet in Excel format
- 3 months of analyst support
TABLE OF CONTENTS
1 INTRODUCTION
- 1.1 Study Assumptions and Market Definition
- 1.2 Scope of the Study
2 RESEARCH METHODOLOGY
3 EXECUTIVE SUMMARY
4 MARKET LANDSCAPE
- 4.1 Market Overview
- 4.2 Market Drivers
- 4.2.1 Expansion of EUV Lithography Driving High Aspect-Ratio Etch Requirements
- 4.2.2 Proliferation of 3D NAND and DRAM Node Shrinks
- 4.2.3 Growing Demand for Compound-Semiconductor Power Devices
- 4.2.4 Government-Backed Chip Sovereignty Programs (US CHIPS Act, EU Chips Act)
- 4.2.5 Shift Toward Heterogeneous Integration and Advanced Packaging
- 4.2.6 Emerging Use in Quantum Computing Device Fabrication
- 4.3 Market Restraints
- 4.3.1 Plasma-Induced Damage in Sub-5 nm Structures
- 4.3.2 Rising Clean-Room Construction and Utility Costs
- 4.3.3 Supply Chain Volatility for High-Purity Specialty Gases
- 4.3.4 IP Restrictions Limiting Equipment Exports to China
- 4.4 Value Chain Analysis
- 4.5 Regulatory Landscape
- 4.6 Technological Outlook
- 4.7 Porter's Five Forces Analysis
- 4.7.1 Bargaining Power of Suppliers
- 4.7.2 Bargaining Power of Consumers
- 4.7.3 Threat of New Entrants
- 4.7.4 Threat of Substitutes
- 4.7.5 Intensity of Competitive Rivalry
- 4.8 Assessment of Impact of Macroeconomic Factors
5 MARKET SIZE AND GROWTH FORECASTS (VALUE)
- 5.1 By Type
- 5.1.1 Reactive Ion Etching (RIE)
- 5.1.2 Inductively Coupled Plasma Etching (ICP)
- 5.1.3 Deep Reactive Ion Etching (DRIE)
- 5.1.4 High Density Plasma Etching (HDPE)
- 5.1.5 Other Types
- 5.2 By Wafer Size
- 5.2.1 Below 150 mm
- 5.2.2 200 mm
- 5.2.3 300 mm
- 5.2.4 Above 450 mm
- 5.3 By Material
- 5.3.1 Silicon
- 5.3.2 Compound Semiconductors
- 5.3.3 Glass and Polymers
- 5.3.4 Other Materials
- 5.4 By Application
- 5.4.1 Consumer Electronics
- 5.4.2 Industrial
- 5.4.3 Medical Devices
- 5.4.4 Automotive Electronics
- 5.4.5 Aerospace and Defense
- 5.4.6 Other Applications
- 5.5 By End User
- 5.5.1 Foundries
- 5.5.2 Integrated Device Manufacturers (IDMs)
- 5.5.3 Research and Academic Institutions
- 5.5.4 Other End Users
- 5.6 By Geography
- 5.6.1 North America
- 5.6.1.1 United States
- 5.6.1.2 Canada
- 5.6.1.3 Mexico
- 5.6.2 South America
- 5.6.2.1 Brazil
- 5.6.2.2 Argentina
- 5.6.2.3 Rest of South America
- 5.6.3 Europe
- 5.6.3.1 United Kingdom
- 5.6.3.2 Germany
- 5.6.3.3 France
- 5.6.3.4 Italy
- 5.6.3.5 Spain
- 5.6.3.6 Rest of Europe
- 5.6.4 Asia-Pacific
- 5.6.4.1 China
- 5.6.4.2 Japan
- 5.6.4.3 India
- 5.6.4.4 South Korea
- 5.6.4.5 Australia and New Zealand
- 5.6.4.6 Rest of Asia Pacific
- 5.6.5 Middle East and Africa
- 5.6.5.1 Middle East
- 5.6.5.1.1 Saudi Arabia
- 5.6.5.1.2 United Arab Emirates
- 5.6.5.1.3 Turkey
- 5.6.5.1.4 Rest of Middle East
- 5.6.5.2 Africa
- 5.6.5.2.1 South Africa
- 5.6.5.2.2 Nigeria
- 5.6.5.2.3 Rest of Africa
- 5.6.5.1 Middle East
- 5.6.1 North America
6 COMPETITIVE LANDSCAPE
- 6.1 Market Concentration
- 6.2 Strategic Moves
- 6.3 Market Share Analysis
- 6.4 Company Profiles (includes Global-level Overview, Market-level Overview, Core Segments, Financials as available, Strategic Information, Market Rank/Share, Products and Services, Recent Developments)
- 6.4.1 Applied Materials Inc.
- 6.4.2 Lam Research Corporation
- 6.4.3 Tokyo Electron Limited
- 6.4.4 Hitachi High-Tech Corporation
- 6.4.5 KLA - SPTS Technologies
- 6.4.6 Oxford Instruments plc
- 6.4.7 Advanced Micro-Fabrication Equipment Inc. (AMEC)
- 6.4.8 NAURA Technology Group Co. Ltd.
- 6.4.9 Plasma-Therm LLC
- 6.4.10 Samco Inc.
- 6.4.11 ULVAC Inc.
- 6.4.12 Plasma Etch Inc.
- 6.4.13 Sentech Instruments GmbH
- 6.4.14 GigaLane Co. Ltd.
- 6.4.15 Thierry Corporation
- 6.4.16 Panasonic Factory Solutions Co.
- 6.4.17 TRION Technology Inc.
- 6.4.18 Veeco Instruments Inc.
- 6.4.19 Mattson Technology Inc.
- 6.4.20 CORIAL
7 MARKET OPPORTUNITIES AND FUTURE OUTLOOK
- 7.1 White-Space and Unmet-Need Assessment


