

|
시장보고서
상품코드
2123387
의료용 임플란트 : 시장 점유율 분석, 업계 동향과 통계, 성장 예측(2026년-2031년)Medical Implants - Market Share Analysis, Industry Trends & Statistics, Growth Forecasts (2026 - 2031) |
||||||
 Mordor Intelligence
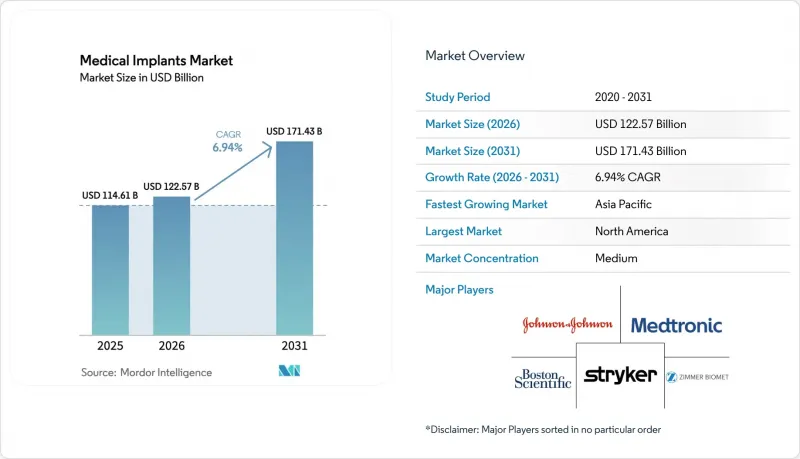
Mordor Intelligence에 의하면, 의료용 임플란트 시장 규모는 2025년에 1,146억 1,000만 달러로 평가되었고, 2026년 1,225억 7,000만 달러에서 2031년까지 1,714억 3,000만 달러에 이를 것으로 예측되며, 예측 기간(2026년-2031년) CAGR은 6.94%를 기록할 전망입니다.
본 보고서는 제품별(정형외과용, 심혈관용, 안과용 등), 소재별(금속, 폴리머, 세라믹 등), 기술별(기존, 3D 프린팅,스마트 센서 탑재 임플란트), 최종 사용자(병원, 전문 클리닉, 외래수술센터(ASC)), 지역(북미, 유럽, 아시아태평양 등)별로 분류되어 있습니다. 시장 예측은 금액(달러) 기준으로 제시되어 있습니다.
전 세계 의료용 임플란트 시장 동향 및 인사이트
고령화와 만성 질환 부담 증가가 임플란트 수요를 견인
2025년 시점에서 전 세계 65세 이상 성인 인구는 8억 5,700만 명에 달할 것으로 예상되며, 2030년까지 10억 명을 넘어설 것으로 전망되어, 이는 관절 치환술, 심박조율기, 안구 내 렌즈에 대한 지속적인 수요를 견인하고 있습니다. 미국 내 인공 슬관절 치환술의 총 시술 건수는 2025년에 120만 건에 달하여 2020년 대비 24% 증가했습니다. 한편, 같은 기간 동안 인공 고관절 치환술은 14% 증가했습니다. 심장용 의료기기의 보급도 이에 뒤이어, 2025년에는 380만 명의 미국인이 체내에 심박조율기나 제세동기를 이식한 채 생활하고 있었습니다. 전 세계 8억 5,000만 명이 앓고 있는 만성 신장 질환은 혈관 접근용 이식편 수요를 끌어올리고 있으며, 이 하위 부문은 2025년에 전년 대비 9%의 성장을 기록했습니다. 이러한 인구 통계학적 변화는 가치 기반 조달로 인한 가격 압박이 가중되는 상황 속에서도 향후 수십 년에 걸친 성장의 기반이 되고 있습니다.
미용 및 치과 선택적 수술의 확대가 새로운 환자층을 개척
유방 확대 수술 및 안면 윤곽 성형술과 같은 전 세계 선택적 미용 성형 수술은 소셜 미디어의 영향과 할부 결제를 통한 자금 조달의 보급에 힘입어 2023년부터 2025년에 걸쳐 크게 증가했습니다. 2025년에는 유방 임플란트 삽입 건수가 200만 개를 돌파했으며, 캡슐 수축 발생률이 낮다는 점 때문에 실리콘 젤 임플란트가 대부분을 차지했습니다. 2025년에는 미국에서만 300만 건에 가까운 치과 임플란트 수술이 시행되었습니다. 아시아태평양의 클리닉은 민간 네트워크를 통해 서유럽권 동종 제품보다 훨씬 저렴한 가격에 동등한 골유착성을 갖춘 지르코니아 및 티타늄 임플란트를 제공함으로써 두 자릿수 성장을 기록했습니다. 2025년에는 태국과 튀르키예에서 의료 관광이 치과 및 미용 임플란트 수익에 크게 기여했습니다. 이는 미국 가격에 비해 상당한 비용 절감이 실현되었기 때문입니다.
부문 분석
2025년 의료용 임플란트 시장에서 정형외과용 임플란트는 36.7%로 가장 큰 점유율을 차지했습니다. 이는 고령화에 따라 고관절, 무릎, 척추 수술이 증가한 것이 원인입니다. 치과용 기기는 규모는 작지만, 심미 치과 및 임플란트와 뼈의 결합성 향상으로 인해 8.12%라는 가장 높은 연평균 성장률(CAGR)을 기록하고 있습니다.
정형외과 분야의 주요 기업들은 수술 시간 단축을 위해 로봇 기술과 3D 프린팅에 주력하고 있는 반면, 치과 전문 기업들은 구강 내 스캐너와 설계 소프트웨어를 연동하는 디지털 워크플로우를 중시하고 있습니다. 심혈관용 임플란트는 23.14%를 차지하며, 메드트로닉(Medtronic)과 애보트(Abbott)의 심박조율기 및 경카테터 판막이 심부전 환자의 치료 성과를 향상시키고 있는 것이 그 기반이 되고 있습니다. 인공 와우 및 청각 임플란트는 소아 난청에 대한 적응 범위가 확대됨에 따라 7.26%의 성장률을 보였습니다. 유방 및 안면용 기기를 포함한 미용용 임플란트는 전 세계 선택적 수술 건수가 22% 증가하는 가운데 매출의 11.7%를 차지했습니다.
2025년에는 티타늄의 뛰어난 강도 대 중량 비율 덕분에 금속계 생체 재료가 의료용 임플란트 시장 점유율의 49.2%를 차지했습니다. 그러나 치유 후 용해되는 임플란트를 임상의들이 선호하는 경향이 있어, 생체 흡수성 폴리머는 2031년까지 연평균 성장률(CAGR) 7.57%를 기록할 전망입니다.
폴리에테르에테르케톤(PEEK) 등의 고분자 소재는 28.1%의 점유율을 차지하고 있으며, 수술 후 영상 진단에서 방사선 불투과성을 발휘합니다. 주로 지르코니아와 알루미나로 구성된 세라믹은 14.6%의 점유율을 차지하고 있으며, 그 높은 내마모성 덕분에 치과용 크라운이나 대퇴골두 분야에서 널리 사용되고 있습니다. 천연 유래의 흡수성 소재에는 막대한 연구개발비가 투입되었습니다. 스트라이커(Stryker)사는 안전하게 분해되는 스크류 개발에 막대한 투자를 단행하여, 영구 임플란트 제거에 따른 재수술률을 낮추는 데 주력했습니다. 티타늄 가격의 급등으로 인해 탄탈륨이나 니오브를 활용한 대체 소재의 연구 개발이 가속화되고 있습니다.
지역별 분석
북미는 1인당 수술 시행률이 가장 높고, 시장 출시까지의 기간을 단축하는 획기적인 의료기기의 신속 승인 절차가 마련되어 있어, 2025년 의료용 임플란트 시장의 41.3%를 차지했습니다. 최근 로봇 보조 관절 치환술이 메디케어 적용 대상이 됨에 따라 21억 달러 규모의 환급 여지가 생겨나, 병원들의 스트라이커(Striker) 사의 ‘Mako’ 및 지머 바이오메트(Zimmer Biomet) 사의 ‘Rosa’ 시스템 도입이 촉진되었습니다. 캐나다의 단일 지불자 제도에 따른 상한선 설정으로 인해 9개월의 대기 명단이 발생하고 있으며, 더 신속한 치료를 받기 위해 연간 1만 2,000명의 시민이 미국의 의료 기관을 방문하고 있습니다.
2025년에는 유럽이 전 세계 매출의 28.2%를 차지했으나, 의료기기 규정(MDR)에 따른 비용 부담으로 14개 중견 기업이 철수하면서 다국적 기업에 의한 공급 통합이 진행되었습니다. 대조적으로, 아시아태평양은 연평균 성장률(CAGR) 8.31%를 기록하며 향후 성장을 주도할 전망입니다. 중국의 ‘건강 중국 2030’ 이니셔티브에서는 2급 도시의 정형외과 치료에 대한 보험 적용 범위를 확대하기 위해 1,200억 위안(人民元)이 배정된 반면, 인도의 ‘아유슈만 바라트’ 제도에서는 현재 5억 명의 국민이 임플란트 수술에 대한 보험 적용 대상이 되고 있습니다. 일본의 환급 기준에 따르면 2년마다 의료기기 가격이 2% 인하되어 이익률이 압박받고 있지만, 인구의 28%가 이미 65세 이상인 만큼 수술 건수는 높은 수준을 유지하고 있습니다.
중동 및 아프리카 및 남미는 2025년에 총 14.6%의 점유율을 차지했습니다. 아랍에미리트(UAE)는 의료기기 제조업체를 유치하기 위해 심사 절차를 간소화한 후, 22개의 새로운 임플란트 모델을 승인했습니다. 브라질은 선천성 치과 임플란트를 공적 보험 적용 대상으로 확대하여 수혜자가 18만 명 증가했고, 이에 따라 수요가 3억 2,000만 달러 증가했습니다. 남아프리카공화국에서는 홍해의 혼란으로 인한 운송 지연 문제를 해결하기 위한 노력이 계속되고 있으며, 이에 따라 유통업체들은 현지 재고 허브를 구축하고 있습니다.
기타 혜택:
- 엑셀 형식 시장 예측(ME) 시트
- 3개월간의 애널리스트 지원
자주 묻는 질문
목차
제1장 서론
제2장 조사 방법
제3장 주요 요약
제4장 시장 구도
제5장 시장 규모와 성장 예측
제6장 경쟁 구도
제7장 시장 기회와 향후 전망
LSH 26.09.04According to Mordor Intelligence, the medical implants market size was valued at USD 114.61 billion in 2025 and is estimated to grow from USD 122.57 billion in 2026 to reach USD 171.43 billion by 2031, at a CAGR of 6.94% during the forecast period (2026-2031).
This report is Segmented by Product (Orthopedic, Cardiovascular, Ophthalmic, and More), Material (Metallic, Polymeric, Ceramic, and More), Technology (Conventional, 3D Printed, Smart Sensor-Enabled Implants), End-User (Hospitals, Specialty Clinics, Ambulatory Surgical Centers), and Geography (North America, Europe, APAC, and More). Market Forecasts are Provided in Value (USD)
Global Medical Implants Market Trends and Insights
Aging Population and Higher Chronic Disease Burden Propel Implant Volumes
Adults aged 65 and older numbered 857 million worldwide in 2025 and will exceed 1 billion by 2030, driving sustained demand for joint replacements, pacemakers, and intraocular lenses . Total knee arthroplasty procedures in the United States rose to 1.2 million in 2025, up 24% from 2020, while hip replacements increased 14% during the same period. Cardiac device adoption followed suit, with 3.8 million Americans living with implanted pacemakers or defibrillators in 2025. Chronic kidney disease, which affects 850 million people globally, boosts the need for vascular-access grafts, a subsegment that grew 9% year over year in 2025. These population dynamics underpin a multidecade growth runway even as price pressures mount from value-based procurement.
Expanding Elective Cosmetic and Dental Procedures Unlock New Patient Cohorts
Global elective cosmetic surgeries, such as breast augmentation and facial contouring, grew significantly between 2023 and 2025, helped by social-media influence and installment-based financing. Breast implant placements crossed over 2 million units in 2025, with silicone-gel devices making up the majority due to lower capsular contracture rates. The United States alone saw nearly 3 million dental-implant procedures in 2025. Asia-Pacific clinics captured double-digit growth as private networks offered zirconia and titanium implants at significantly lower prices than Western counterparts, yet with comparable osseointegration. Medical tourists contributed significantly to dental and cosmetic implant revenue in Thailand and Turkey in 2025. This was driven by substantial cost savings compared to U.S. pricing.
Other drivers and restraints analyzed in the detailed report include:
- Continuous Material Science Breakthroughs Enable Ultra-Light and Bio-Active Implants
- Large Language-Model Assisted Design Compresses R&D Timelines
- Intensifying Regulatory Scrutiny and Longer Approval Timelines Delay Market Entry
- High Device Cost and Limited Reimbursement Constrain Adoption in Emerging Markets
For complete list of drivers and restraints, kindly check the Table Of Contents.
Segment Analysis
Orthopedic implants contributed the largest slice of the medical implants market at 36.7% in 2025, benefiting from growing hip, knee, and spine surgeries among aging populations. Dental devices, although smaller, deliver the fastest 8.12% CAGR thanks to aesthetic dentistry and improved implant-bone integration.
Orthopedic leaders focus on robotics and 3D printing to shorten operating times, whereas dental specialists target digital workflows connecting intraoral scanners to design software. Cardiovascular implants held 23.14%, anchored by pacemakers and transcatheter valves from Medtronic and Abbott that improve outcomes in heart-failure patients. Cochlear and auditory implants grew 7.26% on wider indications for pediatric hearing loss. Cosmetic implants, including breast and facial devices, added 11.7% of revenue amid a 22% jump in global elective surgeries.
Metallic biomaterials represented 49.2% of the medical implants market share in 2025, owing to titanium's favorable strength-to-weight profile. Bioresorbable polymers, however, will post a 7.57% CAGR through 2031 as clinicians favor implants that dissolve post-healing.
Polymeric options such as poly-ether-ether-ketone held 28.1%, offering radiolucency for post-operative imaging. Ceramics, mainly zirconia and alumina, captured 14.6% and shine in dental crowns and femoral heads due to high wear resistance. Natural resorbables attracted major research and development spend; Stryker invested heavily to develop screws that degrade safely, lowering revision rates tied to permanent hardware removal. Rising titanium prices accelerate exploration of tantalum and niobium alternatives.
Complete Report Scope:
- By Product
- Orthopedic Implants
- Hip Orthopedic Devices
- Knee Orthopedic Devices
- Spine Orthopedic Devices
- Joint Reconstruction
- Other Orthopedic Products
- Cardiovascular Implants
- Pacing Devices
- Stents
- Structural Cardiac Implants
- Ophthalmic Implants
- Intra-ocular Lens
- Glaucoma Implants
- Dental Implants
- Cochlear & Auditory Implants
- Facial Implants
- Breast Implants
- Other Implants (neurostimulators, contraceptive, etc.)
- Orthopedic Implants
- By Material
- Metallic Biomaterials
- Polymeric Biomaterials
- Ceramic Biomaterials
- Natural / Bioresorbable Biomaterials
- By Technology
- Conventional Implants
- 3-D Printed / Additive Manufactured Implants
- Smart Sensor-Enabled Implants
- By End-User
- Hospitals
- Specialty Clinics
- Ambulatory Surgical Centers
- By Geography
- North America
- United States
- Canada
- Mexico
- Europe
- Germany
- United Kingdom
- France
- Italy
- Spain
- Rest of Europe
- Asia-Pacific
- China
- Japan
- India
- Australia
- South Korea
- Rest of APAC
- Middle East & Africa
- GCC
- South Africa
- Rest of Middle East & Africa
- South America
- Brazil
- Argentina
- Rest of South America
- North America
Geography Analysis
North America anchored 41.3% of the medical implants market in 2025 thanks to the highest per-capita procedure rates and expedited breakthrough-device pathways that shorten time to market. Recent Medicare coverage for robotic joint replacements added USD 2.1 billion in reimbursement headroom and spurred hospital purchases of Stryker's Mako and Zimmer Biomet's Rosa systems. Canada's single-payer caps create nine-month wait lists, sending 12,000 citizens annually to U.S. providers for faster access.
Europe supplied 28.2% of global revenue in 2025, but Medical Device Regulation costs prompted 14 mid-sized firms to exit, consolidating supply with multinationals. Asia-Pacific, by contrast, will drive future gains with an 8.31% CAGR; China's Healthy China 2030 initiative set aside CNY 120 billion to extend orthopedic coverage in tier-2 cities, while India's Ayushman Bharat scheme now covers 500 million citizens for implant procedures. Japan's reimbursement schedules cut device prices 2% every two years, squeezing margins but keeping procedure volumes high as 28% of the population is already over 65 years old.
The Middle East & Africa and South America contributed a combined 14.6% in 2025. The United Arab Emirates approved 22 new implant models after streamlining its review pathway to recruit device makers. Brazil expanded public coverage to include congenital dental implants, adding 180,000 beneficiaries and USD 320 million in demand. South Africa continues to battle shipping delays linked to Red Sea disruptions, prompting distributors to build local inventory hubs.
- Abbott Laboratories
- Arthrex
- BIOTRONIK
- Boston Scientific
- B. Braun
- Cochlear
- Conformis, Inc.
- Conmed
- Cook Group
- Dentsply Sirona
- GC Aesthetics
- Globus Medical
- Straumann Group
- Integra LifeSciences Holdings
- Johnson & Johnson (DePuy Synthes, Ethicon, Mentor)
- Medtronic
- MicroPort
- Smith + Nephew plc
- Stryker
- Zimmer Biomet
- Osstem Implant Co., Ltd.
Additional Benefits:
- The market estimate (ME) sheet in Excel format
- 3 months of analyst support
TABLE OF CONTENTS
1 Introduction
- 1.1 Study Assumptions & Market Definition
- 1.2 Scope of the Study
2 Research Methodology
3 Executive Summary
4 Market Landscape
- 4.1 Market Overview
- 4.2 Market Drivers
- 4.2.1 Aging Population & Higher Chronic Disease Burden
- 4.2.2 Expanding Elective Cosmetic & Dental Procedures
- 4.2.3 Continuous Material Science Breakthroughs Enabling Ultra-Light & Bio-Active Implants
- 4.2.4 Large Language-Model-Assisted Design Compressing R&D Timelines
- 4.3 Market Restraints
- 4.3.1 Intensifying Regulatory Scrutiny & Longer Approval Timelines
- 4.3.2 High Device Cost & Limited Reimbursement
- 4.3.3 Cybersecurity Risks For Smart Implants Eroding Clinician Confidence
- 4.3.4 Global Titanium Supply-Chain Volatility Post-2027
- 4.4 Supply-Chain Analysis
- 4.5 Regulatory Landscape
- 4.6 Technological Outlook
- 4.7 Porter's Five Forces
- 4.7.1 Bargaining Power of Buyers
- 4.7.2 Bargaining Power of Suppliers
- 4.7.3 Threat of New Entrants
- 4.7.4 Threat of Substitutes
- 4.7.5 Intensity of Competitive Rivalry
5 Market Size & Growth Forecasts (Value)
- 5.1 By Product
- 5.1.1 Orthopedic Implants
- 5.1.1.1 Hip Orthopedic Devices
- 5.1.1.2 Knee Orthopedic Devices
- 5.1.1.3 Spine Orthopedic Devices
- 5.1.1.4 Joint Reconstruction
- 5.1.1.5 Other Orthopedic Products
- 5.1.2 Cardiovascular Implants
- 5.1.2.1 Pacing Devices
- 5.1.2.2 Stents
- 5.1.2.3 Structural Cardiac Implants
- 5.1.3 Ophthalmic Implants
- 5.1.3.1 Intra-ocular Lens
- 5.1.3.2 Glaucoma Implants
- 5.1.4 Dental Implants
- 5.1.5 Cochlear & Auditory Implants
- 5.1.6 Facial Implants
- 5.1.7 Breast Implants
- 5.1.8 Other Implants (neurostimulators, contraceptive, etc.)
- 5.1.1 Orthopedic Implants
- 5.2 By Material
- 5.2.1 Metallic Biomaterials
- 5.2.2 Polymeric Biomaterials
- 5.2.3 Ceramic Biomaterials
- 5.2.4 Natural / Bioresorbable Biomaterials
- 5.3 By Technology
- 5.3.1 Conventional Implants
- 5.3.2 3-D Printed / Additive Manufactured Implants
- 5.3.3 Smart Sensor-Enabled Implants
- 5.4 By End-User
- 5.4.1 Hospitals
- 5.4.2 Specialty Clinics
- 5.4.3 Ambulatory Surgical Centers
- 5.5 By Geography
- 5.5.1 North America
- 5.5.1.1 United States
- 5.5.1.2 Canada
- 5.5.1.3 Mexico
- 5.5.2 Europe
- 5.5.2.1 Germany
- 5.5.2.2 United Kingdom
- 5.5.2.3 France
- 5.5.2.4 Italy
- 5.5.2.5 Spain
- 5.5.2.6 Rest of Europe
- 5.5.3 Asia-Pacific
- 5.5.3.1 China
- 5.5.3.2 Japan
- 5.5.3.3 India
- 5.5.3.4 Australia
- 5.5.3.5 South Korea
- 5.5.3.6 Rest of APAC
- 5.5.4 Middle East & Africa
- 5.5.4.1 GCC
- 5.5.4.2 South Africa
- 5.5.4.3 Rest of Middle East & Africa
- 5.5.5 South America
- 5.5.5.1 Brazil
- 5.5.5.2 Argentina
- 5.5.5.3 Rest of South America
- 5.5.1 North America
6 Competitive Landscape
- 6.1 Market Concentration
- 6.2 Market Share Analysis
- 6.3 Company Profiles (includes Global level Overview, Market level overview, Core Segments, Financials as available, Strategic Information, Market Rank/Share for key companies, Products & Services, and Recent Developments)
- 6.3.1 Abbott Laboratories
- 6.3.2 Arthrex, Inc.
- 6.3.3 BIOTRONIK SE & Co. KG
- 6.3.4 Boston Scientific Corporation
- 6.3.5 B. Braun SE
- 6.3.6 Cochlear Ltd.
- 6.3.7 Conformis, Inc.
- 6.3.8 CONMED Corporation
- 6.3.9 Cook Medical
- 6.3.10 Dentsply Sirona
- 6.3.11 GC Aesthetics
- 6.3.12 Globus Medical, Inc.
- 6.3.13 Institut Straumann AG
- 6.3.14 Integra LifeSciences Holdings
- 6.3.15 Johnson & Johnson (DePuy Synthes, Ethicon, Mentor)
- 6.3.16 Medtronic plc
- 6.3.17 MicroPort Scientific
- 6.3.18 Smith + Nephew plc
- 6.3.19 Stryker Corporation
- 6.3.20 Zimmer Biomet Holdings
- 6.3.21 Osstem Implant Co., Ltd.
7 Market Opportunities & Future Outlook
- 7.1 White-space & Unmet-Need Assessment


