

|
시장보고서
상품코드
2123427
안전 레이저 스캐너 시장 : 점유율 분석, 업계 동향과 통계, 성장 예측(2026-2031년)Safety Laser Scanner - Market Share Analysis, Industry Trends & Statistics, Growth Forecasts (2026 - 2031) |
||||||
 Mordor Intelligence
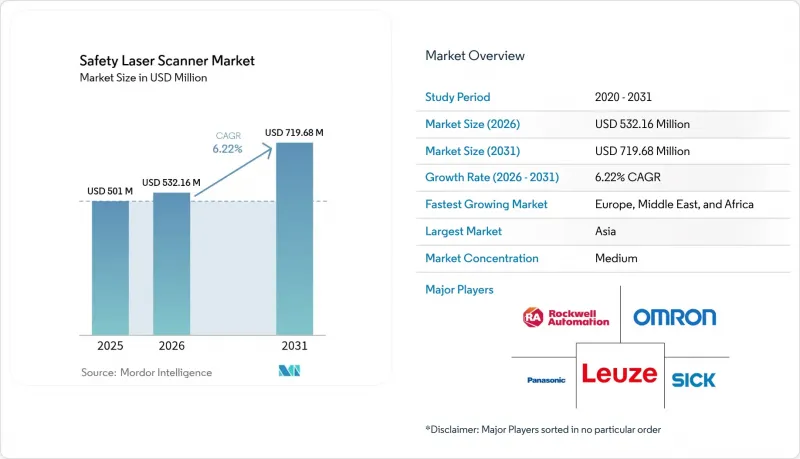
Mordor Intelligence에 의하면, 안전 레이저 스캐너 시장 규모는 2025년에 5억 100만 달러로 평가되었고 2026년 5억 3,216만 달러에서 2031년까지 7억 1,968만 달러에 이를 것으로 예측되며, 예측 기간(2026-2031년) CAGR은 6.22%를 나타낼 전망입니다.
본 보고서는 유형(고정형 안전 레이저 스캐너, 이동형 안전 레이저 스캐너 등), 용도(자동차, 식품 및 음료 등), 최종 사용자 산업(자동차, 의료, 제약), 지역(북미, 유럽, 아시아태평양 등)별로 분류되어 있습니다. 시장 규모 및 전망은 달러 기준 금액으로 표시되어 있습니다.
세계 안전 레이저 스캐너 시장 동향 및 인사이트
유럽 내 물류 허브에서의 AMR 급속한 도입
현재 유럽의 창고에서는 ifm electronic GmbH사의 MiR100이 30km의 경로를 커버하는 등, 하루 1,000건이 넘는 임무를 수행하는 AMR 차량이 도입되고 있습니다. ISO 3691-4에서는 동적 보호 영역의 변경이 의무화되어 있지만, 이는 고정식 가드로는 대응할 수 없습니다. 그 결과, 멀티존 스위칭 기능과 이더넷/IP 인터페이스를 갖춘 이동식 안전 레이저 스캐너는 단순한 규정 준수용 장치가 아니라, 자재관리 자동화를 실현하기 위한 필수 요소가 되었습니다.
독일 자동차 OEM의 ISO 13849-1 및 IEC 61496 적용
독일의 자동차 제조업체들은 현재 EN ISO 12100:2024를 준수하는 완전한 위험 평가 파일이 포함된 SIL3 인증 스캐너를 요구하고 있습니다. 새로운 기준에는 사이버 보안 설계 및 AI 기반의 예측적 위험 식별이 포함됩니다. 적응형이며 자가 진단 기능을 갖춘 스캐너를 제공하는 공급업체는 우선 공급업체 지위를 확보할 수 있지만, 초기 검증 비용이 시스템 가격을 상승시키는 요인이 되고 있습니다.
브라질 및 아르헨티나의 2차 공급업체에서 SIL2/PLd 인증에 드는 높은 비용
브라질의 NR-12 표준에서는 포르투갈어로 된 문서화와 현지 엔지니어에 의한 검증이 의무화되어 있어, 이로 인해 스캐너 구매 가격의 최대 20%가 추가됩니다. 중소 공급업체들은 도입을 미루고 있어 지역 내 성장을 저해하고 있는 반면, 현지 규정 준수 팀을 보유한 벤더에게는 컨설팅 틈새 시장이 열리고 있습니다.
부문 분석
2025년, 고정형 장치는 고정식 프레스 및 컨베이어에서 입증된 가동률을 바탕으로 안전 레이저 스캐너 시장의 56.45%를 차지했습니다. 한편, 창고 내 AMR의 보급에 따라 이동형 모델은 2031년까지 연평균 성장률(CAGR) 8.28%로 성장할 것으로 전망됩니다. 이동형 솔루션을 위한 안전 레이저 스캐너 시장 규모는 컴팩트하고 배터리 효율이 뛰어난 설계와 ISO 3691-4 준수를 바탕으로 2031년까지 3억 3,760만 달러에 달할 것으로 예측됩니다. 예를 들어, 필츠(Pilz)사의 ‘PSENscan’에는 최대 70개의 구성 가능한 필드가 탑재되어 있어, AMR이 밀리초 단위로 보호 영역을 재조정할 수 있습니다. 반면, 재현성이 높은 가드 형상이 유연성보다 중시되는 고정밀 자동차 화이트바디 생산 라인에서는 여전히 고정형 모델이 주류를 이루고 있습니다.
보호 영역에 대한 선호도는 변화하고 있습니다. 5미터 스캐너는 커버 범위와 지연 시간의 균형이 잘 잡혀 있어 2025년 매출의 41.55%를 차지했지만, 최적화된 광학 시스템을 탑재한 7미터 모델은 연평균 성장률(CAGR) 7.08%를 기록할 전망입니다. 한편, 3D 스캔은 복잡한 용접 셀을 위한 프리미엄 틈새 시장으로 남아 있지만, 비용을 중시하는 구매자들은 여전히 견고한 2D 장치를 선택하고 있습니다.
컨베이어 및 포장 용도는 2025년 매출의 32.60%를 차지했으나, 인원 안전에 관한 규제 강화로 인해 구역 보호 및 접근 제어 분야의 연평균 성장률(CAGR)은 7.32%로 가장 높습니다. 현재 멀티존 스캐너가 로봇 용접 베이와 팔레타이저를 둘러싸고 있어, 라인의 유연성을 저해하던 기계식 펜스를 대체하고 있습니다. SICK사의 ‘microScan3’는 3개의 독립적인 안전 필드를 병렬로 작동시킬 수 있으며, 이는 장비가 밀집된 포장 현장에서 매우 중요한 기능입니다. 보험사가 인증 증빙 자료를 요구하는 가운데, 구역 보호 분야의 안전 레이저 스캐너 시장 점유율은 2031년까지 36.80%까지 상승할 전망입니다.
AGV(자동 유도 차량)와 AMR(자율 이동 로봇)은 두 번째로 큰 시장 부문을 차지하고 있지만, 특히 전자상거래 사업자들의 투자가 집중되는 내부 물류 자동화 분야에 자본 예산의 상당 부분이 배정됨에 따라 조만간 컨베이어 시장을 추월할 전망입니다. 스캐너 OEM 제조업체들은 진단 게이트웨이를 통합함으로써, 차량 관리 소프트웨어가 가동 상태 데이터를 수집하고 예측 정비를 계획할 수 있도록 하여 가동률을 99% 이상으로 유지하고 있습니다.
지역별 분석
유럽은 엄격한 CE 기계 지침과 긴밀한 통합업체 네트워크를 활용하여 2025년 매출의 34.70%를 차지했습니다. 독일의 OEM 업체들은 스캐너의 기능 안전성을 높이는 엄격한 조달 사양을 제시하고 있는 반면, 북유럽의 로봇 제조업체들은 카메라 기반 시스템으로 전환하고 있어, 이는 가격 면에서 압박을 야기하는 한편, 이미지 처리 관련 애드온의 보급을 가속화하고 있습니다. 탄소 중립 생산을 목표로 한 지역별 지원 프로그램은 자동화를 더욱 촉진하고, 간접적으로 스캐너 판매를 끌어올리고 있습니다.
아시아태평양은 연평균 성장률(CAGR) 7.33%의 궤도에 올라 있습니다. 중국의 전자제품 공장에서는 코봇용 통합형 ‘속도·분리 감시’ 기능이 요구되고 있으며, 일본의 물류 기업들은 라이트아웃(무인) 운영을 추구하고 있습니다. 한편, 대만과 한국의 숙련된 인력 부족은 원격 진단 기능이 통합된 턴키 방식의 안전 패키지에 대한 수요를 뒷받침하고 있습니다. 인도의 자동차 1차 공급업체들은 미래를 내다보며 신규 생산 라인을 위해 이더넷/IP 스캐너의 시범 도입을 시작하고 있으나, 수입 관세가 여전히 급속한 확장을 억제하고 있습니다.
북미에서는 OSHA의 레이저 가드 승인 및 NRTL 인증 절차의 명확화가 호재로 작용하고 있습니다. 금속 성형 분야의 중소기업을 대상으로 한 개조 프로젝트와 신규 전기차 배터리 공장이 수요를 견인하고 있습니다. 그러나 구형 CAN 네트워크에 대한 의존도가 높아지면서, 데이터 용량이 큰 이더넷 모델로의 전환은 지연되고 있습니다. 남미에서는 NR-12로 인한 비용 부담에 어려움을 겪고 있으며, 소규모 기업들은 더 저렴한 기계식 가드로의 전환을 강요받고 있지만, 다국적 OEM 기업들은 기업의 안전 KPI를 달성하기 위해 구매를 계속하고 있습니다. 아프리카에서는 아직 시장이 초기 단계에 있으며, 광업 지역에서는 스캐너로 보호되는 로봇식 굴착 장비가 도입되고 있지만, 도입 대수는 여전히 낮은 수준에 머물러 있습니다.
기타 혜택:
- 엑셀 형식 시장 예측(ME) 시트
- 3개월간의 애널리스트 지원
자주 묻는 질문
목차
제1장 서론
제2장 조사 방법
제3장 주요 요약
제4장 시장 구도
제5장 시장 규모와 성장 예측
제6장 경쟁 구도
제7장 시장 기회와 향후 전망
JHS 26.09.07According to Mordor Intelligence, the safety laser scanner market size was valued at USD 501 million in 2025 and estimated to grow from USD 532.16 million in 2026 to reach USD 719.68 million by 2031, at a CAGR of 6.22% during the forecast period (2026-2031).
This report is Segmented Into Type(Stationary Safety Laser Scanners, Mobile Safety Laser Scanners, and More), Application(automotive, Food and Beverage, and More), End-User Industry (Automotive, Healthcare, and Pharmaceutical), and Geography (North America, Europe, Asia Pacific, and More ). The Market Sizes and Forecasts are Provided in Terms of Value in USD
Global Safety Laser Scanner Market Trends and Insights
Rapid Adoption of AMRs in European Intralogistics Hubs
European warehouses now field AMR fleets exceeding 1,000 daily missions, such as ifm electronic GmbH's MiR100 deployment covering 30 km of routes. ISO 3691-4 obliges dynamic protective-field changes, which stationary guarding cannot meet. Consequently, mobile safety laser scanners with multi-zone switching and Ethernet/IP interfaces become essential enablers, rather than mere compliance devices, for material-handling automation.
ISO 13849-1 & IEC 61496 Enforcement at German Automotive OEMs
German carmakers now demand SIL3-validated scanners packaged with full EN ISO 12100:2024 risk-assessment files. New criteria include cybersecurity design and AI-based predictive hazard identification. Vendors that offer adaptive, self-diagnosing scanners secure preferred-supplier status, although upfront validation costs increase system pricing.
High SIL2/PLd Certification Costs for Brazilian & Argentine Tier-2 Suppliers
Brazil's NR-12 requires Portuguese documentation and on-site engineer validation, adding up to 20% of a scanner's purchase price. Smaller suppliers delay adoption, slowing regional growth yet opening consultancy niches for vendors with local compliance teams.
Other drivers and restraints analyzed in the detailed report include:
- Retrofitting Legacy Machinery in US SMEs for OSHA 1910.212 Compliance
- Collaborative-Robot Boom in Chinese Electronics Assembly
- Dust-Induced False Trips in Australian Mining Sites
For complete list of drivers and restraints, kindly check the Table Of Contents.
Segment Analysis
Stationary units retained 56.45% of the safety laser scanner market in 2025, supported by proven uptime on fixed presses and conveyors. Mobile variants, however, are tracking an 8.28% CAGR to 2031 as AMRs proliferate in warehouses. The safety laser scanner market size for mobile solutions is projected to reach USD 337.6 million by 2031, underpinned by compact battery-efficient designs and ISO 3691-4 compliance. Pilz's PSENscan, for instance, ships with up to 70 configurable fields, letting AMRs recalibrate protection in milliseconds. Stationary models still dominate high-precision automotive body-in-white lines where repeatable guard shapes outweigh flexibility.
Protective-field preference is shifting. Five-meter scanners captured 41.55% of 2025 revenue because they balance coverage and latency, whereas seven-meter models, equipped with optimized optics, will log a 7.08% CAGR. Meanwhile, 3D scanning remains a premium niche for complex welding cells, while cost-driven buyers stick with robust 2D units.
Conveyor and packaging applications drew 32.60% of 2025 revenue, but stricter personnel-safety rules elevate area protection & access control to the fastest 7.32% CAGR. Multi-zone scanners now ring robot welding bays and palletisers, replacing mechanical fences that impede line flexibility. SICK's microScan3 permits three separate safety fields running in parallel, a critical feature for dense packaging floors. The safety laser scanner market share for area protection is set to climb to 36.80% by 2031 as insurers demand certification evidence.
AGVs and AMRs form the second-largest bucket, yet they will soon eclipse conveyors because intralogistics automation receives the bulk of capital budgets, especially from e-commerce operators. Scanner OEMs embed diagnostic gateways so that fleet-management software can pull health data and schedule predictive maintenance, keeping uptime above 99%.
Complete Report Scope:
- By Type
- Stationary Safety Laser Scanners
- Mobile Safety Laser Scanners
- Protective-Field Range (3 m, 5 m, 7 m)
- Scanning Dimension (2D, 3D)
- Connectivity (Ethernet, CAN, IO-Link)
- By Application
- AGVs and AMRs
- Robotic Cells
- Conveyor and Packaging Lines
- Area Protection and Access Control
- By End-user Industry
- Automotive
- Food and Beverage
- Healthcare and Pharmaceuticals
- Consumer Goods and Electronics
- Logistics and Warehousing
- Metals and Heavy Machinery
- Oil and Gas
- By Connectivity
- Ethernet
- CAN
- IO-Link
- By Geography
- North America
- United States
- Canada
- Mexico
- Europe
- United Kingdom
- Germany
- France
- Italy
- Rest of Europe
- Asia-Pacific
- China
- Japan
- India
- South Korea
- Rest of Asia-Pacific
- Middle East
- Israel
- Saudi Arabia
- United Arab Emirates
- Turkey
- Rest of Middle East
- Africa
- South Africa
- Egypt
- Rest of Africa
- South America
- Brazil
- Argentina
- Rest of South America
- North America
Geography Analysis
Europe controlled 34.70% of 2025 revenue, leveraging strict CE machinery directives and a dense integrator network. German OEMs issue tightened procurement specs that elevate scanner functional safety, whereas Nordic robots shift to camera-based systems, creating price pressure yet also accelerating image-processing add-ons. Regional grant programs targeting carbon-neutral production further incentivize automation, indirectly lifting scanner sales.
Asia-Pacific is on course for a 7.33% CAGR. China's electronics plants require integrated Speed-and-Separation Monitoring for cobots, and Japan's logistics firms pursue lights-out operations. Meanwhile, skilled-labour shortages in Taiwan and Korea spur turnkey safety packages bundled with remote diagnostics. India's automotive Tier-1 suppliers begin piloting Ethernet/IP scanners to future-proof greenfield lines, yet import duties still curb rapid expansion.
North America benefits from OSHA endorsement of laser guarding and clearer NRTL certification pathways. Retrofit projects in metal-forming SMEs and new EV battery plants fuel demand. However, widespread reliance on legacy CAN networks slows the shift to data-rich Ethernet models. South America struggles with NR-12 cost burdens that push smaller outfits toward cheaper mechanical guards, though multinational OEMs maintain purchases to meet corporate safety KPIs. Africa remains nascent; mining enclaves adopt scanner-protected robotic drilling rigs but volumes stay low.
- SICK AG
- OMRON Corporation
- Keyence Corporation
- Leuze Electronic GmbH
- Panasonic Industrial Sensors
- Banner Engineering
- Hans Turck GmbH
- Hokuyo Automatic Co., Ltd.
- IDEC Corporation
- Pilz GmbH and Co. KG
- Datalogic SpA
- Rockwell Automation Inc.
- Arcus Automation Pvt Ltd.
- FARO Technologies, Inc.
- Hexagon AB
- Trimble Inc.
- Pepperl+Fuchs SE
- ABB Ltd.
- Blickfeld GmbH
- Slamcore Ltd.
Additional Benefits:
- The market estimate (ME) sheet in Excel format
- 3 months of analyst support
TABLE OF CONTENTS
1 INTRODUCTION
- 1.1 Study Assumptions and Market Definition
- 1.2 Scope of the Study
2 RESEARCH METHODOLOGY
3 EXECUTIVE SUMMARY
4 MARKET LANDSCAPE
- 4.1 Market Overview
- 4.2 Market Drivers
- 4.2.1 Rapid Adoption of AMRs in European Intralogistics Hubs
- 4.2.2 ISO 13849-1 and IEC 61496 Enforcement at German Automotive OEMs
- 4.2.3 Retrofitting Legacy Machinery in US SMEs for OSHA 1910.212 Compliance
- 4.2.4 Collaborative-Robot Boom in Chinese Electronics Assembly
- 4.2.5 Dark Warehouses in Japanese 3PL Driving 270° Mobile Scanner Demand
- 4.3 Market Restraints
- 4.3.1 High SIL2/PLd Certification Costs for Brazilian and Argentine Tier-2 Suppliers
- 4.3.2 Dust-Induced False Trips in Australian Mining Sites
- 4.3.3 Price Erosion from Vision-based Safety Cameras in Nordic Robotics
- 4.3.4 Skilled-Labour Gap for Scanner Integration in Middle-East SMEs
- 4.4 Value / Supply-Chain Analysis
- 4.5 Regulatory and Technological Outlook
- 4.6 Porter's Five Forces Analysis
- 4.6.1 Threat of New Entrants
- 4.6.2 Bargaining Power of Buyers/Consumers
- 4.6.3 Bargaining Power of Suppliers
- 4.6.4 Threat of Substitute Products
- 4.6.5 Intensity of Competitive Rivalry
5 MARKET SIZE AND GROWTH FORECASTS (VALUE)
- 5.1 By Type
- 5.1.1 Stationary Safety Laser Scanners
- 5.1.2 Mobile Safety Laser Scanners
- 5.1.3 Protective-Field Range (3 m, 5 m, 7 m)
- 5.1.4 Scanning Dimension (2D, 3D)
- 5.1.5 Connectivity (Ethernet, CAN, IO-Link)
- 5.2 By Application
- 5.2.1 AGVs and AMRs
- 5.2.2 Robotic Cells
- 5.2.3 Conveyor and Packaging Lines
- 5.2.4 Area Protection and Access Control
- 5.3 By End-user Industry
- 5.3.1 Automotive
- 5.3.2 Food and Beverage
- 5.3.3 Healthcare and Pharmaceuticals
- 5.3.4 Consumer Goods and Electronics
- 5.3.5 Logistics and Warehousing
- 5.3.6 Metals and Heavy Machinery
- 5.3.7 Oil and Gas
- 5.4 By Connectivity
- 5.4.1 Ethernet
- 5.4.2 CAN
- 5.4.3 IO-Link
- 5.5 By Geography
- 5.5.1 North America
- 5.5.1.1 United States
- 5.5.1.2 Canada
- 5.5.1.3 Mexico
- 5.5.2 Europe
- 5.5.2.1 United Kingdom
- 5.5.2.2 Germany
- 5.5.2.3 France
- 5.5.2.4 Italy
- 5.5.2.5 Rest of Europe
- 5.5.3 Asia-Pacific
- 5.5.3.1 China
- 5.5.3.2 Japan
- 5.5.3.3 India
- 5.5.3.4 South Korea
- 5.5.3.5 Rest of Asia-Pacific
- 5.5.4 Middle East
- 5.5.4.1 Israel
- 5.5.4.2 Saudi Arabia
- 5.5.4.3 United Arab Emirates
- 5.5.4.4 Turkey
- 5.5.4.5 Rest of Middle East
- 5.5.5 Africa
- 5.5.5.1 South Africa
- 5.5.5.2 Egypt
- 5.5.5.3 Rest of Africa
- 5.5.6 South America
- 5.5.6.1 Brazil
- 5.5.6.2 Argentina
- 5.5.6.3 Rest of South America
- 5.5.1 North America
6 COMPETITIVE LANDSCAPE
- 6.1 Market Concentration
- 6.2 Strategic Moves
- 6.3 Market Share Analysis
- 6.4 Company Profiles {(includes Global level Overview, Market level overview, Core Segments, Financials as available, Strategic Information, Market Rank/Share for key companies, Products and Services, and Recent Developments)}
- 6.4.1 SICK AG
- 6.4.2 OMRON Corporation
- 6.4.3 Keyence Corporation
- 6.4.4 Leuze Electronic GmbH
- 6.4.5 Panasonic Industrial Sensors
- 6.4.6 Banner Engineering
- 6.4.7 Hans Turck GmbH
- 6.4.8 Hokuyo Automatic Co., Ltd.
- 6.4.9 IDEC Corporation
- 6.4.10 Pilz GmbH and Co. KG
- 6.4.11 Datalogic SpA
- 6.4.12 Rockwell Automation Inc.
- 6.4.13 Arcus Automation Pvt Ltd.
- 6.4.14 FARO Technologies, Inc.
- 6.4.15 Hexagon AB
- 6.4.16 Trimble Inc.
- 6.4.17 Pepperl+Fuchs SE
- 6.4.18 ABB Ltd.
- 6.4.19 Blickfeld GmbH
- 6.4.20 Slamcore Ltd.
7 MARKET OPPORTUNITIES AND FUTURE OUTLOOK
- 7.1 White-space and Unmet-need Assessment


