

|
시장보고서
상품코드
2123428
레이더 레벨 트랜스미터 시장 : 점유율 분석, 업계 동향과 통계, 성장 예측(2026-2031년)Radar Level Transmitter - Market Share Analysis, Industry Trends & Statistics, Growth Forecasts (2026 - 2031) |
||||||
 Mordor Intelligence
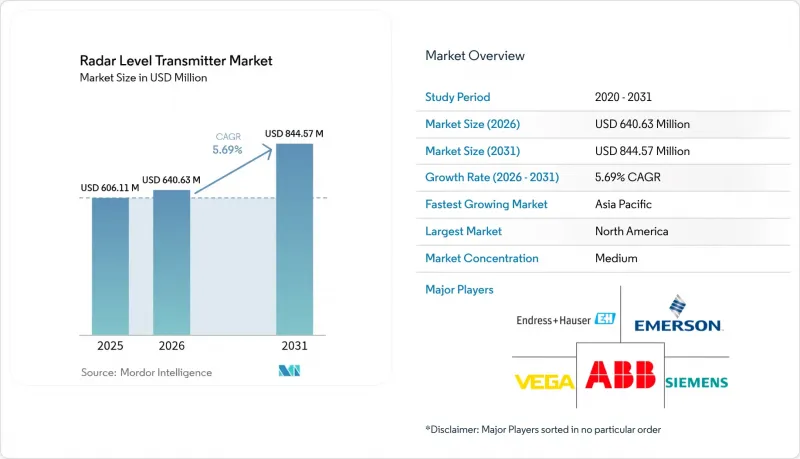
Mordor Intelligence에 의하면, 레이더 레벨 트랜스미터 시장 규모는 2025년에 6억 611만 달러로 평가되었고 2026년 6억 4,063만 달러에서 2031년까지 8억 4,457만 달러에 이를 것으로 예측되며, 예측 기간(2026-2031년) CAGR은 5.69%를 나타낼 전망입니다.
본 보고서는 기술별(접촉식, 비접촉식), 주파수 대역별(C대역 및 X대역, K대역, W대역), 용도별(액체/계면, 고체), 최종 사용자 산업별(석유 및 가스, 화학, 수자원, 발전, 제약·바이오기술 등) 및 지역별로 분류되어 있습니다. 시장 전망은 금액(달러) 기준으로 제시되어 있습니다.
세계 레이더 레벨 트랜스미터 시장 동향 및 인사이트
EU 석유 터미널의 과충진 방지 대책으로 80GHz 레이더가 초음파 센서를 대체하고 있습니다.
유럽의 규제에 따라 고도의 과충진 방지 조치가 의무화됨에 따라, 사업자들은 초음파 레벨계를 80GHz 레이더로 교체하고 있습니다. 좁은 빔 각도로 인해 마이크로파 에너지가 집중되므로 증기나 온도 변동이 있는 경우에도 신뢰할 수 있는 측정이 가능하며, 컴팩트한 안테나 설계 덕분에 플로팅 루프가 장착된 탱크에도 후속 설치가 용이합니다. 유지보수가 필요 없는 운영과 더불어, 이 기술은 규정 준수를 보장하고 수명 주기 비용을 절감합니다.
GCC 국가들의 해수 담수화 설비에 대한 자본 지출(CAPEX) 붐이 레이더 도입을 촉진
사우디아라비아, 아랍에미리트(UAE), 쿠웨이트 3개국을 합치면 전 세계 해수 담수화 용량의 절반을 차지합니다. 새로 건설되는 다단 플래시 방식 및 역삼투 방식 플랜트에서는 부식성이 높고 염분 농도가 높은 염수에 견딜 수 있는 비접촉식 레이더가 요구되고 있습니다. 디지털 제어 시스템과의 통합을 통해 에너지 효율과 물 회수율이 향상됨에 따라, 레이더는 해당 지역의 EPC 계약에서 표준 사양으로 자리 잡아가고 있습니다.
거품 발생이 심한 반응조에서의 신호 손실
두꺼운 기포층은 마이크로파를 감쇠시키고, 에톡실화 및 발효조에서 레벨 제어를 방해하는 가짜 에코를 유발합니다. 고도의 신호 처리 및 레이더와 정전용량식 프로브의 하이브리드화를 통해 이 문제는 완화되지만, 극심한 거품 발생 상황에서는 물리적 제약으로 인해 레이더의 투과성이 여전히 제한됩니다.
부문 분석
비접촉식 센서는 2025년 매출의 64.20%를 차지하고 있으며, 이는 부식성 환경이나 고온 환경에서 유지보수가 필요 없는 운영이 선호되고 있음을 반영합니다. 이 하위 부문은 신호 대 잡음비를 향상시키는 주파수 변조 연속파(FMCW) 플랫폼에 힘입어 연평균 성장률(CAGR) 6.58%로 성장할 전망입니다. 도파 레이더는 계면 감지나 심한 기포 발생이 빈번하게 나타나는 분야에서 여전히 틈새 시장 지위를 유지하고 있습니다. 한때 초음파 프로브로만 제한되었던 선박에도 현재는 소형 80GHz 안테나가 후장착되면서, 레이더 레벨 트랜스미터 시장의 잠재적 수요가 확대되고 있습니다.
블루투스를 통한 시운전 및 센서 내장 진단 기능과 같은 디지털 기술의 발전으로 규정 준수 감사가 간소화되어 레이더 레벨 트랜스미터 업계의 가치 제안이 강화되고 있습니다. 각 공급업체들은 인력 부족에 대한 대책으로 자가 모니터링 기능을 도입하고 있으며, 이를 통해 레이더는 기업의 자산 성과 관리 플랫폼에서 핵심 노드로서의 위상을 높이고 있습니다.
K대역(24-26GHz)은 2025년 출하 대수의 37.40%를 계속 차지하고 있으며, 뛰어난 가성비와 폭넓은 인증 획득이 높이 평가받고 있습니다. 한편,W-대역(76-81GHz 및 120GHz) 센서는 교반기 블레이드나 가느다란 노즐을 무시할 수 있는 3° 미만의 빔 각도로 인해, 40m 높이의 컬럼이나 가늘고 긴 양조 케틀에서도 신뢰성 높은 측정값을 제공하며, 연평균 성장률(CAGR) 7.18%로 성장을 지속하고, 있습니다. 미국, EU, 중국의 인증 기관이 W-밴드의 공정 용도를 승인함에 따라 규모의 경제가 촉진되어 기존의 가격 프리미엄이 점차 줄어들고 있습니다. 부품 비용의 하락에 따라 W-밴드의 보급은 레이더 레벨 트랜스미터 시장 내 경쟁 구도를 완전히 바꿀 것으로 보입니다.
지역별 분석
북미의 매출 점유율 31.70%는 성숙한 석유, 화학, 식품 산업에 더해, 상수도 인프라의 디지털화를 장려하는 연방 정부의 보조금 덕분입니다. 유틸리티자는 클라우드 연결형 레이더를 활용하여 현장 방문을 줄이고 있는 반면, 수제 맥주 양조업체는 가혹한 CIP(정지 세척) 주기를 견딜 수 있는 위생적인 모델을 채택하고 있습니다.
아시아태평양은 중국의 석탄 화학 플랜트와 인도의 스마트 시티 내 폐수 처리 프로젝트에 힘입어 연평균 성장률(CAGR) 7.28%를 기록하며 시장의 성장 동력이 되고 있습니다. 호주의 광산 기업들은 광미 관리를 위해 거품에 강한 80GHz 장치를 지정하고 있으며, 동남아시아의 팜유 정제소에서는 점성이 높은 매체에 대응할 수 있는 도파형 모델이 요구되고 있습니다.
유럽에서는 독일 화학 산업 단지의 공정 최적화와 유럽 전역에서 탱크 계량 정밀도 강화 의무를 규정하는 메탄 배출 규제의 영향으로 견조한 성장세가 유지되고 있습니다. 스칸디나비아의 유틸리티자들은 한랭 지역의 저수지에 적합한 저전력 레이더 센서를 도입하며, 지속가능성과 점검 횟수 감소를 중시하고 있습니다.
중동의 해수 담수화 붐이 장기적인 수요의 기반이 되고 있는 반면, 라틴아메리카에서는 구리 및 리튬 생산 확대에 따라 고형물에 초점을 맞춘 레이더 도입이 진행되고 있습니다. 아프리카의 시멘트 및 음료 산업에서는 전기화가 진행됨에 따라 비용 효율이 뛰어난 24GHz 장비가 채택되고 있습니다.
기타 혜택:
- 엑셀 형식 시장 예측(ME) 시트
- 3개월간의 애널리스트 지원
자주 묻는 질문
목차
제1장 서론
제2장 조사 방법
제3장 주요 요약
제4장 시장 구도
제5장 시장 규모와 성장 예측
제6장 경쟁 구도
제7장 시장 기회와 향후 전망
JHS 26.09.09According to Mordor Intelligence, the radar level transmitter market size was valued at USD 606.11 million in 2025 and estimated to grow from USD 640.63 million in 2026 to reach USD 844.57 million by 2031, at a CAGR of 5.69% during the forecast period (2026-2031).
This report is Segmented by Technology (Contact System, Non-Contact System), Frequency Range (C and X Band, K Band, W Band), Application (Liquids/Interfaces, Solids), End-User Industry (Oil and Gas, Chemicals, Water, Power Generation, Pharmaceuticals and Biotechnology, and More), and Geography. The Market Forecasts are Provided in Terms of Value (USD).
Global Radar Level Transmitter Market Trends and Insights
80 GHz radar replacing ultrasonic sensors in EU oil-terminal overfill protection
European regulations mandate advanced overfill protection, prompting operators to replace ultrasonic gauges with 80 GHz radar. Narrow beam angles concentrate microwave energy, delivering reliable measurements even through vapors and temperature swings, while compact antenna designs simplify retrofits in tanks fitted with floating roofs. Coupled with maintenance-free operation, the technology ensures compliance and lowers lifecycle cost.
Desalination CAPEX boom in GCC boosting radar installations
Saudi Arabia, the UAE, and Kuwait collectively account for half of global desalination capacity. New multi-stage flash and reverse-osmosis plants demand non-contact radar that withstands corrosive, high-salinity brines. Integration with digital control systems improves energy efficiency and water recovery, embedding radar as a standard specification in regional EPC contracts.
Signal loss in foam-intense reactors
Thick foam layers attenuate microwaves, causing spurious echoes that disrupt level control in ethoxylation or fermentation vessels. Enhanced signal processing and hybrid radar-capacitance probes mitigate, but physics still limits radar penetration in extreme foaming.
Other drivers and restraints analyzed in the detailed report include:
- China coal-to-chemicals interface measurement demand
- Retrofit Wave of IIoT-Ready Instruments in Ageing US Water Plants
- Shortage of certified radar technicians in ASEAN
For complete list of drivers and restraints, kindly check the Table Of Contents.
Segment Analysis
Non-contact sensors captured 64.20% of 2025 revenue, reflecting preference for maintenance-free operation in corrosive or high-temperature duties. The sub-segment will expand at 6.58% CAGR, reinforced by frequency-modulated continuous-wave (FMCW) platforms that sharpen signal-to-noise ratios. Guided-wave radar retains a niche where interface detection or heavy foam is prevalent. Compact 80 GHz antennas now retrofit vessels once limited to ultrasonic probes, enlarging addressable demand for the radar level transmitter market.
Digital advances such as Bluetooth commissioning and in-sensor diagnostics simplify compliance audits, enhancing the radar level transmitter industry's value proposition. Suppliers position self-monitoring features as a hedge against workforce shortages, elevating radar to a core node in enterprise asset-performance platforms.
K-band (24-26 GHz) still held 37.40% of 2025 shipments, appreciated for cost-effectiveness and broad approvals. Yet W-band (76-81 GHz and 120 GHz) sensors show 7.18% CAGR due to sub-3° beam angles that ignore agitator blades and narrow nozzles, delivering reliable readings in 40-m columns or slender brew kettles. Certification agencies in the United States, EU, and China cleared W-band for process use, driving scale economies that are eroding historic price premiums. As component costs fall, W-band penetration will remake competitive positioning in the radar level transmitter market.
Complete Report Scope:
- By Technology
- Contact System (Guided Wave Radar)
- Non-Contact System (Free-Space Radar)
- FMCW Radar
- Pulsed Radar
- By Frequency Range
- C and X Band (6-12 GHz)
- K Band (24-26 GHz)
- W Band (76-81 and 120 GHz)
- By Application
- Liquids, Slurries and Interfaces
- Solids (Bulk Powders and Granulates)
- By End-user Industry
- Oil and Gas
- Chemicals and Petrochemicals
- Water and Wastewater
- Food and Beverages
- Power Generation
- Pharmaceuticals and Biotechnology
- Metals and Mining
- Marine and Shipbuilding
- Other Industries (Pulp and Paper, Cement)
- By Geography
- North America
- United States
- Canada
- Mexico
- Europe
- United Kingdom
- Germany
- France
- Italy
- Rest of Europe
- Asia-Pacific
- China
- Japan
- India
- South Korea
- Rest of Asia-Pacific
- Middle East
- Israel
- Saudi Arabia
- United Arab Emirates
- Turkey
- Rest of Middle East
- Africa
- South Africa
- Egypt
- Rest of Africa
- South America
- Brazil
- Argentina
- Rest of South America
- North America
Geography Analysis
North America's 31.70% revenue share stems from mature oil, chemical, and food industries, coupled with federal grants that incentivize digital upgrades in water infrastructure. Utilities leverage cloud-connected radar to cut field visits, while craft brewers adopt hygienic models that withstand aggressive clean-in-place cycles.
Asia-Pacific is the growth engine at 7.28% CAGR, led by Chinese coal-to-chemicals plants and Indian smart-city wastewater projects. Australian miners specify foam-tolerant 80 GHz units for tailings management, and Southeast Asian palm-oil refineries demand guided-wave models that handle sticky media.
Europe maintains steady momentum, driven by process optimization in Germany's chemical parks and methane-emission rules that mandate tighter tank-gauging accuracy across the continent. Scandinavian utilities procure low-power radar sensors suited to cold-climate reservoirs, emphasizing sustainability and reduced servicing trips.
The Middle East's desalination boom anchors long-term demand, whereas Latin America's copper and lithium expansions support solids-focused radar deployments. Africa's cement and beverage sectors adopt cost-optimized 24 GHz units as electrification spreads.
- Emerson Electric Co.
- Siemens AG
- Endress+Hauser Group
- ABB Ltd.
- Honeywell International Inc.
- VEGA Grieshaber KG
- KROHNE Messtechnik
- Yokogawa Electric Corp.
- AMETEK Inc.
- Magnetrol International (AMETEK)
- Schneider Electric SE
- Pepperl+Fuchs SE
- Automation Products Group Inc.
- Nivelco Process Control Corp.
- Matsushima Measure Tech Co. Ltd.
- Hawk Measurement Systems
- Bindicator (Venture Measurement)
- Drexelbrook (Ametek)
- FEEJOY Technology
- SOR Inc.
Additional Benefits:
- The market estimate (ME) sheet in Excel format
- 3 months of analyst support
TABLE OF CONTENTS
1 INTRODUCTION
- 1.1 Study Assumptions and Market Definition
- 1.2 Scope of the Study
2 RESEARCH METHODOLOGY
3 EXECUTIVE SUMMARY
4 MARKET LANDSCAPE
- 4.1 Market Overview
- 4.2 Market Drivers
- 4.2.1 80 GHz Radar Replacing Ultrasonic Sensors in EU Oil-Terminal Overfill Protection
- 4.2.2 Desalination CAPEX Boom in GCC Boosting Radar Installations
- 4.2.3 China Coal-to-Chemicals Interface Measurement Demand
- 4.2.4 Retrofit Wave of IIoT-Ready Instruments in Ageing US Water Plants
- 4.2.5 Hygienic Non-Contact Radar Adoption by North-American Craft Breweries
- 4.2.6 Foam-Tolerant Radar for Tailings Dams in Australian Mining
- 4.3 Market Restraints
- 4.3.1 Signal Loss in Foam-Intense Reactors
- 4.3.2 Shortage of Certified Radar Technicians in ASEAN
- 4.3.3 High Up-Front Cost vs Ultrasonic on OEM Skids
- 4.3.4 Low-Dielectric Powders Causing Accuracy Concerns
- 4.4 Value / Supply-Chain Analysis
- 4.5 Regulatory and Technological Outlook
- 4.6 Porter's Five Forces Analysis
- 4.6.1 Threat of New Entrants
- 4.6.2 Bargaining Power of Buyers
- 4.6.3 Bargaining Power of Suppliers
- 4.6.4 Threat of Substitute Products
- 4.6.5 Intensity of Competitive Rivalry
5 MARKET SIZE AND GROWTH FORECASTS (VALUE)
- 5.1 By Technology
- 5.1.1 Contact System (Guided Wave Radar)
- 5.1.2 Non-Contact System (Free-Space Radar)
- 5.1.2.1 FMCW Radar
- 5.1.2.2 Pulsed Radar
- 5.2 By Frequency Range
- 5.2.1 C and X Band (6-12 GHz)
- 5.2.2 K Band (24-26 GHz)
- 5.2.3 W Band (76-81 and 120 GHz)
- 5.3 By Application
- 5.3.1 Liquids, Slurries and Interfaces
- 5.3.2 Solids (Bulk Powders and Granulates)
- 5.4 By End-user Industry
- 5.4.1 Oil and Gas
- 5.4.2 Chemicals and Petrochemicals
- 5.4.3 Water and Wastewater
- 5.4.4 Food and Beverages
- 5.4.5 Power Generation
- 5.4.6 Pharmaceuticals and Biotechnology
- 5.4.7 Metals and Mining
- 5.4.8 Marine and Shipbuilding
- 5.4.9 Other Industries (Pulp and Paper, Cement)
- 5.5 By Geography
- 5.5.1 North America
- 5.5.1.1 United States
- 5.5.1.2 Canada
- 5.5.1.3 Mexico
- 5.5.2 Europe
- 5.5.2.1 United Kingdom
- 5.5.2.2 Germany
- 5.5.2.3 France
- 5.5.2.4 Italy
- 5.5.2.5 Rest of Europe
- 5.5.3 Asia-Pacific
- 5.5.3.1 China
- 5.5.3.2 Japan
- 5.5.3.3 India
- 5.5.3.4 South Korea
- 5.5.3.5 Rest of Asia-Pacific
- 5.5.4 Middle East
- 5.5.4.1 Israel
- 5.5.4.2 Saudi Arabia
- 5.5.4.3 United Arab Emirates
- 5.5.4.4 Turkey
- 5.5.4.5 Rest of Middle East
- 5.5.5 Africa
- 5.5.5.1 South Africa
- 5.5.5.2 Egypt
- 5.5.5.3 Rest of Africa
- 5.5.6 South America
- 5.5.6.1 Brazil
- 5.5.6.2 Argentina
- 5.5.6.3 Rest of South America
- 5.5.1 North America
6 COMPETITIVE LANDSCAPE
- 6.1 Market Concentration
- 6.2 Strategic Moves (MandA, Partnerships, New Products)
- 6.3 Market Share Analysis
- 6.4 Company Profiles {(includes Global level Overview, Market level overview, Core Segments, Financials as available, Strategic Information, Market Rank/Share for key companies, Products and Services, and Recent Developments)}
- 6.4.1 Emerson Electric Co.
- 6.4.2 Siemens AG
- 6.4.3 Endress+Hauser Group
- 6.4.4 ABB Ltd.
- 6.4.5 Honeywell International Inc.
- 6.4.6 VEGA Grieshaber KG
- 6.4.7 KROHNE Messtechnik
- 6.4.8 Yokogawa Electric Corp.
- 6.4.9 AMETEK Inc.
- 6.4.10 Magnetrol International (AMETEK)
- 6.4.11 Schneider Electric SE
- 6.4.12 Pepperl+Fuchs SE
- 6.4.13 Automation Products Group Inc.
- 6.4.14 Nivelco Process Control Corp.
- 6.4.15 Matsushima Measure Tech Co. Ltd.
- 6.4.16 Hawk Measurement Systems
- 6.4.17 Bindicator (Venture Measurement)
- 6.4.18 Drexelbrook (Ametek)
- 6.4.19 FEEJOY Technology
- 6.4.20 SOR Inc.
7 MARKET OPPORTUNITIES AND FUTURE OUTLOOK
- 7.1 White-space and Unmet-Need Assessment


