
|
시장보고서
상품코드
2123456
광고 서비스 시장 : 점유율 분석, 업계 동향과 통계, 성장 예측(2026-2031년)Advertising Services - Market Share Analysis, Industry Trends & Statistics, Growth Forecasts (2026 - 2031) |
||||||
 Mordor Intelligence
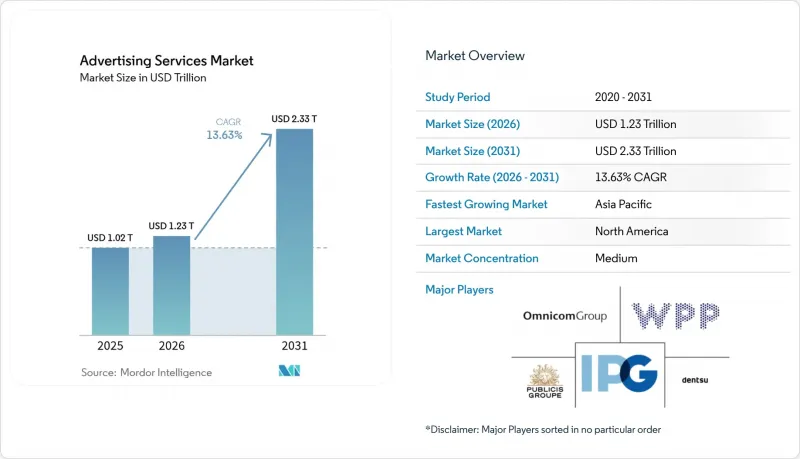
Mordor Intelligence에 의하면, 광고 서비스 시장 규모는 2025년 1조 300억 달러에서 2026년에는 1조 2,300억 달러로 확대되어 2026년부터 2031년까지 CAGR 13.63%로 성장을 지속하여, 2031년까지 2조 3,300억 달러에 이를 것으로 예측됩니다.
본 보고서는 플랫폼(온라인 및 오프라인), 광고 채널(소셜 미디어 광고, 검색 엔진 광고, 디스플레이 광고 및 온라인 동영상 광고 등), 최종 사용자 산업(소매, 전자상거래 및 DTC 브랜드 등), 대행사 유형(풀서비스 통합 대행사, 미디어 바이잉 및 기획 대행사 등), 그리고 지역별로 분류되어 있습니다. 시장 예측은 금액(달러) 기준으로 제시되어 있습니다.
세계 광고 서비스 시장 동향 및 인사이트
모바일 우선 프로그래매틱 동영상 광고의 부상
프로그래매틱 동영상 매출은 2026년에 2,000억 달러를 넘어설 것으로 예상되며, 2025년에는 커넥티드 TV 노출의 90% 이상이 이미 프로그래매틱으로 거래되고 있습니다. 모바일 기기는 프로그래매틱 디스플레이 광고 지출의 약 70%를 차지하고 있지만, 현재의 성장은 소매점 및 대중교통 내 동영상 인벤토리에 집중되어 있으며, Place Exchange에 따르면 2024년 하반기에는 이용 가능한 스크린 수가 25% 증가했습니다. 동 기간 동안 디지털 옥외 광고(DOOH)의 평균 CPM은 7.16달러에서 7.62달러로 상승했으며, 이는 광고주들이 상황에 맞는 동영상 광고 슬롯에 기꺼이 비용을 지불할 의향이 있음을 보여줍니다. 미국의 디지털 동영상 광고 수익은 2024년에 621억 달러에 달하고, 전년 대비 19.2% 증가를 기록하며, 동영상 포맷의 성장세를 뒷받침하고 있습니다. 각 브랜드가 스크린 전반에 걸친 측정 가능한 도달 범위를 추구하는 가운데, 광고 서비스 시장은 평균 미디어 가격 상승과 더욱 풍부한 어트리뷰션 데이터의 혜택을 받고 있습니다. MPEG-DASH에 관한 ISO/IEC 23009-1 등의 규격은 컨텐츠의 상호 운용성을 확보하여 세계 시장에서의 대규모 보급을 더욱 촉진하고 있습니다.
확대되는 소셜 커머스와 인플루언서 생태계
2025년 인플루언서 마케팅 지출은 전년 대비 14.2% 증가하여 디지털 광고 전체를 웃도는 성장세를 보이고 있습니다. ShopMy는 2024년 12월 7,750만 달러를 조달하여 기업 가치를 4억 1,000만 달러로 끌어올렸으며, 550개 이상의 브랜드 가입자를 확보했습니다. Whalar Group은 2025년 5월, 기업 가치 4억 달러로 자금 조달에 성공하며, 크리에이터 커머스 인프라에 대한 기업의 강한 관심을 보여주었습니다. 영국에서는 소셜 커머스 매출이 2026년까지 68억 파운드에 달하고, 전체 전자상거래의 약 3%를 차지할 것으로 예측됩니다. 딜로이트는 브랜드가 소셜 미디어에서의 영감을 실제 거래로 연결하기 위해 상품 카탈로그와 네이티브 체크아웃을 통합할 것을 제안하고 있습니다. 이러한 구매 여정의 융합으로 성과 기여도 분석이 강화되고, 광고 예산이 인지도 제고를 목적으로 한 채널에서 커머스 연계형 포맷으로 이동함에 따라 광고 서비스 시장이 확대되고 있습니다.
심화되는 디지털 광고 사기 및 무효 트래픽
2023년, 업계 인증 제도를 통해 부정 노출이 92% 감소하여 108억 달러를 절감하는 결과를 낳았지만, 광고주는 여전히 무효 트래픽으로 인해 9억 7,900만 달러의 손실을 입었습니다. 구매자들은 공급망의 투명성을 높이기 위해 오픈 익스체인지 대비 2대 1의 비율로 프라이빗 마켓플레이스로 지출을 전환하고 있습니다. 셀사이드의 큐레이션은 요금 체계를 불투명하게 만들 수 있으므로, 광고주는 파트너를 신중하게 감사하고 광고 투자 수익률(ROAS)을 저해하는 과도한 비용을 피해야 합니다. 2024년 애드테크 업계의 M&A 건수는 전년 대비 73% 증가했으며, 위험은 더 소수의 플랫폼에 집중되는 양상을 보였습니다. 이러한 플랫폼에서는 부정 행위 감지 모델에 대한 지속적인 투자가 요구되고 있습니다. 인터랙티브 광고 협회(IAB) 및 미디어 등급 위원회(MRC)의 인증 프레임워크는 여전히 자발적 참여 방식이기 때문에 많은 소규모 퍼블리셔들이 신뢰할 수 있는 생태계 밖으로 밀려난 상태입니다. 사기가 지속되면 광고주는 잠재적인 낭비를 상쇄하기 위해 CPM을 부풀릴 수밖에 없으며, 그 결과 예산이 낭비되고 광고 서비스 시장의 성장이 둔화됩니다.
부문 분석
온라인 매체는 2025년에 광고 서비스 시장 점유율의 61.73%를 차지하며, 프로그래매틱 자동화 및 리테일 미디어의 보급에 힘입어 2031년까지 연평균 성장률(CAGR) 14.11%로 성장할 전망입니다. 오프라인 채널은 브랜드 스토리텔링에 있어 여전히 중요하지만, 광고주가 노출과 전환을 연결하는 측정 가능한 형식으로 전환함에 따라 그 비중은 감소하고 있습니다. 커넥티드 TV 및 디지털 옥외 광고(DOOH)의 동영상 인벤토리는 그동안 웹에 한정되었던 데이터 신호를 구매자가 활용할 수 있게 됨에 따라 가장 빠르게 성장하고 있습니다. 모바일은 여전히 프로그래매틱 디스플레이 광고 지출의 약 70%를 차지하고 있지만, 거실 기기에서 컨텐츠가 스트리밍될 경우 대형 화면일수록 프리미엄 CPM을 얻는 경향이 있습니다. 인벤토리 비용의 상승은 수요의 견조함을 보여주고 있으며, 이것이 광고 서비스 시장 전체의 수익 성장세를 뒷받침하고 있습니다.
오프라인 미디어는 특히 스포츠 생중계나 대규모 문화 행사 시 등 여전히 광범위한 도달이라는 목표를 뒷받침하고 있지만, 젊은 층은 스트리밍이나 소셜 미디어 피드에 더 많은 관심을 보이고 있습니다. 인쇄 매체와 라디오는 명품이나 지역 서비스와 같이 구매 의향이 높은 틈새 시장에서 입지를 유지하고 있지만, 측정 수단이 제한적이어서 더 광범위한 예산 배분으로 이어지지는 못하고 있습니다. 광고주들은 현재 QR 코드나 근거리 통신 기술을 통합하여 아날로그 매체와 디지털 어트리뷰션을 연결함으로써 채널 간의 경계를 모호하게 만들고 있습니다. 디지털 옥외 광고는 전체 옥외 광고 지출의 63%를 차지하고 있으며, 2027년까지 75%를 나타낼 것으로 예측됩니다. 이를 통해 거리에서의 노출과 온라인 전환 경로 간의 격차가 점차 해소될 것입니다. (2) 옴니채널 전략이 성숙해짐에 따라, 광고 서비스 시장 규모는 낭비를 줄이고 광고 투자 수익률(ROAS)을 향상시키는 크로스스크린 빈도 관리의 혜택을 받고 있습니다.
2025년에는 소셜 미디어 광고가 29.36%의 점유율을 차지하며, 그 규모, 타겟팅, 네이티브 체크아웃 흐름을 융합하는 능력이 반영되었습니다. 한편, 리테일 미디어는 퍼스트 파티 쇼핑객 데이터가 서드 파티 쿠키보다 예측 정확도가 높은 것으로 입증됨에 따라 2031년까지 연평균 성장률(CAGR) 13.73%라는 가장 빠른 성장세를 기록하고 있습니다. 검색 광고는 2024년 미국 내 매출이 1,029억 달러로 여전히 핵심을 이루고 있지만, 생성형 응답 엔진의 부상으로 인해 향후 클릭률(CTR)이 하락할 것으로 예측됩니다. 디스플레이 광고와 온라인 동영상 광고는 2024년에 621억 달러의 매출을 기록하며, 커넥티드 TV의 보급을 배경으로 성장을 이어가고 있습니다. 인플루언서 및 크리에이터 마케팅은 브랜드가 낮은 제작 비용으로 진정한 동료들의 지지를 구하기 때문에 연평균 14.2%의 성장률을 보이고 있습니다.
네이티브 광고, TV, 라디오, 인쇄 매체, 옥외 광고, 직접 메일이 광고 믹스를 구성하고 있으며, 이들은 대개 퍼널 업스트림 단계에서의 인지도 제고나 초지역 밀착형 전환을 촉진하는 계기로 기능하고 있습니다. 프로그래매틱 구매는 현재 디스플레이, 동영상, 오디오 노출의 대부분을 차지하고 있으며, 기획자는 도달 범위와 노출 빈도를 세밀하게 제어할 수 있게 되었습니다. 리테일 미디어의 클로즈드 루프형 보고 기능은 소셜, 디스플레이, 검색 채널의 예산을 끌어오며, 채널 간의 기존 위계 구조를 변화시키고 있습니다. 커머스 네트워크가 확대됨에 따라 광고주는 평균 5개 이상의 소매 플랫폼에 지출을 분산하게 되었으며, 광고 공간을 둘러싼 경쟁이 격화되고 있습니다. 따라서 광고 서비스 시장 규모는 증가하는 지출과 검증된 성과에 연동된 단가 상승에 힘입어 확대되고 있습니다.
지역별 분석
2025년, 북미는 전 세계 매출의 37.94%를 차지했습니다. 이는 미국의 인터넷 광고 수익이 2,586억 달러에 달했고, 537억 달러를 창출한 리테일 미디어 네트워크의 강력한 확산에 힘입은 결과입니다. 캐나다의 성장은 식료품점 및 약국 체인에 의한 광고 플랫폼 출시가 뒷받침하고 있는 반면, 멕시코는 니어쇼어링을 활용하여 다국적 기업의 광고 예산을 유치하고 있습니다. 아시아태평양은 연평균 성장률(CAGR) 14.54%로 가장 빠르게 성장하는 지역이며, 인도의 연간 20.2% 증가(141억 7,000만 달러)와 동남아시아에서 비디오 커머스의 점유율이 전자상거래 총액의 25%에 달한 것이 그 배경입니다. 이미 1,817억 달러를 넘어섰고 디지털 보급률이 86.1%에 달한 중국에서는 계속해서 숏폼 동영상과 소셜 커머스 형식이 선호되고 있습니다. 일본과 호주에서는 프로그램 광고 지출이 안정적으로 증가하고 있으며, 동남아시아의 리테일 미디어 수익은 현지 마켓플레이스가 결제 시 데이터를 수익화함으로써 30억 달러에 육박하고 있습니다. 이러한 동향들이 맞물려 신흥국과 성숙국을 불문하고 광고 서비스 시장 규모가 확대되고 있습니다.
유럽은 규제상의 마찰이 있음에도 불구하고 상당한 규모를 차지하고 있으며, 영국의 리테일 미디어 지출은 2025년에 66억 파운드를 넘어설 것으로 예상되고, 크리에이터 마케팅 수익은 2030년까지 26억 파운드에 달할 것으로 전망됩니다. 독일, 프랑스, 이탈리아, 스페인은 여전히 주요 구매자이지만, 언어의 다양성과 개인정보 보호 규제로 인해 운영 비용이 상승하고 있습니다. 디지털 아웃 오브 홈(DOOH)은 옥외 광고 예산의 63%를 차지하며, 2027년까지 75%를 나타낼 것으로 예측됩니다. 이는 오프라인 장소와 온라인 데이터를 연결하는 스크린 기반 형식에 대한 수요가 지속되고 있음을 보여줍니다. 러시아에서는 지정학적 제재로 인해 광고주들의 철수가 나타나고 있지만, 북유럽 국가들과 베네룩스 국가들에서는 높은 광대역 보급률을 바탕으로 꾸준한 성장을 보이고 있습니다. 남미에서는 브라질의 방대한 소셜 미디어 사용자 수가 플랫폼 투자를 유치하고 있으며, 아르헨티나에서는 통화 변동이 안정화되면서 미디어 지출이 보다 안정적인 수준을 유지하고 있습니다. 중동 및 아프리카의 성장은 사우디아라비아와 아랍에미리트의 다각화 계획을 중심으로 전개되고 있으며, 튀르키예와 남아프리카공화국이 이러한 성장세를 더욱 뒷받침하고 있습니다.
각 지역에서 광고비는 측정 가능한 수익을 보장하는 채널로 이동하고 있으며, 지역별 플랫폼이나 규제가 다르더라도 미디어 전략에 있어 전 세계적인 수렴 현상이 더욱 강화되고 있습니다. 아시아태평양의 두 자릿수 성장세가 유럽의 완만한 확대를 상쇄하며, 광고 서비스 시장 전체의 균형을 유지하고 있습니다. 다국적 광고주들은 현재 중앙에서 협상된 프레임워크를 통해 예산을 배분하고 있지만, 크리에이티브에 대해서는 현지 언어와 문화적 뉘앙스에 맞추어 조정하고 있습니다. 환율 변동과 개인정보 보호 규제로 인해 실행의 복잡성은 증가하고 있지만, 데이터 클린룸과 동의 관리 플랫폼이 프로세스의 표준화에 기여하고 있습니다. 리테일 미디어, 프로그래매틱 CTV, 생성형 AI가 전 세계적으로 보급됨에 따라 지역 간 성장 격차는 줄어들고 있으며, 이는 광고 서비스 시장의 점유 기업들에게 지속적인 매출 성장을 뒷받침하고 있습니다.
기타 혜택:
- 엑셀 형식 시장 예측(ME) 시트
- 3개월간의 애널리스트 지원
자주 묻는 질문
목차
제1장 서론
제2장 조사 방법
제3장 주요 요약
제4장 시장 구도
제5장 시장 규모와 성장 예측
제6장 경쟁 구도
제7장 시장 기회와 향후 전망
JHS 26.09.09According to Mordor Intelligence, the advertising services market size is expected to grow from USD 1.03 trillion in 2025 to USD 1.23 trillion in 2026 and is forecast to reach USD 2.33 trillion by 2031 at a 13.63% CAGR over 2026-2031.
This report is Segmented by Platform (Online and Offline), Advertising Channel (Social-Media Publishing, Search-Engine Ads, Display and Online Video, and More), End-User Industry (Retail, Ecommerce and DTC Brands, and More), Agency Type (Full-Service Integrated Agency, Media-Buying and Planning Agency, and More), and Geography. The Market Forecasts are Provided in Terms of Value (USD).
Global Advertising Services Market Trends and Insights
Rise of Mobile-First Programmatic Video Advertising
Programmatic video revenue is projected to top USD 200 billion in 2026, and more than 90% of connected-television impressions already trade programmatically in 2025. Mobile devices account for about 70% of programmatic display spend, but growth now concentrates on video inventory inside retail and transit venues, where Place Exchange logged a 25% expansion in available screens during second-half 2024. Average digital-out-of-home CPMs climbed from USD 7.16 to USD 7.62 in the same period, signaling advertiser willingness to pay for contextually relevant video placements. United States digital-video revenue reached USD 62.1 billion in 2024, up 19.2% year-on-year, underscoring the momentum behind video formats. As brands pursue measurable reach across screens, the advertising services market benefits from higher average media prices and richer attribution data. Standards such as ISO/IEC 23009-1 for MPEG-DASH ensure content interoperability and further support scaled adoption across global market.
Expanding Social-Commerce and Influencer Ecosystems
Influencer marketing spend is growing 14.2% year-on-year in 2025, outpacing broader digital advertising categories. ShopMy raised USD 77.5 million in December 2024, boosting its valuation to USD 410 million and attracting more than 550 brand subscribers. Whalar Group secured funding at a USD 400 million valuation in May 2025, showing strong enterprise interest in creator-commerce infrastructure. In the United Kingdom, social commerce sales are forecast to reach GBP 6.8 billion by 2026, accounting for about 3% of total e-commerce. Deloitte advises brands to integrate product catalogs and native checkout to convert social inspiration into completed transactions. This buyer journey convergence strengthens performance attribution, elevating the advertising services market as budgets shift from awareness channels to commerce-linked formats.
Escalating Digital Ad-Fraud and Invalid Traffic
Industry certification reduced fraudulent impressions by 92% in 2023, saving USD 10.8 billion, yet advertisers still lost USD 979 million to invalid traffic. Buyers are shifting spend to private marketplaces at a two-to-one ratio versus open exchanges to secure greater supply-chain transparency. Sell-side curation can obscure fee structures, so advertisers must audit partners carefully to avoid inflated costs that erode return on ad spend. AdTech merger activity rose 73% year-on-year in 2024, concentrating risk on fewer platforms that require ongoing investment in fraud-detection models. Certification frameworks from the Interactive Advertising Bureau and the Media Rating Council remain voluntary, leaving many small publishers outside the trusted ecosystem. Continued fraud drains budgets and slows the advertising services market because advertisers pad CPMs to offset potential waste.
Other drivers and restraints analyzed in the detailed report include:
- Retail-Media Networks Monetising First-Party Shopper Data
- Generative-AI Creative Optimisation Cutting Campaign Cycle Times
- Stricter Global Privacy Regulations (GDPR, CPRA, PIPL)
For complete list of drivers and restraints, kindly check the Table Of Contents.
Segment Analysis
Online outlets held 61.73% of the advertising services market share in 2025 and are on track to expand at 14.11% CAGR through 2031, buoyed by programmatic automation and retail-media uptake. Offline channels remain relevant for brand storytelling, yet their proportional weight declines as advertisers pivot toward measurable formats that link impressions to conversions. Video inventory on connected television and digital out-of-home grows fastest because buyers can apply data signals historically limited to the web. Mobile continues to capture roughly 70% of programmatic display spend, although larger screens attract premium CPMs when content is streamed on living-room devices. Rising inventory costs signal stronger demand, which sustains revenue momentum for the overall advertising services market.
Offline media still supports mass-reach objectives, especially during live sports and cultural tent-pole events, but younger audiences gravitate toward streaming and social feeds. Print and radio defend high-intent niches such as luxury goods and local services, yet limited measurement hinders wider budget allocations. Advertisers now integrate QR codes and near-field technologies to bridge analog placements with digital attribution, blurring the channel divide. Digital out-of-home reaches 63% of all out-of-home spend and is projected to reach 75% by 2027, closing the gap between street-level exposure and online conversion paths.[2] As omni-channel strategies mature, the advertising services market size benefits from cross-screen frequency management that reduces waste and lifts return on ad spend.
Social-media publishing commanded 29.36% share in 2025, reflecting its ability to blend scale, targeting and native checkout flows. Retail media, however, posts the fastest growth at 13.73% CAGR to 2031 as first-party shopper data proves more predictive than third-party cookies. Search remains a cornerstone at USD 102.9 billion in United States revenue in 2024, yet generative answer engines are expected to dilute click-through rates over time. Display and online video earned USD 62.1 billion in 2024 and continue to advance on the back of connected-television adoption. Influencer and creator marketing grows 14.2% annually as brands seek authentic peer endorsement at lower production cost.
Native, television, radio, print, outdoor and direct mail round out the mix, often serving as either top-of-funnel awareness or hyper-local conversion triggers. Programmatic buying now covers most display, video and audio impressions, giving planners granular control over reach and frequency. Retail media's closed-loop reporting attracts budgets from social, display and search, changing the historical hierarchy among channels. As commerce networks proliferate, advertisers diversify spend across five or more retail platforms on average, intensifying competition for inventory. The advertising services market size therefore expands on both incremental spend and higher unit pricing tied to verified outcomes
Complete Report Scope:
- By Platform
- Online
- Offline
- By Advertising Channel
- Social-media publishing
- Search-engine ads
- Display and online video
- Influencer / creator marketing
- Native advertising
- TV spots
- Radio commercials
- Print media
- Outdoor and transit (OOH / DOOH)
- Direct mail
- By End-user Industry
- Retail (incl. grocery)
- Ecommerce and DTC brands
- Travel and tourism
- Media and entertainment
- Financial services
- Healthcare and pharma
- Automotive
- Other End-user Industries
- By Agency Type
- Full-service integrated agency
- Media-buying and planning agency
- Digital-only performance agency
- Creative boutique
- In-house brand studio
- By Geography
- North America
- United States
- Canada
- Mexico
- South America
- Brazil
- Argentina
- Rest of South America
- Europe
- Germany
- United Kingdom
- France
- Italy
- Spain
- Russia
- Rest of Europe
- Asia Pacific
- China
- Japan
- India
- South Korea
- Southeast Asia
- Rest of Asia Pacific
- Middle East and Africa
- Saudi Arabia
- United Arab Emirates
- Turkey
- South Africa
- Rest of Middle East
- North America
Geography Analysis
North America accounted for 37.94% of global revenue in 2025, lifted by the United States' internet advertising income of USD 258.6 billion and the strong adoption of retail-media networks that generated USD 53.7 billion. Canadian growth benefits from grocery and pharmacy chains launching ad platforms, while Mexico leverages near-shoring to attract multinational budgets. Asia Pacific is the fastest-growing territory at 14.54% CAGR, underpinned by India's 20.2% annual rise to USD 14.17 billion and Southeast Asia's video-commerce share reaching 25% of e-commerce value. China, already exceeding USD 181.7 billion with 86.1% digital penetration, continues to favor short-video and social commerce formats. Japan and Australia add stable programmatic spend, while Southeast Asian retail-media revenue nears USD 3 billion as local marketplaces monetize data at checkout. Collectively, these dynamics enlarge the advertising services market size across emerging and mature economies.
Europe contributes significant volume despite regulatory friction, with the United Kingdom's retail-media spend set to surpass GBP 6.6 billion in 2025 and creator-marketing revenue forecast to reach GBP 2.6 billion by 2030. Germany, France, Italy, and Spain remain large buyers, yet language fragmentation and privacy rules raise operating costs. Digital out-of-home claims 63% of outdoor budgets and is projected to hit 75% by 2027, indicating sustained appetite for screen-based formats that bridge offline venues and online data. Russia experiences advertiser pullback due to geopolitical sanctions, while the Nordics and Benelux post steady gains driven by high broadband penetration. South America rebounds as Brazil's sizable social audience draws platform investment and Argentina stabilizes currency fluctuations, encouraging more consistent media outlays. Middle East and Africa growth centers on Saudi Arabia and United Arab Emirates diversification plans, with Turkey and South Africa providing additional momentum.
Across regions, spending migrates toward channels that guarantee measurable return, reinforcing a global convergence in media strategy even as local platforms and regulations differ. Asia Pacific's double-digit trajectory offsets slower European expansion, balancing the overall advertising services market. Multinational advertisers now allot budgets through centrally negotiated frameworks but adapt creatives to local language and cultural nuance. Currency fluctuations and privacy mandates add execution complexity, yet data clean rooms and consent-management platforms help standardize processes. As retail-media, programmatic CTV and generative AI spread worldwide, geographic growth differentials narrow, supporting sustained top-line expansion for the advertising services market share holders.
- WPP plc
- Omnicom Group Inc.
- The Interpublic Group of Companies Inc.
- Publicis Groupe S.A.
- Dentsu Group Inc.
- Havas S.A.
- Stagwell Inc.
- Accenture plc (Accenture Song)
- Hakuhodo DY Holdings Inc.
- Deloitte Touche Tohmatsu Ltd. (Deloitte Digital)
- PwC Advisory Services LLP (PwC Digital Services)
- Cognizant Technology Solutions Corp. (Cognizant Interactive)
- IBM Corp. (IBM iX)
- Salesforce Inc. (Marketing Cloud Services)
- Lamar Advertising Company
- JCDecaux SE
- Clear Channel Outdoor Holdings Inc.
- Fiverr International Ltd.
- S4 Capital plc (Media.Monks)
- Wieden + Kennedy Inc.
- Droga5 LLC
- Serviceplan Group SE and Co. KG
- MandC Saatchi plc
Additional Benefits:
- The market estimate (ME) sheet in Excel format
- 3 months of analyst support
TABLE OF CONTENTS
1 INTRODUCTION
- 1.1 Study Assumptions and Market Definition
- 1.2 Scope of the Study
2 RESEARCH METHODOLOGY
3 EXECUTIVE SUMMARY
4 MARKET LANDSCAPE
- 4.1 Market Overview
- 4.2 Market Drivers
- 4.2.1 Rise of Mobile-first Programmatic Video Advertising
- 4.2.2 Expanding Social-commerce and Influencer Ecosystems
- 4.2.3 Accelerating Shift of SMB Budgets to Self-serve Digital Platforms
- 4.2.4 Retail-media Networks Monetising First-party Shopper Data
- 4.2.5 Cookieless Identity Solutions Boosting First-party Data Activation
- 4.2.6 Generative-AI Creative Optimisation Cutting Campaign Cycle Times
- 4.3 Market Restraints
- 4.3.1 Escalating Digital Ad-fraud and Invalid Traffic
- 4.3.2 Widespread Consumer Ad-blocking and Fatigue
- 4.3.3 Stricter Global Privacy Regulations (GDPR, CPRA, PIPL)
- 4.3.4 Data-analytics Talent Shortage Within Full-service Agencies
- 4.4 Value Chain Analysis
- 4.5 Regulatory Landscape
- 4.6 Technological Outlook
- 4.7 Porter's Five Forces Analysis
- 4.7.1 Threat of New Entrants
- 4.7.2 Bargaining Power of Buyers
- 4.7.3 Bargaining Power of Suppliers
- 4.7.4 Threat of Substitutes
- 4.7.5 Competitive Rivalry
5 MARKET SIZE AND GROWTH FORECASTS (VALUE)
- 5.1 By Platform
- 5.1.1 Online
- 5.1.2 Offline
- 5.2 By Advertising Channel
- 5.2.1 Social-media publishing
- 5.2.2 Search-engine ads
- 5.2.3 Display and online video
- 5.2.4 Influencer / creator marketing
- 5.2.5 Native advertising
- 5.2.6 TV spots
- 5.2.7 Radio commercials
- 5.2.8 Print media
- 5.2.9 Outdoor and transit (OOH / DOOH)
- 5.2.10 Direct mail
- 5.3 By End-user Industry
- 5.3.1 Retail (incl. grocery)
- 5.3.2 Ecommerce and DTC brands
- 5.3.3 Travel and tourism
- 5.3.4 Media and entertainment
- 5.3.5 Financial services
- 5.3.6 Healthcare and pharma
- 5.3.7 Automotive
- 5.3.8 Other End-user Industries
- 5.4 By Agency Type
- 5.4.1 Full-service integrated agency
- 5.4.2 Media-buying and planning agency
- 5.4.3 Digital-only performance agency
- 5.4.4 Creative boutique
- 5.4.5 In-house brand studio
- 5.5 By Geography
- 5.5.1 North America
- 5.5.1.1 United States
- 5.5.1.2 Canada
- 5.5.1.3 Mexico
- 5.5.2 South America
- 5.5.2.1 Brazil
- 5.5.2.2 Argentina
- 5.5.2.3 Rest of South America
- 5.5.3 Europe
- 5.5.3.1 Germany
- 5.5.3.2 United Kingdom
- 5.5.3.3 France
- 5.5.3.4 Italy
- 5.5.3.5 Spain
- 5.5.3.6 Russia
- 5.5.3.7 Rest of Europe
- 5.5.4 Asia Pacific
- 5.5.4.1 China
- 5.5.4.2 Japan
- 5.5.4.3 India
- 5.5.4.4 South Korea
- 5.5.4.5 Southeast Asia
- 5.5.4.6 Rest of Asia Pacific
- 5.5.5 Middle East and Africa
- 5.5.5.1 Saudi Arabia
- 5.5.5.2 United Arab Emirates
- 5.5.5.3 Turkey
- 5.5.5.4 South Africa
- 5.5.5.5 Rest of Middle East
- 5.5.1 North America
6 COMPETITIVE LANDSCAPE
- 6.1 Market Concentration
- 6.2 Strategic Moves
- 6.3 Market Share Analysis
- 6.4 Company Profiles (includes Global level Overview, Market level overview, Core Segments, Financials as available, Strategic Information, Market Rank / Share for key companies, Products and Services, and Recent Developments)
- 6.4.1 WPP plc
- 6.4.2 Omnicom Group Inc.
- 6.4.3 The Interpublic Group of Companies Inc.
- 6.4.4 Publicis Groupe S.A.
- 6.4.5 Dentsu Group Inc.
- 6.4.6 Havas S.A.
- 6.4.7 Stagwell Inc.
- 6.4.8 Accenture plc (Accenture Song)
- 6.4.9 Hakuhodo DY Holdings Inc.
- 6.4.10 Deloitte Touche Tohmatsu Ltd. (Deloitte Digital)
- 6.4.11 PwC Advisory Services LLP (PwC Digital Services)
- 6.4.12 Cognizant Technology Solutions Corp. (Cognizant Interactive)
- 6.4.13 IBM Corp. (IBM iX)
- 6.4.14 Salesforce Inc. (Marketing Cloud Services)
- 6.4.15 Lamar Advertising Company
- 6.4.16 JCDecaux SE
- 6.4.17 Clear Channel Outdoor Holdings Inc.
- 6.4.18 Fiverr International Ltd.
- 6.4.19 S4 Capital plc (Media.Monks)
- 6.4.20 Wieden + Kennedy Inc.
- 6.4.21 Droga5 LLC
- 6.4.22 Serviceplan Group SE and Co. KG
- 6.4.23 MandC Saatchi plc
7 MARKET OPPORTUNITIES AND FUTURE OUTLOOK
- 7.1 White-space and unmet-need assessment