

|
시장보고서
상품코드
2123462
법률 분석 시장 : 점유율 분석, 업계 동향과 통계, 성장 예측(2026-2031년)Legal Analytics - Market Share Analysis, Industry Trends & Statistics, Growth Forecasts (2026 - 2031) |
||||||
 Mordor Intelligence
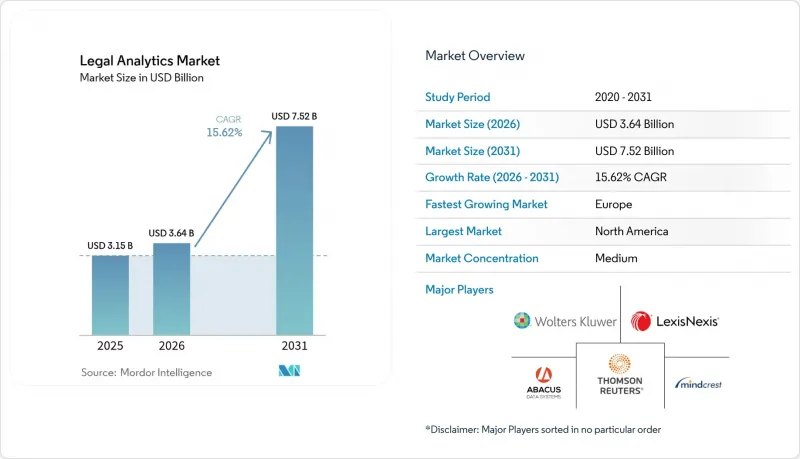
Mordor Intelligence에 의하면, 법률 분석 시장 규모는 2025년에 31억 5,000만 달러로 평가되었고 2026년 36억 4,000만 달러에서 2031년까지 75억 2,000만 달러에 이를 것으로 예측되며, 예측 기간(2026-2031년) CAGR은 15.62%를 나타낼 전망입니다.
본 보고서는 분석 유형(기술적 분석, 예측 분석, 처방적 분석), 배포 방식(클라우드, On-Premise), 최종 사용자(법률 사무소 등), 업무 분야(지적 재산권 관리, 자본 시장·기업 지배 구조, 사건 관리, M&A, 환경법 등) 및 지역별로 분류되어 있습니다. 시장 예측은 금액(달러) 기준으로 제시되어 있습니다.
세계 법률 분석 시장 동향 및 인사이트
AI 및 머신러닝 도입 확대
사내 변호사의 보고에 따르면, 계약서 검토 업무의 47%가 현재 머신러닝 모델에 의존하고 있다고 합니다. 이는 도입 주기를 3분의 2로 단축하는 벤더 주도형 도입 가이드북 덕분에 가능해진 비약적인 진전입니다. 문서 검토 비용이 60-80% 절감된다는 점은 특히 알고리즘이 수작업 검토보다 10배 빠르게 선행 기술 문헌을 처리하는 대량의 특허 검색에서 도입 확대의 근거로 자주 거론되고 있습니다. 이러한 효율화 덕분에 변호사는 복잡한 자문 업무에 시간을 할애할 수 있으며, 보수 협상에서 경쟁 우위를 높일 수 있습니다. 법학전문대학원과 변호사회에서는 현재 AI 리터러시 프로그램을 도입하고 있으며, 이를 통해 인재 공급원이 확대되고 있습니다. 도입이 정착됨에 따라 벤더들은 포인트 솔루션에서 검색, 예측, 결과 추적을 통합한 통일된 분석 제품군으로 초점을 옮기고 있습니다.
데이터 기반 의사 결정에 대한 수요 증가
이사회는 법무 부서에 재무 예측과 마찬가지로 세밀한 기준으로 리스크를 정량화할 것을 요구하고 있습니다. 현재 최고법무책임자(CLO)의 73%가 외부 변호사를 선정할 때 예측 대시보드 사용을 의무화하고 있습니다. 소송 담당 변호사는 과거 판사들의 분석 데이터를 참고하여 재판지 전략을 수립하고, 거래 담당 변호사는 유사한 거래에서의 성공률과 계약 조항 문구를 비교·검증하고 있습니다. 대체 보상 체계는 성과 달성 확률을 점점 더 중시하는 방향으로 변화하고 있으며, 로펌들은 과거에는 기밀 정보로 간주되던 데이터의 공개를 피할 수 없게 되었습니다. 이러한 투명성 증대로 인해 투자가 부족한 업무 부서는 현대화를 도모하거나 경쟁이 치열한 분야에서 철수할 수밖에 없게 되었습니다. 이러한 수요를 겨냥한 각 벤더 기업들은 순수한 알고리즘의 정교함보다는 데이터의 폭과 해석의 용이성을 통해 차별화를 꾀하고 있습니다.
중소기업의 높은 도입 비용
라이선싱에 더해 데이터 이전 및 직원 교육에 최대 6개월간의 업무 시간이 소요되므로, 청구 가능한 업무 시간이 압박을 받습니다. 규모의 경제를 실현할 수 없어 사용자당 비용은 여전히 높은 수준을 유지하고 있으며, 이러한 기술 격차의 확대가 업계 재편을 가속화하고 있습니다. 중견 사무소들은 공유 플랫폼을 이용하기 위해 합병 상대를 찾고 있습니다. 종량제 과금 등 혁신적인 가격 모델이 등장하고 있지만, 대규모 도입 실적은 아직 없습니다.
부문 분석
예측 엔진의 등장으로 인해, 고객과의 대화는 과거 실적에서 미래를 내다보는 전략으로 전환되고 있습니다. 2025년에도 서술형 도구는 여전히 법률 분석 시장의 52.10%를 차지하고 있었지만, 예측형 하위 부문은 연평균 성장률(CAGR) 16.02%로 성장하고 있어 그 격차는 급속히 좁혀질 것으로 예측됩니다. 사용자들은 일상적인 상사 분쟁에서 70-85%의 정확도를 보고하고 있으며, 이는 신뢰를 높이고 지속적인 이용을 촉진하고 있습니다. 예측형 용도의 법률 분석 시장 규모는 2025년에 10억 3,000만 달러로 집계되었으며, 현재의 지출 패턴이 지속된다면 2031년까지 2배로 증가할 것으로 예측됩니다. 지난 1년 동안 각 로펌은 사건 예산 템플릿에 ‘결과 점수’를 직접 반영하여, 파트너들이 정량화된 위험에 맞추어 보상 체계를 조정할 수 있도록 했습니다. 서술형 대시보드는 청구 및 업무 활용도 지표로서 여전히 필수적이지만, 그 가치는 과거 데이터 세트를 예측 알고리즘에 제공하는 데 있다는 측면이 더욱 부각되고 있습니다. 처방적 분석은 아직 발전 단계에 있지만, 외부 변호사 선정에 있어 시범 도입이 진행되고 있으며, 향후에는 폐쇄 루프형 의사결정 지원으로 전환될 조짐이 보입니다.
부수적인 효과도 이러한 추세를 뒷받침하고 있습니다. 법원은 판결문의 디지털화를 추진하고 있으며, 이로 인해 지도 학습 모델의 학습 데이터 세트가 확대되고 있습니다. 소송 리스크를 인수하는 보험사는 보험 계약 협상 시 예측 모델 문서를 요구하게 되어, 추가적인 수요를 창출하고 있습니다. 소프트웨어 벤더들은 확률 곡선을 쉬운 언어로 된 지침으로 변환하는 시각화 레이어를 통합하고 있어, 기술에 익숙하지 않은 이해관계자라도 인사이트력을 쉽게 이해할 수 있게 되었습니다. 이러한 동향들이 맞물리면서, 예측 기능은 법률 분석 시장에서 경쟁적 차별화를 도모하기 위한 다음 쟁점으로 자리 잡고 있습니다.
2025년에는 클라우드 도입이 전체 도입 건수의 68.45%를 차지하며, 레거시 On-Premise 시스템을 폐지할 경우 라이프사이클 비용이 40-50% 절감된다는 실증 데이터에 힘입어 2031년까지 연평균 성장률(CAGR) 16.5%로 성장할 것으로 전망됩니다. 법률 분석 시장에서 On-Premise형 스택의 점유율은 노후화된 인프라에 패치를 적용하는 데 드는 비용 증가에 직면한 로펌들의 영향으로 2025년에 처음으로 30% 아래로 떨어졌습니다. 각 벤더들은 개인정보 보호 규제 당국의 우려를 해소하기 위해 지역별 데이터 저장소 선택지를 맞춤화하고 있으며, 주요 플랫폼은 현재 최소 인증 기준으로 연례 SOC 2 Type II 감사를 통과하고 있습니다. 주권적 관리를 유지해야 하는 정부 기관에서는 여전히 하이브리드형 접근 방식이 지속되고 있습니다. 그러나 이러한 경우에도 기밀성이 낮은 워크로드는 클라우드로 이전되고 있습니다.
클라우드로의 전환을 통해 고급 기능을 폭넓게 이용할 수 있게 되었습니다. 과거에는 세계 기업에만 국한되었던 자연어 처리나 시각화 도구에 소규모 기업도 접근할 수 있게 되어, 경쟁 격차가 줄어들고 있습니다. 지속적 통합(CI) 파이프라인을 통해 기능 릴리스 주기가 분기별에서 주 단위로 단축되어, 규제 준수를 위한 신속한 업데이트가 보장되고 있습니다. 그러나 멀티테넌트 환경에 대한 의존은 ‘운명 공동체’ 리스크를 초래하기 때문에 보험사들은 법적 데이터 관련 리스크에 특화된 사이버 보험 특약을 개발하고 있습니다. 전반적으로 클라우드로의 전환은 되돌릴 수 없는 추세이며, 구독형 비즈니스 모델과 데이터·네트워크 효과가 법률 분석 시장의 핵심으로 자리 잡고 있습니다.
지역별 분석
북미는 확립된 e-디스커버리 지출과 성숙한 벤더 생태계의 뒷받침을 받아 2025년에도 매출 점유율 38.35%를 유지했습니다. 반면, 유럽은 연평균 성장률(CAGR) 16.55%로 확대되고 있으며, 기업들이 GDPR(EU 개인정보보호규정) 규정 준수 점검의 자동화 및 국경을 초월한 워크플로우의 표준화를 추진함에 따라 그 격차는 해마다 좁혀지고 있습니다. 현재 유럽의 일부 변호사 협회에서는 소송 전략에 사용되는 알고리즘에 대한 설명 가능성 감사를 의무화하고 있으며, 이는 플랫폼 업그레이드를 가속화하고 있습니다. 미국에서는 연방 법원의 디지털화 보조금에 힘입어 소송 기록 데이터가 계속해서 공개 저장소에 집계되고 있으며, 이를 통해 국내 벤더들은 훈련 데이터 측면에서 우위를 확보하고 지역 내 우위를 유지하고 있습니다.
아시아태평양 시장에서는 도입 현황에 편차가 보입니다. 일본과 호주에서는 클라우드 호스팅형 분석 제품군이 도입되고 있는 반면, 동남아시아의 많은 관할권에서는 판례의 디지털화가 진전되지 않아 이에 대한 대응에 어려움을 겪고 있습니다. 이 지역에서 사업을 전개하는 다국적 기업들은 통합 대시보드를 요구하고 있으며, 이는 세계 벤더와 현지 데이터 집계 업체간의 제휴를 촉진하고 있습니다. 싱가포르와 한국 정부는 리걸테크 샌드박스에 보조금을 지원하여, 전문적인 틈새 분야에서 기존 공급업체에 도전할 가능성이 있는 국내 스타트업을 육성하고 있습니다.
중동 및 아프리카에서는 시장 규모는 작지만 가장 높은 성장률을 보이고 있습니다. 두바이, 아부다비, 요하네스버그의 국제 중재 허브에서는 분석에 기반한 위험 평가를 권장하는 모델 조항이 도입되어, 지역 로펌들 사이에서 파급적인 수요가 발생하고 있습니다. 인프라 관련 분쟁에서는 아랍어, 영어, 프랑스어를 아우르는 이중 언어 지원 자연어 처리의 필요성이 부각되고 있습니다. 세계은행의 사법 현대화 프로젝트에서는 재판 기록의 디지털화에 자금이 배정되어, 향후 예측 분석 도입을 위한 기반이 마련되고 있습니다. 전반적으로, 각 지역의 동향은 과거 기술 면에서 뒤처져 있던 것으로 여겨졌던 시장으로 법률 분석 시장이 점차 재균형을 이루어 나가고 있음을 시사합니다.
기타 혜택:
- 엑셀 형식 시장 예측(ME) 시트
- 3개월간의 애널리스트 지원
자주 묻는 질문
목차
제1장 서론
제2장 조사 방법
제3장 주요 요약
제4장 시장 구도
제5장 시장 규모와 성장 예측
제6장 경쟁 구도
제7장 시장 기회와 향후 전망
JHS 26.09.09According to Mordor Intelligence, the legal analytics market size was valued at USD 3.15 billion in 2025 and estimated to grow from USD 3.64 billion in 2026 to reach USD 7.52 billion by 2031, at a CAGR of 15.62% during the forecast period (2026-2031).
This report is Segmented by Analytics Type (Descriptive Analytics, Predictive Analytics, and Prescriptive Analytics), Deployment Mode (Cloud, and On-Premise), End-User (Law Firms, and More), Practice Area (Intellectual Property Management, Capital Markets and Corporate Governance, Case Management, M&A and Environmental Law, and More), and Geography. The Market Forecasts are Provided in Terms of Value (USD).
Global Legal Analytics Market Trends and Insights
Rising Adoption of AI and Machine Learning
Corporate counsel reports that 47% of contract-review tasks now rely on machine learning models, a leap made possible by vendor-led implementation playbooks that cut deployment cycles by two-thirds. Document-review cost declines of 60-80% are routinely cited as justification for broader rollouts, especially in high-volume patent searches where algorithms process prior-art references ten times faster than manual review. These efficiency gains free attorney time for complex advisory work and sharpen competitive positioning during fee negotiations. Law schools and bar associations are now incorporating AI literacy programs, thereby expanding the talent pipeline. As adoption normalizes, vendors are shifting focus from point solutions to unified analytics suites that consolidate search, prediction, and outcome tracking.
Growing Demand for Data-Driven Decision Making
Boards expect legal departments to quantify risk in the same granular terms used for financial forecasting. Seventy-three percent of chief legal officers now mandate predictive dashboards when selecting outside counsel. Litigators consult historical judge analytics to refine forum strategy, while transactional lawyers benchmark clause language against success rates in comparable deals. Alternative fee arrangements increasingly rely on outcome probabilities, forcing firms to disclose data that was once proprietary. This transparency is pressuring under-invested practices to modernize or exit contested segments. Vendors targeting this demand differentiate themselves on the breadth of data and interpretability, rather than pure algorithmic sophistication.
High Implementation Costs for SMEs
Solo and small practices make up 76% of the profession but contribute only 23% of analytics spending, hamstrung by annual subscription bundles that can exceed USD 100,000. Beyond licensing, data migration, and staff training disrupts billable hours for up to six months. Without scale economies, per-user costs remain stubborn, widening a technology gap that fuels consolidation as mid-tier firms seek merger partners to access shared platforms. Innovative pricing models, such as consumption-based pricing, are emerging but remain untested at scale.
Other drivers and restraints analyzed in the detailed report include:
- Shift Toward Cloud-Based Legal Solutions
- Emergence of Litigation Funding Platforms
- Data Privacy and Security Concerns
For complete list of drivers and restraints, kindly check the Table Of Contents.
Segment Analysis
Predictive engines are shifting client conversations from past performance to forward-looking strategy. In 2025, descriptive tools still accounted for 52.10% of the legal analytics market, yet the predictive sub-segment is growing at 16.02% CAGR and is forecast to narrow that gap rapidly. Users cite 70-85% accuracy in routine commercial disputes, which heightens trust and spurs repeat usage. The legal analytics market size for predictive applications was measured at USD 1.03 billion in 2025 and is expected to double by 2031 if current spending patterns persist. Over the past year, firms have embedded outcome scores directly into matter-budget templates, allowing partners to tailor fee structures to quantified risk. Descriptive dashboards remain vital for billing and utilization metrics, but their value increasingly lies in feeding historical datasets to predictive algorithms. Prescriptive analytics, though nascent, is attracting pilots in outside-counsel selection, signaling an eventual move toward closed-loop decision support.
Second-order effects reinforce the momentum. Courts are digitizing judgments, expanding the training corpus for supervised models. Insurers underwriting litigation risk now request predictive-model documentation during policy negotiation, injecting further demand. Software vendors integrate visualization layers that translate probability curves into plain-language guidance, making insights digestible for non-technical stakeholders. Collectively, these trends position predictive capabilities as the next battleground for competitive differentiation within the legal analytics market.
Cloud installations captured 68.45% of total deployments in 2025 and are projected to grow at 16.5% CAGR through 2031, underpinned by evidence of 40-50% lifecycle cost savings once legacy on-premise systems are decommissioned. The legal analytics market share for on-premise stacks fell below 30% for the first time in 2025 as firms faced mounting expenses to patch aging infrastructure. Vendors tailor region-specific data-residency options to reassure privacy regulators, and leading platforms now pass annual SOC 2 Type II audits as a baseline credential. Hybrid patterns persist for government agencies that must retain sovereign control; however, even in these cases, non-sensitive workloads are migrating to the cloud.
The cloud shift democratises advanced functions. Smaller firms can now access natural-language processing and visualization tools once limited to global players, thereby compressing the competitive distance. Continuous integration pipelines shorten feature-release cycles from quarterly to weekly, ensuring rapid policy-compliance updates. However, reliance on multitenant environments introduces shared-fate risk, prompting insurers to develop cyber-coverage riders specifically for legal data exposures. Overall, the cloud trajectory appears irreversible, cementing subscription economics and data-network effects at the heart of the legal analytics market.
Complete Report Scope:
- By Analytics Type
- Descriptive Analytics
- Predictive Analytics
- Prescriptive Analytics
- By Deployment Mode
- Cloud
- On-Premise
- By End-User
- Law Firms
- Corporate Legal Departments
- Government and Regulatory Agencies
- By Practice Area
- Intellectual Property Management
- Capital Markets and Corporate Governance
- Case Management
- M&A and Environmental Law
- Financial Documentation Services
- Other Practice Area
- By Geography
- North America
- United States
- Canada
- Mexico
- South America
- Brazil
- Argentina
- Chile
- Rest of South America
- Europe
- United Kingdom
- Germany
- France
- Italy
- Spain
- Rest of Europe
- Asia-Pacific
- China
- Japan
- India
- South Korea
- Australia and New Zealand
- Rest of Asia-Pacific
- Middle East and Africa
- Middle East
- United Arab Emirates
- Saudi Arabia
- Turkey
- Rest of Middle East
- Africa
- South Africa
- Kenya
- Nigeria
- Rest of Africa
- Middle East
- North America
Geography Analysis
North America retained a 38.35% revenue share in 2025, driven by established e-discovery spending and mature vendor ecosystems. Yet Europe is advancing at 16.55% CAGR, narrowing the gap each year as firms automate GDPR compliance checks and standardize cross-border workflows. Several European bar associations now require explainability audits for algorithms used in litigation strategy, prompting accelerated platform upgrades. Federal court digitization grants in the United States continue to funnel docket data into public repositories, giving domestic vendors a training-data advantage that sustains local dominance.
Asia-Pacific markets display uneven adoption. Japan and Australia deploy cloud-hosted analytics suites, whereas many Southeast Asian jurisdictions grapple with sparse case-law digitization. Multinationals operating regionally demand unified dashboards, spurring partnerships between global vendors and local data aggregators. Governments in Singapore and South Korea subsidize legal-tech sandboxes, nurturing domestic start-ups that may challenge incumbent suppliers in specialized niches.
The Middle East and Africa post the highest percentage growth, albeit from a small base. International arbitration hubs in Dubai, Abu Dhabi, and Johannesburg introduce model clauses that recommend analytics-driven risk assessment, creating pull-through demand among regional law firms. Infrastructure-related disputes underscore the need for bilingual natural-language processing covering Arabic, English, and French. World Bank justice-modernization projects earmark funds for court-record digitization, laying the groundwork for future predictive-analytics deployment. Overall, regional trajectories suggest a gradual rebalancing of the legal analytics market toward markets once considered technology laggards.
- Wolters Kluwer N.V.
- Thomson Reuters Corporation
- Lexisnexis ( RELX plc )
- International Business Machines Corporation
- CS Disco Inc.
- Everlaw Inc.
- Proofpoint Inc.
- Clarivate Plc
- Relativity ODA LLC
- Luminance Technologies Ltd.
- Mindcrest Inc.
- UnitedLex Corporation
- Wipro Limited
- Abacus Data Systems Inc.
- Premonition LLC
- Brainspace LLC
- Argopoint LLC
- CPA Global Limited
- Kira Inc.
- Analytics Consulting LLC
Additional Benefits:
- The market estimate (ME) sheet in Excel format
- 3 months of analyst support
TABLE OF CONTENTS
1 INTRODUCTION
- 1.1 Study Assumptions and Market Definition
- 1.2 Scope of the Study
2 RESEARCH METHODOLOGY
3 EXECUTIVE SUMMARY
4 MARKET LANDSCAPE
- 4.1 Market Overview
- 4.2 Market Drivers
- 4.2.1 Rising Adoption of AI and Machine Learning
- 4.2.2 Growing Demand for Data-Driven Decision Making
- 4.2.3 Shift Toward Cloud-Based Legal Solutions
- 4.2.4 Emergence of Litigation Funding Platforms
- 4.2.5 Expansion of Alternative Legal Service Providers
- 4.2.6 Integration of Generative AI Into Pricing Tools
- 4.3 Market Restraints
- 4.3.1 High Implementation Costs for SMEs
- 4.3.2 Data Privacy and Security Concerns
- 4.3.3 Limited Structured Case Data in Emerging Markets
- 4.3.4 Ethical and Bias Governance Requirements
- 4.4 Industry Value Chain Analysis
- 4.5 Regulatory Landscape
- 4.6 Technological Outlook
- 4.7 Impact of Macroeconomic Factors on the market
- 4.8 Porter's Five Forces Analysis
- 4.8.1 Bargaining Power of Suppliers
- 4.8.2 Bargaining Power of Buyers
- 4.8.3 Threat of New Entrants
- 4.8.4 Threat of Substitutes
- 4.8.5 Intensity of Competitive Rivalry
5 MARKET SIZE AND GROWTH FORECASTS (VALUE)
- 5.1 By Analytics Type
- 5.1.1 Descriptive Analytics
- 5.1.2 Predictive Analytics
- 5.1.3 Prescriptive Analytics
- 5.2 By Deployment Mode
- 5.2.1 Cloud
- 5.2.2 On-Premise
- 5.3 By End-User
- 5.3.1 Law Firms
- 5.3.2 Corporate Legal Departments
- 5.3.3 Government and Regulatory Agencies
- 5.4 By Practice Area
- 5.4.1 Intellectual Property Management
- 5.4.2 Capital Markets and Corporate Governance
- 5.4.3 Case Management
- 5.4.4 M&A and Environmental Law
- 5.4.5 Financial Documentation Services
- 5.4.6 Other Practice Area
- 5.5 By Geography
- 5.5.1 North America
- 5.5.1.1 United States
- 5.5.1.2 Canada
- 5.5.1.3 Mexico
- 5.5.2 South America
- 5.5.2.1 Brazil
- 5.5.2.2 Argentina
- 5.5.2.3 Chile
- 5.5.2.4 Rest of South America
- 5.5.3 Europe
- 5.5.3.1 United Kingdom
- 5.5.3.2 Germany
- 5.5.3.3 France
- 5.5.3.4 Italy
- 5.5.3.5 Spain
- 5.5.3.6 Rest of Europe
- 5.5.4 Asia-Pacific
- 5.5.4.1 China
- 5.5.4.2 Japan
- 5.5.4.3 India
- 5.5.4.4 South Korea
- 5.5.4.5 Australia and New Zealand
- 5.5.4.6 Rest of Asia-Pacific
- 5.5.5 Middle East and Africa
- 5.5.5.1 Middle East
- 5.5.5.1.1 United Arab Emirates
- 5.5.5.1.2 Saudi Arabia
- 5.5.5.1.3 Turkey
- 5.5.5.1.4 Rest of Middle East
- 5.5.5.2 Africa
- 5.5.5.2.1 South Africa
- 5.5.5.2.2 Kenya
- 5.5.5.2.3 Nigeria
- 5.5.5.2.4 Rest of Africa
- 5.5.5.1 Middle East
- 5.5.1 North America
6 COMPETITIVE LANDSCAPE
- 6.1 Market Concentration
- 6.2 Strategic Moves
- 6.3 Market Share Analysis
- 6.4 Company Profiles (includes Global Level Overview, Market Level Overview, Core Segments, Financials as Available, Strategic Information, Market Rank/Share for Key Companies, Products and Services, and Recent Developments)
- 6.4.1 Wolters Kluwer N.V.
- 6.4.2 Thomson Reuters Corporation
- 6.4.3 Lexisnexis ( RELX plc )
- 6.4.4 International Business Machines Corporation
- 6.4.5 CS Disco Inc.
- 6.4.6 Everlaw Inc.
- 6.4.7 Proofpoint Inc.
- 6.4.8 Clarivate Plc
- 6.4.9 Relativity ODA LLC
- 6.4.10 Luminance Technologies Ltd.
- 6.4.11 Mindcrest Inc.
- 6.4.12 UnitedLex Corporation
- 6.4.13 Wipro Limited
- 6.4.14 Abacus Data Systems Inc.
- 6.4.15 Premonition LLC
- 6.4.16 Brainspace LLC
- 6.4.17 Argopoint LLC
- 6.4.18 CPA Global Limited
- 6.4.19 Kira Inc.
- 6.4.20 Analytics Consulting LLC
7 MARKET OPPORTUNITIES AND FUTURE OUTLOOK
- 7.1 White-Space and Unmet-Need Assessment


