
|
시장보고서
상품코드
2123489
과초산 시장 : 점유율 분석, 업계 동향과 통계, 성장 예측(2026-2031년)Peracetic Acid - Market Share Analysis, Industry Trends & Statistics, Growth Forecasts (2026 - 2031) |
||||||
 Mordor Intelligence
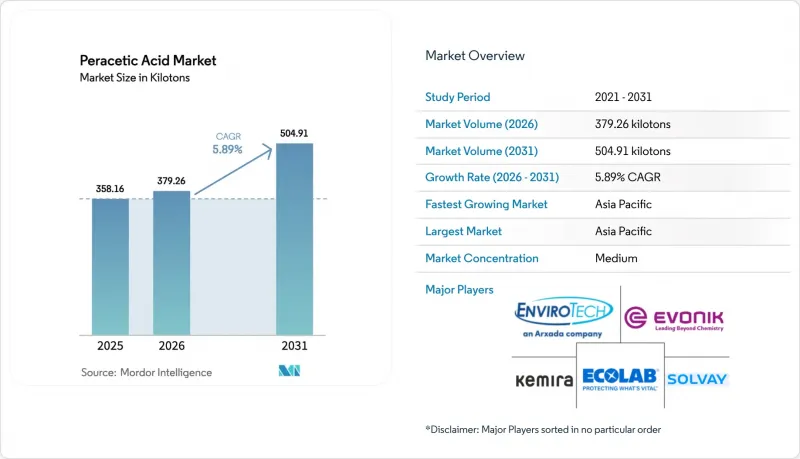
Mordor Intelligence에 의하면, 과초산 시장 규모는 2025년 358.16 킬로톤에서 2026년에는 379.26 킬로톤으로 확대되어 2031년까지 504.91 킬로톤에 이른다고 전망되고 있어 2026년부터 2031년까지 CAGR 5.89%를 나타낼 것으로 예측됩니다.
본 보고서는 제품 형태(액체 용액, 분말/과립, 수성 혼합물), 농도 등급(PAA 5% 미만, 5-15%, 15% 초과),용도(소독제, 산화제, 기타 용도), 최종 사용자 산업(식품 및 음료, 수처리 등), 지역(아시아태평양, 북미 등)별로 분류되어 있습니다. 시장 전망은 수량(톤) 단위로 표시되어 있습니다.
세계 과초산 시장 동향 및 인사이트
식품 안전 규제가 식품 및 음료의 위생 관리를 뒷받침
2024년부터 2025년까지 규제 당국은 직접 접촉형 소독제에 관한 규정을 개정하여, 가공업체가 제3자 감사 시 검증된 세균 수 감소 데이터를 제시하도록 의무화했습니다. 미국 농무부(USDA) 산하 식품안전검사국(FSIS)은 현재 즉석 육류 제품 표면의 리스테리아균에 대한 유효성 증명을 의무화하고 있습니다. 한편, EU의 살생물제 규정에서는 노린스(헹굼 불필요) 라인에 맞추어 공장 내 과초산(PAA) 사용량에 상한선이 설정되었습니다. 부패로 인한 손실을 해결하기 위해 인도의 식품표준안전청(FSSAI)은 수확 후 농산물에 대한 과초산(PAA) 사용을 승인했습니다. 이러한 규제는 전반적으로 액상 등급을 우선시하는 경향을 보이고 있습니다. 이는 가공업체가 고가의 희석 장치를 필요로 하지 않고 제조 라인에서 직접 사용할 수 있기 때문입니다. 이러한 동향을 바탕으로, 각 장비 제조업체들은 PAA 농도를 모니터링하는 실시간 센서를 통합하여 공장이 감사상의 과제를 해결할 수 있도록 지원하는 한편, 처리 능력이 높은 시설에서의 이 소독제 도입을 가속화하고 있습니다.
지자체 및 산업용 수처리 분야 수요 급증
미국 환경보호청(EPA)은 2024년에 잔류 염소의 허용치를 하향 조정하고, 상수도 유틸리티자에게 할로겐화 부산물이 아닌 산소와 아세트산으로 분해되는 화학 물질로의 전환을 촉구했습니다. EU와 중국 연안 지역에서도 유사한 움직임이 관찰되었으며, 수산 양식장에서 배출되는 폐수가 도시 하수와 혼합되기 시작하면서 비할로겐계 소독제에 대한 관심이 높아졌습니다. PAA는 염소와 동등한 접촉 시간으로 크립토스포리디움을 3로그 억제할 수 있는 한편, 트리할로메탄 기준치를 피할 수 있습니다. 펄프 공장이나 식품 공장의 산업 사용자들도 이산화염소의 저장이 폭발 위험을 초래하는 냉각탑 루프에서 PAA를 선호하여 채택하고 있습니다. 이러한 요인들이 복합적으로 작용하여, 2031년까지의 소독제 사용량에 대해 연평균 성장률(CAGR) 6.45%가 예측되고 있습니다.
직업적 위험 및 취급상의 과제
OSHA(미국 직업안전보건청) 규정에 따르면, PAA 농도가 15%를 초과하면 부식성이 있는 것으로 간주되어 2차 격리 조치 및 개인보호구(PPE)의 사용이 필요합니다. 열은 PAA의 분해를 가속화하기 때문에 통기식 저장 탱크로 개조하는 것은 예산을 증가시킬 가능성이 있습니다. 이러한 재정적·안전상의 과제는 신흥 경제국의 소규모 가공업체에게 특히 큰 부담이 되고 있으며, 전 세계적인 사업 확장을 저해하고 있습니다.
부문 분석
2025년에는 액체 용액이 총 출하량의 68.44%를 차지했습니다. 이는 식품 공장이나 폐수 처리 시설에 널리 도입된 기존 투여 펌프와의 호환성을 반영한 것입니다. 이러한 우위 덕분에 플랜트 수준의 과초산 시장 규모가 지탱되고 있습니다. 설비 개조는 계량률 조정 정도에 그치기 때문입니다. 수성 블렌드에 대한 수요는 연평균 성장률(CAGR) 6.12%로 증가하고 있습니다. 이는 이러한 블렌드에 포함된 안정제가 무균 포장 라인에서 스테인리스 스틸의 부식을 완화하기 때문입니다.
수용액 유형은 통합형 모니터링 장비를 도입하는 신축 유제품, 과즙, 제약 공장에서 선호되고 있습니다. 분말 및 과립 유형은 틈새 시장을 차지하고 있으며, 주로 재해 시 위생 대책이나 계절적인 연못 수질 처리 등에 이용되고 있습니다. 이러한 용도에서는 현장에서의 용해 필요성보다 낮은 운송 비용이 우선시됩니다. 각 공급업체는 블렌드 제품의 유통기한 연장을 위한 연구 개발에 계속해서 주력하고 있습니다. 이는 유통기한이 길어질수록 전 세계 운송 경로나 원격지 사용자와의 호환성이 좋아지기 때문입니다. 그 결과, 액상 솔루션이 여전히 과반의 점유율을 차지할 것으로 예상되지만, 신규 도입처에서는 부식 억제 효과가 있는 화학제품이 선호되는 경향이 있어 블렌드 제품의 점유율 확대에 따라 액상 솔루션의 점유율은 점차 축소될 것입니다.
중농도 대(PAA 5-15%)는 2025년에 판매량의 54.31%를 차지하고, 2031년까지 연평균 성장률(CAGR) 6.23%를 나타낼 것으로 예측되어, 농도 구분 중 과초산 시장에서 가장 큰 점유율을 확보할 전망입니다. 이 등급은 미생물을 신속하게 사멸시킬 수 있으며, 15%를 초과하는 농축액에 적용되는 엄격한 취급 규정을 피할 수 있습니다. 2024년, FDA는 가공업체가 이 농도를 사용함으로써 단 60초 만에 검증된 살균 효과를 달성할 수 있다는 지침을 발표하며, 빠르게 진행되는 육류 및 유제품 가공 현장에서 이 등급의 매력을 강조했습니다.
자동 희석 장치를 갖춘 지자체 운영 처리 시설에서는 주로 고농도 제품이 사용되고 있습니다. 한편, 저농도 등급은 헹굼이 필요 없다는 특성과 운송 규제가 완화된 덕분에 수확 후 농산물 세척에 선호되고 있습니다. 그러나 고농도 제품의 보급에는 과제도 있습니다. 추가 환기 설비나 보관 공간이 필요하기 때문에 실질적인 비용 절감 효과가 줄어들어 매력이 떨어지게 됩니다. 전체적으로 보면 중농도 제품이 계속해서 주류를 이룰 전망이지만, 사용자들은 특정 용도에 맞추어 선택함으로써 희석액이나 농축액과 같은 양극단의 제품으로 점점 더 기울고 있습니다.
지역별 분석
아시아태평양은 2025년 판매량의 38.67%를 차지하며 연평균 성장률(CAGR) 6.80%로 성장하고 있어, 지역별로는 가장 빠른 성장 궤도를 그리고 있습니다. 구자라트 주와 상하이의 새로운 과산화수소 생산 능력 확충으로 공급 경로가 단축되어 현지 배합 제조업체의 배송 비용이 절감되고 있습니다. 중국의 생화학적 산소 요구량(BOD) 규제 강화로 인해, 해안 도시, 특히 수산 양식 폐수가 도시 하수와 합류하는 지역에서는 차아염소산 나트륨보다 PAA가 우선적으로 채택되고 있습니다. 인도의 식품 규제 당국은 과일 및 채소 처리 과정에서 PAA 사용을 승인했으며, 콜드체인 미비로 인한 두 자릿수의 부패 손실을 배경으로 대량 수요 시장을 개척했습니다. 일본에서는 의약품 분야의 승인 범위가 확대되어, 이 화학 물질이 클린룸 소독 용도로도 활용되고 있습니다.
북미와 유럽은 성숙하고 안정적인 시장입니다. 미국 환경보호청(EPA)이 2024년에 잔류 염소 상한선을 강화함에 따라 주입 스키드에 대한 투자가 촉진되었으나, 인프라의 갱신 주기가 제한적이어서 성장률은 한 자릿수 중반에 머물고 있습니다. 유럽공급업체들은 에너지 가격에 연동된 원가 상승에 직면해 있어, 가격에 민감한 펄프 표백 분야의 전환 속도는 둔화되고 있지만, EU 살생물제 규정의 제95조에 등재된 점은 장기적인 신뢰를 강화하고 있습니다. 양 대륙의 수제 맥주 양조장은 저온 PAA를 이용한 CIP(현장 세척)를 도입하여 효율을 높이고, 에너지 및 물 사용량을 절감했습니다.
남미, 중동 및 아프리카에서는 예산 제약으로 인해 저렴한 염소 처리가 우선시되므로 도입량은 여전히 낮은 수준에 머물러 있습니다. 브라질의 고급 유칼립투스 펄프 부문에서는 산림 벌채를 우려하는 유럽 바이어들의 요구에 부응하기 위해 PAA의 시범 도입이 진행되고 있으나, 본격적인 상용화를 위해서는 합리적인 가격의 원료 확보가 필수적입니다. 걸프 연안 국가들의 해수 담수화 프로젝트에서는 PAA계 살생물제 주입에 자금이 배정되어 있으며, 에너지를 필요로 하지 않는 소독과 저온 역삼투법에 의한 전처리가 결합됨으로써 단계적인 성과가 기대되고 있습니다. 이러한 지역 전반에 걸쳐 규제 미비와 자본 부족이 도입 속도를 늦추고 있습니다.
기타 혜택:
- 엑셀 형식 시장 예측(ME) 시트
- 3개월간의 애널리스트 지원
자주 묻는 질문
목차
제1장 서론
제2장 조사 방법
제3장 주요 요약
제4장 시장 구도
제5장 시장 규모와 성장 예측
제6장 경쟁 구도
제7장 시장 기회와 향후 전망
JHS 26.09.09According to Mordor Intelligence, the peracetic acid market size is expected to increase from 358.16 kilotons in 2025 to 379.26 kilotons in 2026 and reach 504.91 kilotons by 2031, growing at a CAGR of 5.89% over 2026-2031.
This report is Segmented by Product Form (Liquid Solutions, Powder/Granules, and Aqueous Blends), Concentration Grade (Less Than 5% PAA, 5-15% PAA, and More Than 15% PAA), Application (Disinfectant, Oxidizer, and Other Applications), End-User Industry (Food and Beverage, Water Treatment, and More), and Geography (Asia-Pacific, North America, and More). Market Forecasts are Provided in Terms of Volume (Tons).
Global Peracetic Acid Market Trends and Insights
Food-Safety Regulations Boosting Food and Beverage Sanitation
In 2024-2025, regulators revised rules for direct-contact sanitizers, mandating processors to present validated log-reduction data during third-party audits. The USDA's Food Safety and Inspection Service has now mandated proof of efficacy against Listeria on the surfaces of ready-to-eat meats. Meanwhile, the EU's Biocidal Products Regulation has set a cap on in-plant PAA usage, aligning with no-rinse lines. Addressing spoilage losses, India's FSSAI has approved PAA for post-harvest produce. These collective regulations lean toward favoring liquid grades, as processors can utilize them in-line without the need for costly dilution equipment. In light of these developments, equipment manufacturers have integrated real-time sensors to monitor PAA strength, aiding plants in bridging audit gaps and accelerating the adoption of the disinfectant in high-throughput facilities.
Demand Surge from Municipal and Industrial Water Treatment
The U.S. Environmental Protection Agency lowered allowable chlorine residuals in 2024, pushing utilities toward a chemistry that breaks down into oxygen and acetic acid rather than halogenated by-products. Parallel moves in the EU and coastal China added momentum as aquaculture discharge began mixing with urban effluent, making non-halogenated disinfectants attractive. PAA offers 3-log Cryptosporidium control at contact times that match chlorine yet sidesteps trihalomethane limits. Industrial adopters in pulp and food plants also prefer PAA in cooling-tower loops where chlorine dioxide storage generates explosion risks. These factors jointly underpin the 6.45% CAGR projected for disinfectant use through 2031.
Occupational Hazards and Handling Challenges
Under OSHA rules, PAA concentrations exceeding 15% are deemed corrosive, necessitating secondary containment and personal protective equipment. Heat speeds up PAA decomposition, and retrofitting with vented storage tanks can inflate budgets. Such financial and safety challenges are particularly burdensome for small processors in emerging economies, hindering their global expansion.
Other drivers and restraints analyzed in the detailed report include:
- Shift from Chlorine to Eco-Friendly Pulp Bleaching Agents
- Growth in Low-Temperature Sterilization of Medical Devices
- High Cost Versus Chlorine-Based Substitutes
For complete list of drivers and restraints, kindly check the Table Of Contents.
Segment Analysis
Liquid solutions accounted for 68.44% volume in 2025, reflecting compatibility with legacy dosing pumps across food plants and wastewater treatment works. This dominance anchors the peracetic acid market size at the plant-level because retrofits involve little more than adjusting metering rates. Demand for aqueous blends is rising at a 6.12% CAGR because stabilizers inside these blends reduce corrosion on stainless steel in aseptic packaging lines.
Aqueous formats appeal to greenfield dairy, juice, and pharmaceutical plants that order integrated monitoring hardware. Powder and granule forms hold a niche share, mainly disaster-relief sanitation and seasonal pond treatment, where lower freight cost outweighs the need for on-site dissolution. Suppliers continue to focus research and development on extending blend shelf life, because longer storage pairs well with global shipping lanes and remote users. Consequently, liquid solutions will keep a majority share, though gains for blends will chip away at the margin as new installations favor corrosion-mitigated chemistries.
Medium Range (5-15% PAA) held 54.31% volume in 2025 and is projected to grow at a 6.23% CAGR through 2031, ensuring the highest peracetic acid market share among concentration tiers. The grade achieves a rapid microbial kill, sidestepping the stringent handling rules that come into play for concentrates exceeding 15%. In 2024, the FDA issued guidance indicating that processors can attain validated reductions in just 60 seconds with this concentration, underscoring its appeal for fast-paced meat and dairy operations.
Municipal plants, equipped with automated dilution skids, predominantly utilize high-concentration products. Lower-concentration grades are favored for washing post-harvest produce, thanks to their no-rinse properties and lenient transportation regulations. However, widespread adoption of high-concentration products faces hurdles; the need for additional ventilation and storage drives up net savings, making them less attractive. In the grand scheme, while medium concentrations are set to maintain their dominance, users are increasingly gravitating towards either end of the spectrum-dilute or concentrate-tailoring their choice to specific applications.
Complete Report Scope:
- By Product Form
- Liquid Solutions
- Powder / Granules
- Aqueous Blends
- By Concentration Grade
- Less than 5% PAA (Low)
- 5-15% PAA (Medium)
- More than 15% PAA (High)
- By Application
- Disinfectant
- Oxidizer
- Sterilant
- Other Applications (Bleaching Agent, Sanitizer, etc.)
- By End-user Industry
- Food and Beverage Processing
- Water Treatment
- Pulp and Paper
- Healthcare (including Pharmaceutical)
- Chemical
- Other End-user Industries (Agriculture and Aquaculture, etc.)
- By Geography (Volume)
- Asia-Pacific
- China
- India
- Japan
- South Korea
- Rest of Asia-Pacific
- North America
- United States
- Canada
- Mexico
- Europe
- Germany
- United Kingdom
- France
- Italy
- Rest of Europe
- South America
- Brazil
- Argentina
- Rest of South America
- Middle-East and Africa
- Saudi Arabia
- South Africa
- Rest of Middle-East and Africa
- Asia-Pacific
Geography Analysis
Asia-Pacific captured 38.67% of the 2025 volume and is growing at a 6.80% CAGR, the fastest regional trajectory. New hydrogen-peroxide capacity in Gujarat and Shanghai shortens supply lines and trims delivered costs for local formulators. China's tougher biochemical-oxygen-demand limits push coastal cities to favor PAA over sodium hypochlorite, especially where aquaculture discharge merges with municipal wastewater. India's food regulators backed PAA for fruit and vegetable treatment, opening a high-volume channel because cold-chain gaps cause double-digit spoilage losses. Japan broadened pharmaceutical approvals, moving the chemistry into cleanroom disinfection work.
North America and Europe represent mature but steady terrain. The U.S. EPA's tighter residual-chlorine ceiling in 2024 triggered spending on injection skids, yet infrastructure turnover limits growth to mid-single digits. European suppliers face energy-linked cost inflation, slowing switches in price-sensitive pulp bleaching, although Article 95 listing under the EU Biocidal Products Regulation reinforces long-term confidence. Craft breweries on both continents improved efficiency by embracing cold PAA CIP, cutting energy and water use.
South America, the Middle East, and Africa remain volume laggards because budget constraints favor cheaper chlorination. Brazil's premium eucalyptus pulp segment is piloting PAA to satisfy European buyers wary of deforestation, yet full commercialization depends on affordable feedstock. Gulf State desalination projects allocated funds for PAA biocide dosing, indicating incremental gains where energy-free disinfection aligns with low-temperature reverse-osmosis pretreatment. Across these regions, regulatory gaps and capital scarcity temper the pace of adoption.
- ACURO ORGANICS LIMITED
- Aditya Birla Chemicals
- Airedale Group
- Biosan
- Brainerd Chemical
- Christeyns
- Diversey, Inc.
- Ecolab
- Enviro Tech Chemical Services, Inc.
- Evonik Industries AG
- Hydrite Chemical
- Jubilant Pharmova Limited
- Kemira
- MITSUBISHI GAS CHEMICAL COMPANY, INC.
- Solvay
- STOCKMEIER Group
Additional Benefits:
- The market estimate (ME) sheet in Excel format
- 3 months of analyst support
TABLE OF CONTENTS
1 Introduction
- 1.1 Study Assumptions and Market Definition
- 1.2 Scope of the Study
2 Research Methodology
3 Executive Summary
4 Market Landscape
- 4.1 Market Overview
- 4.2 Market Drivers
- 4.2.1 Food-safety regulations boosting food and beverage sanitation
- 4.2.2 Demand surge from municipal and industrial water treatment
- 4.2.3 Shift from chlorine to eco-friendly pulp bleaching agents
- 4.2.4 Growth in low-temperature sterilisation of medical devices
- 4.2.5 Craft-brewery adoption in cold-clean-in-place (CIP) cycles
- 4.3 Market Restraints
- 4.3.1 Occupational hazards and handling challenges
- 4.3.2 High cost versus chlorine-based substitutes
- 4.3.3 Volatility of key precursors (acetic anhydride, H2O2)
- 4.4 Value Chain Analysis
- 4.5 Porter's Five Forces
- 4.5.1 Bargaining Power of Suppliers
- 4.5.2 Bargaining Power of Buyers
- 4.5.3 Threat of New Entrants
- 4.5.4 Threat of Substitute Products and Services
- 4.5.5 Degree of Competition
5 Market Size and Growth Forecasts (Volume)
- 5.1 By Product Form
- 5.1.1 Liquid Solutions
- 5.1.2 Powder / Granules
- 5.1.3 Aqueous Blends
- 5.2 By Concentration Grade
- 5.2.1 Less than 5% PAA (Low)
- 5.2.2 5-15% PAA (Medium)
- 5.2.3 More than 15% PAA (High)
- 5.3 By Application
- 5.3.1 Disinfectant
- 5.3.2 Oxidizer
- 5.3.3 Sterilant
- 5.3.4 Other Applications (Bleaching Agent, Sanitizer, etc.)
- 5.4 By End-user Industry
- 5.4.1 Food and Beverage Processing
- 5.4.2 Water Treatment
- 5.4.3 Pulp and Paper
- 5.4.4 Healthcare (including Pharmaceutical)
- 5.4.5 Chemical
- 5.4.6 Other End-user Industries (Agriculture and Aquaculture, etc.)
- 5.5 By Geography (Volume)
- 5.5.1 Asia-Pacific
- 5.5.1.1 China
- 5.5.1.2 India
- 5.5.1.3 Japan
- 5.5.1.4 South Korea
- 5.5.1.5 Rest of Asia-Pacific
- 5.5.2 North America
- 5.5.2.1 United States
- 5.5.2.2 Canada
- 5.5.2.3 Mexico
- 5.5.3 Europe
- 5.5.3.1 Germany
- 5.5.3.2 United Kingdom
- 5.5.3.3 France
- 5.5.3.4 Italy
- 5.5.3.5 Rest of Europe
- 5.5.4 South America
- 5.5.4.1 Brazil
- 5.5.4.2 Argentina
- 5.5.4.3 Rest of South America
- 5.5.5 Middle-East and Africa
- 5.5.5.1 Saudi Arabia
- 5.5.5.2 South Africa
- 5.5.5.3 Rest of Middle-East and Africa
- 5.5.1 Asia-Pacific
6 Competitive Landscape
- 6.1 Market Concentration
- 6.2 Strategic Moves
- 6.3 Market Share(%)/Ranking Analysis
- 6.4 Company Profiles (includes Global-level Overview, Market-level Overview, Core Segments, Financials as available, Strategic Information, Products and Services, and Recent Developments)
- 6.4.1 ACURO ORGANICS LIMITED
- 6.4.2 Aditya Birla Chemicals
- 6.4.3 Airedale Group
- 6.4.4 Biosan
- 6.4.5 Brainerd Chemical
- 6.4.6 Christeyns
- 6.4.7 Diversey, Inc.
- 6.4.8 Ecolab
- 6.4.9 Enviro Tech Chemical Services, Inc.
- 6.4.10 Evonik Industries AG
- 6.4.11 Hydrite Chemical
- 6.4.12 Jubilant Pharmova Limited
- 6.4.13 Kemira
- 6.4.14 MITSUBISHI GAS CHEMICAL COMPANY, INC.
- 6.4.15 Solvay
- 6.4.16 STOCKMEIER Group
7 Market Opportunities and Future Outlook
- 7.1 White-space and Unmet-Need Assessment
- 7.2 Increasing Usage in Aseptic Packaging Applications