|
시장보고서
상품코드
2123529
휘발성 유기화합물(VOC) 가스 센서 시장 : 점유율 분석, 업계 동향과 통계, 성장 예측(2026-2031년)Volatile Organic Compound Gas Sensor - Market Share Analysis, Industry Trends & Statistics, Growth Forecasts (2026 - 2031) |
||||||
 Mordor Intelligence
Mordor Intelligence에 의하면, 휘발성 유기화합물(VOC) 가스 센서 시장 규모는 2025년 45억 달러에서 2026년에는 46억 9,000만 달러로 확대되어 2026년부터 2031년까지 CAGR 4.12%로 성장을 지속하여, 2031년에는 57억 3,000만 달러에 이를 것으로 예측됩니다.
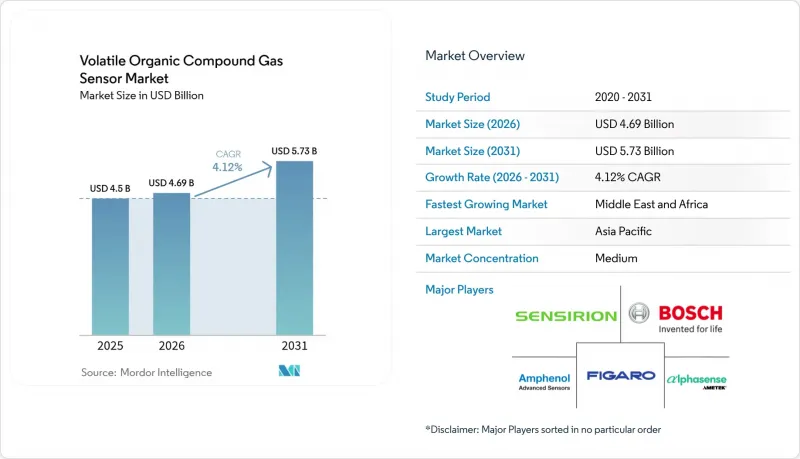
본 보고서는 센서 기술(광이온화 검출기, 광학식 등), 디바이스 폼 팩터(웨어러블 배지 등), 연결성(유선, 무선),최종 이용 산업(산업 안전 등), 감지 범위(1ppm 미만 등), 판매 채널(직접 판매 등), 지역별로 분류되어 있습니다. 시장 예측은 금액(달러) 기준으로 제시되어 있습니다.
전 세계 휘발성 유기화합물 가스 센서 시장 동향 및 인사이트
북미·유럽의 실내 공기질 기준 강화
건물 소유주는 포름알데히드, 벤젠 및 기타 VOC에 대한 강화된 노출 한계치를 지속적으로 준수하고 있음을 입증해야 합니다. 벽면 설치형 고정 감지기 및 BACnet 게이트웨이의 일괄 조달을 통해 병원, 학교, 교통 거점에서의 신속한 개보수가 촉진되고 있습니다. 수요는 ASHRAE-62.1 및 EN-16798 지침을 준수하는 프로젝트에 집중되어 있으며, 이것이 휘발성 유기화합물 가스 센서 시장의 단기적인 성장세를 뒷받침하고 있습니다.
스마트 홈 IoT 플랫폼에 휘발성 유기화합물 가스 센서 통합
음성 어시스턴트 허브 및 네트워크 연결형 온도 조절기를 통해 VOC 감지는 웰니스 기능으로 자리 잡고 있습니다. 소비 전력이 20 mW 미만인 MOS 칩은 I2C 및 BLE를 통해 통합되며, Matter 1.2의 상호 운용성을 통해 벤더에 구애받지 않는 페어링이 가능해졌습니다. 출하량 증가로 인해 대상 시장이 확대되고 단가가 하락함에 따라 휘발성 유기화합물 가스 센서 시장의 중기적인 성장이 지속되고 있습니다.
고습도 환경에서의 PID 센서 교정 드리프트
상대 습도가 85%를 초과하는 환경에서는 물 분자가 광이온화를 억제하기 때문에 PID 출력이 15% 저하될 가능성이 있습니다. 사용자는 보정 알고리즘이나 빈번한 재보정에 드는 추가 비용을 부담하게 되어, 동남아시아 및 남미 일부 지역의 식품 가공 공장이나 펄프 공장에서의 단기적인 도입이 주춤하고 있습니다.
부문 분석
MOS 디바이스는 2025년에 매출의 25.86%를 차지하며, 가격과 성능의 균형이 잘 잡혀 있어 휘발성 유기화합물 가스 센서 시장에서 가장 큰 점유율을 유지할 것으로 보입니다. 광이온화 검출기(PID)는 2031년까지 연평균 성장률(CAGR) 7.85%를 기록하며, 휘발성 유기화합물 가스 센서 시장 전체를 상회하는 성장이 예상됩니다. 고급 산업 사용자들은 3초 미만의 응답 시간과 광범위한 화학 물질 감지 범위를 요구하고 있으며, 이것이 PID 모듈의 휘발성 유기화합물 가스 센서 시장 규모를 끌어올리고 있습니다. 향후 MOS 로드맵에는 물질의 선택성을 높이기 위한 멀티 픽셀 어레이가 통합될 예정인 반면, PID 공급업체들은 서브 ppm 수준의 감도를 실현하기 위해 그래핀 윈도우 채택을 검토하고 있습니다.
MOS 부문 전체에서는 틈새 용도가 PID 및 석영 마이크로 밸런스 설계로 전환되고 있음에도 불구하고, 웨이퍼 비용의 하락과 온도 변조 알고리즘 덕분에 기존 제조업체들 시장 점유율은 유지되고 있습니다. 신규 진출기업들은 히터 구동 패턴에 관한 지적 재산의 축적을 극복해야 하며, 이것이 휘발성 유기화합물 가스 센서 시장의 진입 장벽이 되고 있습니다.
벽걸이형 패널은 2025년 매출의 41.12%를 차지하며, PoE 케이블에 의존하는 빌딩 자동화 개조에서 여전히 핵심적인 역할을 하고 있습니다. 웨어러블 배지는 9.12%라는 가장 높은 연평균 성장률(CAGR)을 기록하고 있으며, 이는 디지털 로그북에 기록된 개인의 노출 데이터에 대한 규제적 중요성을 반영합니다. MEMS-PID 설계가 8시간의 배터리 수명을 실현함에 따라, 배지 관련 휘발성 유기화합물 가스 센서 시장 규모는 꾸준히 확대되고 있습니다.
휴대용 핸드헬드 감지기는 여전히 응급 대응자에게 중요하지만, 규정 준수 문서화를 지원하는 연속 고정형 모니터에 판매량을 내주고 있습니다. 다중 매개변수 IAQ 큐브는 개별 센서를 마더보드의 도터 카드에 직접 통합하는 스마트 온도 조절기 OEM 업체들의 경쟁에 직면해 있지만, 여전히 휘발성 유기화합물 가스 센서 시장에 의미 있는 기여를 하고 있습니다.
지역별 분석
아시아태평양은 중국, 일본, 한국의 기가팩토리 및 양극 활물질 생산 능력 확대에 힘입어 2025년 매출의 31.55%를 차지했습니다. PID 센서는 엣지 분석 박스와 결합되어 각 성의 환경국에 실시간 대시보드를 제공해야 하는 신속한 규정 준수 감사에 대응하고 있습니다. 배터리 및 반도체 공급망에 대한 투자로 인해 아시아태평양은 휘발성 유기화합물 가스 센서 시장에서 가장 중요한 지역으로서의 입지를 확고히 하고 있습니다.
북미에서는 VOC 모니터링 기능을 통합한 고효율 HVAC 시스템에 대한 연방 세액 공제를 통해 자금을 지원받는 건물 개보수 주기의 혜택을 누리고 있습니다. 기업 캠퍼스에서는 LoRaWAN IAQ 노드를 사용하여 작업장의 건강 상태를 추적하고 있으며, 캐나다 그린빌딩 협의회는 지속적인 보고에 대해 LEED 점수를 부여하고 있어 휘발성 유기화합물 가스 센서 시장을 뒷받침하고 있습니다.
유럽의 에코디자인 지침에 따라 제조업체는 사용 시 VOC 성능을 공개해야 합니다. 독일의 자동차 도장 공장에서는 고정식 모니터를 통해 아세톤 증기를 10ppm 미만으로 유지하고 있습니다. 중동 및 아프리카에서는 사우디아라비아와 아랍에미리트(UAE)의 스마트 시티 시범 사업을 통해 IAQ 대시보드가 지자체 지휘 센터에 통합되어,남아프리카의 광산에서는 지하 작업자를 대상으로 웨어러블 배지의 시범 도입이 이루어지고 있어 8.85%라는 가장 높은 연평균 성장률(CAGR)을 기록하고 있으며, 이로 인해 해당 지역의 휘발성 유기화합물 가스 센서 시장이 확대되고 있습니다.
남미에서는 보다 안정적인 성장이 나타나고 있습니다. 브라질은 국내 노출 한계치를 ACGIH 기준표에 부합하도록 조정하여, 상파울루 근교의 석유화학 단지를 통한 조달을 촉진하고 있습니다. 멕시코의 마키라도라 코리도에서는 USMCA의 환경 조항을 준수하기 위해 저비용 MOS 센서가 도입되고 있으며, 이것이 해당 지역 전체의 휘발성 유기화합물 가스 센서 시장을 뒷받침하고 있습니다.
기타 혜택:
- 엑셀 형식 시장 예측(ME) 시트
- 3개월간의 애널리스트 지원
자주 묻는 질문
목차
제1장 서론
제2장 조사 방법
제3장 주요 요약
제4장 시장 구도
제5장 시장 규모와 성장 예측
제6장 경쟁 구도
제7장 시장 기회와 향후 전망
JHS 26.09.09According to Mordor Intelligence, the vOC sensors market size is expected to grow from USD 4.5 billion in 2025 to USD 4.69 billion in 2026 and is forecast to reach USD 5.73 billion by 2031 at 4.12% CAGR over 2026-2031.
This report is Segmented by Sensor Technology (Photoionization Detector, Optical, and More), Device Form Factor (Wearable Badges, and More), Connectivity (Wired, Wireless), End-Use Industry (Industrial Safety, and More), Detection Range (Less Than 1 Ppm, and More), Distribution Channel (Direct Sales, and More), and Geography. The Market Forecasts are Provided in Terms of Value (USD).
Global Volatile Organic Compound Gas Sensor Market Trends and Insights
Stricter Indoor-Air-Quality Standards across North America & Europe
Building owners must demonstrate continuous compliance with tightened exposure limits for formaldehyde, benzene and other VOCs. Bulk procurement of fixed wall-mounted detectors and BACnet gateways supports rapid retrofits in hospitals, schools and transit hubs. Demand concentrates on projects governed by ASHRAE-62.1 and EN-16798 guidelines, anchoring short-term momentum for the VOC sensors market.
Integration of VOC Sensors into Smart-Home IoT Platforms
Voice-assistant hubs and connected thermostats position VOC sensing as a wellness feature. MOS chips drawing less than 20 mW integrate over I2C or BLE, while Matter 1.2 interoperability enables vendor-agnostic pairing. High shipment volumes widen the addressable base and lower unit prices, sustaining medium-term growth for the VOC sensors market.
Calibration Drift of PID Sensors in High-Humidity Climates
PID output can drop 15% in environments above 85% relative humidity as water molecules quench photoionisation. Users incur added costs for compensation algorithms and frequent recalibration, tempering near-term uptake in food-processing plants and pulp mills across Southeast Asia and parts of South America.
Other drivers and restraints analyzed in the detailed report include:
- Demand from EV Battery Manufacturing Lines in Asia
- Adoption of Low-Power MEMS-PID Sensors Enabling Wearable Badges
- Lack of Harmonised Interoperability Protocols among Sensor Brands
For complete list of drivers and restraints, kindly check the Table Of Contents.
Segment Analysis
MOS devices generated 25.86% of revenue in 2025, holding the largest VOC sensors market share because they balance price and performance. Photoionization detectors will post a 7.85% CAGR through 2031, outpacing the overall VOC sensors market. Premium industrial users require sub-3-second response times and wide chemical coverage, driving the VOC sensors market size for PID modules upward. Future MOS roadmaps incorporate multi-pixel arrays for species selectivity, while PID vendors explore graphene windows to reach sub-ppm sensitivity.
Across the MOS segment, falling wafer costs and temperature-modulation algorithms safeguard incumbent share even as niche applications shift to PID or quartz-crystal microbalance designs. Entrants must navigate intellectual-property clusters covering heater-drive patterns, which raise barriers in the VOC sensors market.
Wall-mounted panels captured 41.12% of 2025 revenue and remain core to building-automation retrofits that rely on PoE cabling. Wearable badges post the highest 9.12% CAGR, reflecting regulatory emphasis on personal exposure data in digital logbooks. The VOC sensors market size tied to badges climbs steadily as MEMS-PID designs prove eight-hour battery life.
Portable handheld detectors retain relevance for first responders but cede volume to continuous fixed monitors that support compliance documentation. Multi-parameter IAQ cubes face competition from smart-thermostat OEMs that integrate individual sensors directly onto motherboard daughtercards, yet they still contribute meaningfully to the VOC sensors market.
Complete Report Scope:
- By Sensor Technology
- Photoionization Detector (PID)
- Metal Oxide Semiconductor (MOS)
- Electrochemical Sensor
- Optical Fiber Sensor
- Quartz Crystal Microbalance (QCM)
- Others
- By Device Form Factor
- Fixed/Wall-Mounted Monitors
- Handheld/Portable Detectors
- Wearable Badges
- Integrated Multi-Parameter IAQ Monitors
- Embedded Sensor Modules
- By Connectivity
- Wired (BACnet, Modbus, Ethernet, CAN)
- Wireless
- Wi-Fi
- Bluetooth/BLE
- Zigbee/Thread
- LoRaWAN/NB-IoT/LTE-M
- By End-use Industry
- Industrial Process Safety
- Oil and Gas and Petrochemical
- Automotive and Transportation
- Consumer Electronics and Smart Homes
- Commercial Buildings and Offices
- Healthcare and Pharmaceuticals
- Food and Beverage Production
- Academic and RandD Laboratories
- Others
- By Detection Range
- Less than 1 ppm
- 1 - 10 ppm
- 10 - 100 ppm
- Greater than 100 ppm
- By Distribution Channel
- Direct Sales
- Distributor / VAR Channel
- E-commerce
- By Geography
- North America
- United States
- Canada
- Mexico
- Europe
- United Kingdom
- Germany
- France
- Italy
- Rest of Europe
- Asia-Pacific
- China
- Japan
- India
- South Korea
- Rest of Asia-Pacific
- Middle East
- Israel
- Saudi Arabia
- United Arab Emirates
- Turkey
- Rest of Middle East
- Africa
- South Africa
- Egypt
- Rest of Africa
- South America
- Brazil
- Argentina
- Rest of South America
- North America
Geography Analysis
Asia-Pacific contributed 31.55% of 2025 turnover, supported by gigafactory and cathode-active-material capacity expansions in China, Japan and South Korea. PID sensors pair with edge-analytics boxes to meet rapid compliance audits that require real-time dashboards delivered to provincial environmental bureaus. Investments in battery and semiconductor supply chains position Asia-Pacific as the foremost region within the VOC sensors market.
North America benefits from a building-retrofit cycle funded by federal tax credits that subsidize high-efficiency HVAC systems integrating VOC monitoring. Enterprise campuses use LoRaWAN IAQ nodes to track workplace wellness, and Canada's green-building council awards LEED points for continuous reporting, reinforcing the VOC sensors market.
Europe's Ecodesign directive pushes manufacturers to disclose VOC performance in use. Fixed monitors maintain acetone vapors below 10 ppm in German automotive paint shops. The Middle East and Africa post the quickest 8.85% CAGR as smart-city pilots in Saudi Arabia and the United Arab Emirates embed IAQ dashboards into municipal command centers, and South African mines trial wearable badges for underground crews, enlarging the regional VOC sensors market.
South America experiences steadier growth. Brazil aligns national exposure limits with ACGIH tables, driving procurement by petrochemical complexes near Sao Paulo. Mexico's maquiladora corridor adds low-cost MOS sensors to comply with USMCA environmental clauses, supporting the VOC sensors market across the region.
- ABB Ltd.
- Alphasense Ltd.
- Aeroqual Limited
- Ion Science Ltd.
- EcoSensors Inc.
- SGX Sensortech Ltd.
- Renesas Electronics Corp.
- Sensirion AG
- Amphenol Advanced Sensors
- Figaro Engineering Inc.
- Bosch Sensortec GmbH
- AMS OSRAM AG
- City Technology (Honeywell Intl.)
- GfG Europe Ltd.
- MicroJet Technology Co., Ltd.
- Riken Keiki Co., Ltd.
- Dragerwerk AG and Co. KGaA
- Kaiterra
- Siemens AG
- Spec Sensors LLC
- NevadaNano Inc.
- Zhengzhou Winsen Electronics Tech. Co., Ltd.
Additional Benefits:
- The market estimate (ME) sheet in Excel format
- 3 months of analyst support
TABLE OF CONTENTS
1 INTRODUCTION
- 1.1 Study Assumptions and Market Definition
- 1.2 Scope of the Study
2 RESEARCH METHODOLOGY
3 EXECUTIVE SUMMARY
4 MARKET LANDSCAPE
- 4.1 Market Overview
- 4.2 Market Drivers
- 4.2.1 Tightening Indoor Air-Quality Standards across North America and Europe
- 4.2.2 Integration of VOC Sensors into Smart-Home IoT Platforms
- 4.2.3 Demand from EV Battery Manufacturing Lines in Asia for Solvent-Leak Detection
- 4.2.4 Adoption of Low-Power MEMS-PID Sensors Enabling Wearable VOC Badges
- 4.2.5 Green-Building Certification Schemes Mandating Continuous VOC Monitoring
- 4.3 Market Restraints
- 4.3.1 Calibration Drift of PID Sensors in High-Humidity Climates
- 4.3.2 Lack of Harmonised Interoperability Protocols among Sensor Brands
- 4.3.3 Price Sensitivity in Mass-Market Smart-Home Segment
- 4.3.4 Supply-Chain Volatility for Semiconductor Sensor Materials
- 4.4 Value / Supply-Chain Analysis
- 4.5 Regulatory or Technological Outlook
- 4.6 Porter's Five Forces Analysis
- 4.6.1 Threat of New Entrants
- 4.6.2 Bargaining Power of Buyers
- 4.6.3 Bargaining Power of Suppliers
- 4.6.4 Threat of Substitute Products
- 4.6.5 Intensity of Competitive Rivalry
5 MARKET SIZE AND GROWTH FORECASTS (VALUE)
- 5.1 By Sensor Technology
- 5.1.1 Photoionization Detector (PID)
- 5.1.2 Metal Oxide Semiconductor (MOS)
- 5.1.3 Electrochemical Sensor
- 5.1.4 Optical Fiber Sensor
- 5.1.5 Quartz Crystal Microbalance (QCM)
- 5.1.6 Others
- 5.2 By Device Form Factor
- 5.2.1 Fixed/Wall-Mounted Monitors
- 5.2.2 Handheld/Portable Detectors
- 5.2.3 Wearable Badges
- 5.2.4 Integrated Multi-Parameter IAQ Monitors
- 5.2.5 Embedded Sensor Modules
- 5.3 By Connectivity
- 5.3.1 Wired (BACnet, Modbus, Ethernet, CAN)
- 5.3.2 Wireless
- 5.3.2.1 Wi-Fi
- 5.3.2.2 Bluetooth/BLE
- 5.3.2.3 Zigbee/Thread
- 5.3.2.4 LoRaWAN/NB-IoT/LTE-M
- 5.4 By End-use Industry
- 5.4.1 Industrial Process Safety
- 5.4.2 Oil and Gas and Petrochemical
- 5.4.3 Automotive and Transportation
- 5.4.4 Consumer Electronics and Smart Homes
- 5.4.5 Commercial Buildings and Offices
- 5.4.6 Healthcare and Pharmaceuticals
- 5.4.7 Food and Beverage Production
- 5.4.8 Academic and RandD Laboratories
- 5.4.9 Others
- 5.5 By Detection Range
- 5.5.1 Less than 1 ppm
- 5.5.2 1 - 10 ppm
- 5.5.3 10 - 100 ppm
- 5.5.4 Greater than 100 ppm
- 5.6 By Distribution Channel
- 5.6.1 Direct Sales
- 5.6.2 Distributor / VAR Channel
- 5.6.3 E-commerce
- 5.7 By Geography
- 5.7.1 North America
- 5.7.1.1 United States
- 5.7.1.2 Canada
- 5.7.1.3 Mexico
- 5.7.2 Europe
- 5.7.2.1 United Kingdom
- 5.7.2.2 Germany
- 5.7.2.3 France
- 5.7.2.4 Italy
- 5.7.2.5 Rest of Europe
- 5.7.3 Asia-Pacific
- 5.7.3.1 China
- 5.7.3.2 Japan
- 5.7.3.3 India
- 5.7.3.4 South Korea
- 5.7.3.5 Rest of Asia-Pacific
- 5.7.4 Middle East
- 5.7.4.1 Israel
- 5.7.4.2 Saudi Arabia
- 5.7.4.3 United Arab Emirates
- 5.7.4.4 Turkey
- 5.7.4.5 Rest of Middle East
- 5.7.5 Africa
- 5.7.5.1 South Africa
- 5.7.5.2 Egypt
- 5.7.5.3 Rest of Africa
- 5.7.6 South America
- 5.7.6.1 Brazil
- 5.7.6.2 Argentina
- 5.7.6.3 Rest of South America
- 5.7.1 North America
6 COMPETITIVE LANDSCAPE
- 6.1 Market Concentration
- 6.2 Strategic Moves
- 6.3 Market Share Analysis
- 6.4 Company Profiles {(includes Global level Overview, Market level overview, Core Segments, Financials as available, Strategic Information, Market Rank/Share for key companies, Products and Services, and Recent Developments)}
- 6.4.1 ABB Ltd.
- 6.4.2 Alphasense Ltd.
- 6.4.3 Aeroqual Limited
- 6.4.4 Ion Science Ltd.
- 6.4.5 EcoSensors Inc.
- 6.4.6 SGX Sensortech Ltd.
- 6.4.7 Renesas Electronics Corp.
- 6.4.8 Sensirion AG
- 6.4.9 Amphenol Advanced Sensors
- 6.4.10 Figaro Engineering Inc.
- 6.4.11 Bosch Sensortec GmbH
- 6.4.12 AMS OSRAM AG
- 6.4.13 City Technology (Honeywell Intl.)
- 6.4.14 GfG Europe Ltd.
- 6.4.15 MicroJet Technology Co., Ltd.
- 6.4.16 Riken Keiki Co., Ltd.
- 6.4.17 Dragerwerk AG and Co. KGaA
- 6.4.18 Kaiterra
- 6.4.19 Siemens AG
- 6.4.20 Spec Sensors LLC
- 6.4.21 NevadaNano Inc.
- 6.4.22 Zhengzhou Winsen Electronics Tech. Co., Ltd.
7 MARKET OPPORTUNITIES AND FUTURE OUTLOOK
- 7.1 White-Space and Unmet-Need Assessment