

|
시장보고서
상품코드
2123559
시비 관개 및 화학제 관개 시장 : 시장 점유율 분석, 업계 동향 및 통계, 성장 예측(2026-2031년)Fertigation And Chemigation - Market Share Analysis, Industry Trends & Statistics, Growth Forecasts (2026 - 2031) |
||||||
 Mordor Intelligence
Mordor Intelligence에 의하면, 시비 관개 및 화학제 관개 시장 규모는 2025년 503억 달러로 평가되었고, 2026년에는 526억 8,000만 달러로 추정되고, 2026-2031년 CAGR 4.73%로 성장을 지속할 전망이며, 2031년에는 663억 3,000만 달러에 이를 것으로 예측됩니다.
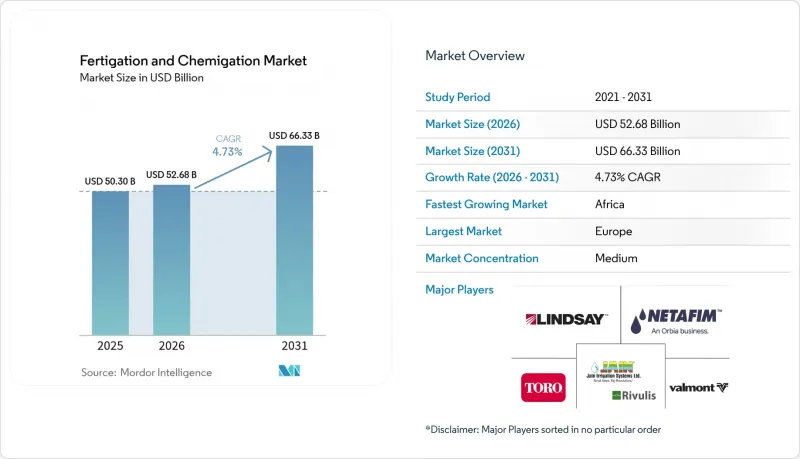
본 보고서는 투입 자재 유형별(비료, 살충제, 기타), 작물 유형별(곡류 및 곡물, 기타), 용도별(노지 농업, 기타), 관개 유형별(점적 관개, 기타), 지역별(북미, 기타)로 분류되어 있습니다. 시장 예측은 금액(달러)으로 표시되어 있습니다.
세계의 시비 관개 및 화학제 관개 시장 동향과 인사이트
식량 안보 및 수확량 극대화에 대한 수요 증가
세계 칼로리 수요는 경작 가능지 공급량보다 빠른 속도로 증가하고 있어, 농업 종사자들은 물, 영양소, 노동력 단위당 생산량을 극대화해야 할 필요에 직면해 있습니다. 식물의 뿌리 주변에 직접 영양분을 공급하는 비료 관개는 질소, 인, 칼륨 공급을 식물의 생육 단계와 동기화함으로써 고부가가치 작물의 수확량을 15-35% 향상시킵니다. 상업용 과수원 및 채소 농장에서는 비료 이용 효율이 최대 30% 향상된 것으로 보고되고 있으며, 이는 투입 자재 가격이 변동하기 쉬운 시기의 비용 절감으로 이어지는 동시에 영양분의 유출도 억제하고 있습니다. 비료 관개를 기후를 고려한 농업 기법과 결합함으로써, 농업 종사자는 정기적인 대량 시비 대신 데이터에 기반한 지속적인 영양 관리 프로그램을 시행할 수 있게 됩니다.
정부의 보조금 및 미세 관개 장려 조치
정부의 시책으로는 보조금, 세액 공제, 이자 지원 대출을 통해 농업 기술 도입을 지원하고 있습니다. 미국 농무부의 2025년도 예산에서는 정밀 물 관리 시스템에 중점을 두어 천연자원보전국에 105억 달러가 배정되었습니다. 인도나 중국의 유사한 프로그램에서는 저압 점적 관개 설비에 대해 최대 55%의 비용 보조가 이루어지고 있어, 중소규모 농업 종사자들의 도입이 촉진되고 있습니다. 이러한 노력은 농업 컨설팅, 센서 제조, 소프트웨어 기반 관개 관리 등 관련 서비스의 개발을 촉진해 왔습니다.
높은 초기 투자 및 운영·유지 관리 비용
고도화된 기능을 갖춘 점적 비료 관개 시스템에는 압력 조절 기능이 있는 메인 라인, 이중 여과, 역류 방지 장치, 프로그래밍 가능한 컨트롤러 등 대규모 인프라가 필요합니다. 이러한 요건으로 인해 초기 비용이 고액으로 책정되어, 많은 소규모 농업 종사자들에게는 감당하기 어려운 수준이 되고 있습니다. 경제 분석에 따르면, 가변 시비율의 시비 관개 시스템의 투자 회수 기간은 범용 작물의 경우 27년 이상 소요되는 반면, 고정 비율의 피벗식 시스템에서는 10년 만에 회수가 가능합니다. 이러한 재정적 장벽은 농지 규모가 작고 대출 접근성이 제한된 저소득 지역에서 특히 큰 과제로 대두되고 있습니다. 시스템 세척, 산 처리, 센서 교정 등을 포함한 지속적인 유지 관리 비용은 추가적인 재정적 부담이 되어, 시스템 업그레이드나 신규 구매를 저해하는 요인이 되고 있습니다.
부문 분석
시비 관개 및 화학제 관개 시장은 비료가 주도하고 있으며, 2025년에는 매출 점유율의 45.42%를 차지했습니다. 이러한 우위는 주로 빠른 용해성과 배관 내 침전을 최소화하는 수용성 NPK 제제 덕분입니다. 주요 제조업체들은 집약적인 원예 재배에서 발생하는 영양 결핍 문제를 해결하기 위해 킬레이트화된 미량 영양소 혼합물 개발을 추진하고 있습니다.
생장촉진제 및 미량영양소는 중요한 성장 요인으로 부상하고 있으며, 2026-2031년 연평균 성장률(CAGR) 9.68%를 나타낼 것으로 전망됩니다. 이러한 성장은 예측 불가능한 기상 조건 속에서도 안정적인 수확량을 추구하는 농업 종사자들에 의해 주도되고 있습니다. 조사에 따르면, 식물 유래 추출물과 미생물 컨소시엄은 기존 비료 시비에 비해 영양소 이용 효율을 30% 향상시키는 것으로 나타났으며, 주요 상추 및 베리류 생산자들은 사업 전반에 걸쳐 이러한 솔루션을 도입하고 있습니다. 저압 점적 관개 시스템을 위해 설계된 새로운 액상 접종제는 에미터 막힘을 유발하지 않으면서 토양과 미생물 간의 상호작용을 촉진합니다.
살충제 및 살균제 시장은 완만한 성장률을 유지하고 있습니다. 이는 비료 관개 시스템을 통해 빽빽하게 자란 작물의 수관 전체에 약제를 균일하게 살포할 수 있어, 효과적인 해충 방제 수준을 유지하면서 화학 약품의 총 사용량을 줄일 수 있기 때문입니다. 제초제 부문은 살포상의 제약으로 인해 규모는 작지만, 글리포세이트 내성 잡초 개체군 관리 분야에서 완만한 성장을 보이고 있습니다.
2025년에는 과일 및 채소가 37.35%라는 최대 시장 점유율을 유지했으며, 이는 비료·관개 시스템이 효과적으로 대응할 수 있는 영양 공급 시기에 대한 높은 요구 사항에 힘입은 것입니다. 점적 관개 시스템은 덩굴성 작물, 딸기, 잎채소에서 15-35%의 수확량 증가를 가져오고 있으며, 특히 토지 비용이 높고 생산성 향상이 요구되는 도시 근교 지역에서 그 효과가 두드러집니다. 곡물 생산자들은 시범 프로그램에서 상업적 도입으로 전환하고 있으며, 옥수수 및 밀 농업 종사자들은 윤작 일정 속에서 저압 시스템을 채택하고 있습니다. 또한, 이 기술은 유지작물이나 콩류에서도 채택이 확대되고 있으며, 특히 물 부족 지역에서는 질소 비료를 분할 시비함으로써 휘발에 의한 영양분 손실을 줄일 수 있다는 점이 높이 평가되고 있습니다.
차, 커피, 카카오, 코코넛, 고무 등의 플랜테이션 작물에서는 독자적인 비료 시비 및 관개 도입 패턴이 나타납니다. 현재 시장 점유율은 작지만, 플랜테이션 작물용 시비 관개 및 화학제 관개 시장은 2026-2031년 연평균 성장률(CAGR) 7.62%를 나타낼 것으로 예측됩니다. 이러한 작물은 생산 주기가 길고 다년생 뿌리계를 가지고 있어, 특히 장기간 지속되는 건기 동안 소량이지만 빈번한 영양분 공급으로부터 큰 혜택을 받고 있습니다. 생산자들로부터는 점적 비료 관개를 도입한 결과, 잎의 성장이 촉진되고 콩의 품질 균일성이 향상되었습니다는 보고가 있습니다. 또한 강수량이 많은 지역에서는 영양분의 유출이 억제됩니다. 플랜테이션 작물의 수명이 긴 점은 초기 설비 투자를 정당화하는 요인이 됩니다. 수익상의 이점이 수년에 걸쳐 누적되기 때문에 투자 수익률(ROI)이 전반적으로 향상되기 때문입니다.
지역별 분석
2025년 현재, 유럽은 시비 관개 및 화학제 관개 시장의 33.62%를 차지했습니다. 올리브, 포도, 온실 채소 생산자들은 EU의 질산염 지침 요건을 충족하면서 수확량의 안정성과 제품 품질을 향상시키기 위해 센서 기반 비료 관개 시스템을 도입하고 있습니다. 공통 농업 정책(CAP)에서는 토양 수분 센서, 자동 여과, 디지털 모니터링 플랫폼을 통합한 첨단 시스템의 도입을 지원하기 위해 정부 보조금과 저리 융자가 제공되고 있어, 인건비 상승에도 불구하고 투자 회수 기간이 단축되고 있습니다. 네덜란드, 스페인, 이탈리아에 걸쳐 있는 대규모 온실 시설이 기술 도입을 주도하고 있으며, 통제된 환경에서는 정밀한 영양분 공급과 pH 관리의 효과가 극대화됩니다. 시장의 성장은 확립된 서비스 네트워크에 의해 뒷받침되고 있습니다. 이 네트워크에서는 농업 자재 공급업체가 기술 기업과 협력하여 설계부터 유지보수에 이르는 종합적인 솔루션 패키지를 제공하고 있으며, 기술 인력을 증원하지 않고도 규제 준수를 요구받는 중규모 농업 협동조합을 대상으로 하고 있습니다.
북미는 디지털 기술의 광범위한 도입과 확립된 기술 지원 네트워크에 힘입어 금액 기준으로 두 번째로 큰 시장 점유율을 차지하고 있습니다. 중서부 지역 농업 종사자들이 비료 가격 변동에 대응하고 있는 것을 배경으로, 해당 지역의 매출액은 2025년 2억 9,658만 달러에서 2031년까지 4억 6,817만 달러로 성장할 것으로 예측됩니다. 조사에 따르면, 옥수수 및 대두 농업 종사자의 78.6%가 비료 효율성을 최우선으로 여기고 있으며, 가변 시비율을 적용한 피벗식 시비 관개 시스템 도입이 진행되고 있습니다. 연방 정부의 환경 보전 자금과 엄격한 유출 규제가 이러한 도입을 뒷받침하고 있습니다.
아프리카는 2026-2031년 연평균 성장률(CAGR) 8.92%를 기록하며 가장 높은 성장 잠재력을 보일 것으로 전망됩니다. 2024년에는 ‘아프리카 비료·토양 건강 정상회의’가 지역 스마트 관개 이니셔티브와 연계하여 개최될 예정이며, 비료 관개를 통한 절수 효과와 영양적 이점이 강조될 전망입니다. 도입 수준에는 큰 편차가 나타나며, 2021년 기준 남아프리카공화국의 벰베 지역에서는 농장의 24%가 기후 적응형 관개를 도입한 반면, 카프리콘 지역에서는 68%가 도입하고 있습니다. 지식 격차를 해소하기 위해 SMS(단문 메시지 서비스)를 활용한 디지털 보급 서비스와 저대역폭 디지털 보급 서비스가 활용되고 있습니다. 또한, 케냐와 탄자니아의 정밀 시비 프로그램은 영양 관리 지침으로서 모바일 애플리케이션에 대한 지역적 관심이 높음을 보여주고 있습니다.
기타 혜택
- 엑셀 형식 시장 예측(ME) 시트
- 3개월간의 애널리스트 지원
자주 묻는 질문
목차
제1장 서론
제2장 조사 방법
제3장 주요 요약
제4장 시장 구도
제5장 시장 규모 및 성장 예측
제6장 경쟁 구도
제7장 시장 기회 및 향후 전망
AJY 26.09.11According to Mordor Intelligence, the fertigation and chemigation market size is expected to grow from USD 50.3 billion in 2025 to USD 52.68 billion in 2026 and is forecast to reach USD 66.33 billion by 2031 at 4.73% CAGR over 2026-2031.
This report is Segmented by Input Type (Fertilizers, Insecticides, and More), by Crop Type (Grains and Cereals, and More), by Application (Open-Field Agriculture, and More), by Irrigation Type (Drip Irrigation, and More), and by Geography (North America and More). The Market Forecasts are Provided in Terms of Value (USD).
Global Fertigation And Chemigation Market Trends and Insights
Rising Demand for Food Security and Yield Maximization
The global demand for calories is increasing faster than the availability of arable land, requiring farmers to maximize output per unit of water, nutrients, and labor. Fertigation, which delivers nutrients directly to plant root zones, increases crop yields by 15-35% in high-value crops by synchronizing nitrogen, phosphorus, and potassium delivery with plant developmental stages. Commercial orchards and vegetable farms report up to 30% improvement in fertilizer use efficiency, reducing costs during periods of volatile input prices while decreasing nutrient run-off. Fertigation, when integrated with climate-smart farming practices, enables farms to implement data-driven, continuous nutrition programs instead of periodic bulk fertilizer applications.
Government Subsidies and Micro-Irrigation Incentives
Government policies support the adoption of agricultural technology through grants, tax credits, and subsidized loans. The United States Department of Agriculture's 2025 budget allocates USD 10.5 billion to the Natural Resources Conservation Service, with a focus on precision water management systems.Similar programs in India and China provide reimbursements of up to 55% for low-pressure drip irrigation equipment, encouraging adoption among small and medium-scale farmers. These initiatives have fostered the development of supporting services, including agronomic consulting, sensor production, and software-based irrigation management.
High Capital and Operational and Maintenance Costs
Drip fertigation systems with advanced features require significant infrastructure, including pressure-regulated mainlines, dual filtration, backflow prevention, and programmable controllers. These requirements increase initial costs beyond what many smallholder farmers can afford. Economic analyses indicate that variable-rate fertigation systems have payback periods of over 27 years for commodity crops, while fixed-rate pivot systems achieve payback in 10 years. The financial barriers are particularly challenging in low-income regions with small farm sizes and limited credit access. The ongoing maintenance costs, including system flushing, acid treatment, and sensor calibration, create additional financial pressure, which reduces system upgrades and new purchases.
Other drivers and restraints analyzed in the detailed report include:
- Rapid Adoption of Water-Soluble Specialty Fertilizers
- Growing Water Scarcity Heightens Efficient Nutrient Delivery
- Less Technical Knowledge Among Farmers
For complete list of drivers and restraints, kindly check the Table Of Contents.
Segment Analysis
The fertigation and chemigation market is dominated by fertilizers, which accounted for 45.42% of revenue share in 2025. This dominance is primarily due to water-soluble NPK formulations that offer rapid dissolution and minimal line precipitation. Major manufacturers are developing chelated micronutrient blends to address nutrient deficiencies in intensive horticultural operations.
Biostimulants and micronutrients are emerging as significant growth drivers, with projections indicating a 9.68% CAGR from 2026-2031. This growth is driven by farmers seeking consistent yields during unpredictable weather conditions. Research indicates that plant-based extracts and microbial consortia improve nutrient-use efficiency by 30% compared to conventional fertilizer applications, leading major lettuce and berry producers to implement these solutions across their operations. New liquid inoculants designed for low-pressure drip systems enhance soil-microbe interactions without emitter blockage.
Insecticides and fungicides maintain moderate growth rates, as fertigation systems enable uniform distribution throughout dense crop canopies, reducing overall chemical usage while maintaining effective pest control levels. The herbicide segment, though smaller due to application limitations, shows gradual growth in managing glyphosate-resistant weed populations.
Fruits and vegetables maintain the largest market share at 37.35% in 2025, driven by their high nutrient timing requirements that fertigation effectively addresses. Drip line fertigation systems demonstrate yield increases of 15-35% in vine crops, strawberries, and leafy greens, particularly in peri-urban areas where high land costs necessitate increased productivity. Cereal and grain producers are transitioning from pilot programs to commercial implementation, with maize and wheat farmers adopting low-pressure systems within crop rotation schedules. The technology also shows increasing adoption in oil crops and pulses, especially in water-scarce regions where split nitrogen applications reduce nutrient loss through volatilization.
Plantation crops, including tea, coffee, cocoa, coconut, and rubber, exhibit unique fertigation adoption patterns. While currently holding a smaller market share, the fertigation and chemigation market for plantation crops is projected to grow at an 7.62% CAGR from 2026-2031. These crops benefit significantly from low-volume, high-frequency nutrient delivery due to their long production cycles and perennial root systems, particularly during extended dry periods. Growers report improved leaf development and bean quality uniformity after implementing drip fertigation, which reduces nutrient leaching in high-rainfall areas. The extended lifespan of plantation crops supports the initial capital investment, as the revenue benefits accumulate over multiple years, improving the overall return on investment.
Complete Report Scope:
- By Input Type
- Fertilizers
- Insecticides
- Fungicides
- Herbicides
- Biostimulants and Micronutrients
- Other Input Types
- By Crop Type
- Cereals and Grains
- Oilseeds and Pulses
- Fruits and Vegetables
- Plantation Crops
- Turf and Ornamentals
- Other Crop Types
- By Application
- Open-Field Agriculture
- Greenhouse and Hydroponics
- Nursery and Landscaping
- Urban Vertical Farming
- Other Applications
- By Irrigation Type
- Drip Irrigation
- Sprinkler Irrigation
- Other Irrigation Types
- By Geography
- North America
- United States
- Canada
- Mexico
- Rest of North America
- Europe
- Germany
- United Kingdom
- France
- Italy
- Spain
- Russia
- Rest of Europe
- Asia-Pacific
- China
- India
- Japan
- Australia
- South Korea
- Rest of Asia-Pacific
- South America
- Brazil
- Argentina
- Rest of South America
- Middle East
- Turkey
- Saudi Arabia
- United Arab Emirates
- Rest of Middle East
- Africa
- South Africa
- Egypt
- Kenya
- Rest of Africa
- North America
Geography Analysis
Europe holds a 33.62% of the fertigation and chemigation market share in 2025. Growers of olives, vineyards, and greenhouse vegetables have implemented sensor-based fertigation systems to meet EU nitrate-directive requirements while improving yield consistency and product quality. The Common Agricultural Policy provides government grants and low-interest loans that support the adoption of advanced systems incorporating soil-moisture sensors, automated filtration, and digital monitoring platforms, reducing return-on-investment periods despite increasing labor costs. The extensive greenhouse facilities in the Netherlands, Spain, and Italy drive technology adoption, as controlled environments maximize the effectiveness of precise nutrient application and pH management. The market growth is supported by an established service network, where agricultural input suppliers collaborate with technology companies to deliver complete solution packages, from design through maintenance, targeting medium-sized farming cooperatives that require regulatory compliance without expanding their technical staff.
North America holds the second-largest market share by value, driven by widespread adoption of digital technology and established technical support networks. Regional revenue is anticipated to grow from USD 296.58 million in 2025 to USD 468.17 million by 2031, driven by Midwestern farmers responding to fertilizer price fluctuations. Research indicates 78.6% of corn and soybean farmers prioritize fertilizer efficiency, increasing the implementation of variable-rate pivot fertigation. Federal conservation funding and strict runoff regulations strengthen the implementation rationale.
Africa is projected to exhibit the highest growth potential, with a 8.92% CAGR from 2026 to 2031. In 2024, the Africa Fertilizer and Soil Health Summit, in conjunction with regional smart-irrigation initiatives, will highlight the water conservation and nutritional benefits of fertigation. Implementation levels vary significantly, with 24% of farms in South Africa's Vhembe district adopting climate-smart irrigation, compared to 68% in the Capricorn district in 2021. Short Message Service (SMS)-based and low-bandwidth digital extension services are being used to bridge knowledge gaps. Additionally, precision-fertilization programs in Kenya and Tanzania highlight regional interest in mobile applications for nutrient management guidance.
- Netafim Limited (An Orbia Business)
- Jain Irrigation Systems Limited (Rivulis Irrigation Ltd.)
- Lindsay Corporation
- Valmont Industries, Inc.
- The Toro Company
- Rain Bird Corporation
- Automat Industries Private Limited
- Mahindra EPC Irrigation Limited
- Hunter Industries Inc.
- Irritec S.p.A
Additional Benefits:
- The market estimate (ME) sheet in Excel format
- 3 months of analyst support
TABLE OF CONTENTS
1 Introduction
- 1.1 Study Assumptions and Market Definition
- 1.2 Scope of the Study
2 Research Methodology
3 Executive Summary
4 Market Landscape
- 4.1 Market Overview
- 4.2 Market Drivers
- 4.2.1 Rising Demand for Food Security and Yield Maximization
- 4.2.2 Government Subsidies and Micro-Irrigation Incentives
- 4.2.3 Growing Water Scarcity Heightens Efficient Nutrient Delivery
- 4.2.4 Rapid Adoption of Water-Soluble Specialty Fertilizers
- 4.2.5 IoT-enabled variable-rate fertigation systems
- 4.2.6 Labor and Cost Efficiency
- 4.3 Market Restraints
- 4.3.1 High Capital and Operational and Maintenance Costs
- 4.3.2 Less Technical Knowledge Among Farmers
- 4.3.3 Emitter Clogging from Precipitates and Biofilms
- 4.3.4 Increasing Regulatory Scrutiny on Nutrient Leaching
- 4.4 Regulatory Landscape
- 4.5 Technological Outlook
- 4.6 Porter's Five Forces Analysis
- 4.6.1 Threat of New Entrants
- 4.6.2 Bargaining Power of Buyers
- 4.6.3 Bargaining Power of Suppliers
- 4.6.4 Threat of Substitute Products
- 4.6.5 Intensity of Competitive Rivalry
5 Market Size and Growth Forecasts (Value)
- 5.1 By Input Type
- 5.1.1 Fertilizers
- 5.1.2 Insecticides
- 5.1.3 Fungicides
- 5.1.4 Herbicides
- 5.1.5 Biostimulants and Micronutrients
- 5.1.6 Other Input Types
- 5.2 By Crop Type
- 5.2.1 Cereals and Grains
- 5.2.2 Oilseeds and Pulses
- 5.2.3 Fruits and Vegetables
- 5.2.4 Plantation Crops
- 5.2.5 Turf and Ornamentals
- 5.2.6 Other Crop Types
- 5.3 By Application
- 5.3.1 Open-Field Agriculture
- 5.3.2 Greenhouse and Hydroponics
- 5.3.3 Nursery and Landscaping
- 5.3.4 Urban Vertical Farming
- 5.3.5 Other Applications
- 5.4 By Irrigation Type
- 5.4.1 Drip Irrigation
- 5.4.2 Sprinkler Irrigation
- 5.4.3 Other Irrigation Types
- 5.5 By Geography
- 5.5.1 North America
- 5.5.1.1 United States
- 5.5.1.2 Canada
- 5.5.1.3 Mexico
- 5.5.1.4 Rest of North America
- 5.5.2 Europe
- 5.5.2.1 Germany
- 5.5.2.2 United Kingdom
- 5.5.2.3 France
- 5.5.2.4 Italy
- 5.5.2.5 Spain
- 5.5.2.6 Russia
- 5.5.2.7 Rest of Europe
- 5.5.3 Asia-Pacific
- 5.5.3.1 China
- 5.5.3.2 India
- 5.5.3.3 Japan
- 5.5.3.4 Australia
- 5.5.3.5 South Korea
- 5.5.3.6 Rest of Asia-Pacific
- 5.5.4 South America
- 5.5.4.1 Brazil
- 5.5.4.2 Argentina
- 5.5.4.3 Rest of South America
- 5.5.5 Middle East
- 5.5.5.1 Turkey
- 5.5.5.2 Saudi Arabia
- 5.5.5.3 United Arab Emirates
- 5.5.5.4 Rest of Middle East
- 5.5.6 Africa
- 5.5.6.1 South Africa
- 5.5.6.2 Egypt
- 5.5.6.3 Kenya
- 5.5.6.4 Rest of Africa
- 5.5.1 North America
6 Competitive Landscape
- 6.1 Market Concentration
- 6.2 Strategic Moves
- 6.3 Market Share Analysis
- 6.4 Company Profiles (Includes Global Level Overview, Market Level Overview, Core Segments, Financials as Available, Strategic Information, Market Rank/Share for Key Companies, Products and Services, and Recent Developments)
- 6.4.1 Netafim Limited (An Orbia Business)
- 6.4.2 Jain Irrigation Systems Limited (Rivulis Irrigation Ltd.)
- 6.4.3 Lindsay Corporation
- 6.4.4 Valmont Industries, Inc.
- 6.4.5 The Toro Company
- 6.4.6 Rain Bird Corporation
- 6.4.7 Automat Industries Private Limited
- 6.4.8 Mahindra EPC Irrigation Limited
- 6.4.9 Hunter Industries Inc.
- 6.4.10 Irritec S.p.A


