

|
시장보고서
상품코드
2123564
이식 진단 시장 : 점유율 분석, 업계 동향과 통계, 성장 예측(2026-2031년)Transplant Diagnostics - Market Share Analysis, Industry Trends & Statistics, Growth Forecasts (2026 - 2031) |
||||||
 Mordor Intelligence
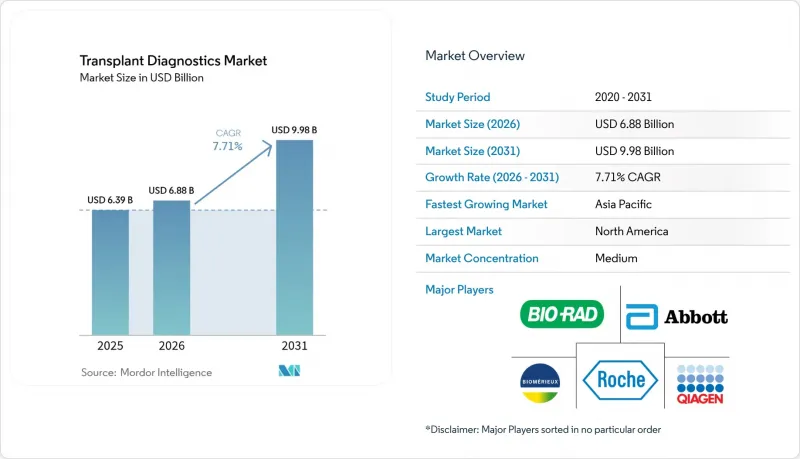
Mordor Intelligence에 의하면, 2026년 이식 진단 시장 규모는 68억 8,000만 달러로 추정되고 있어 2025년 63억 9,000만 달러에서 확대되어, 2031년에는 99억 8,000만 달러에 이를 것으로 예측됩니다.
2026년부터 2031년까지 연평균 성장률(CAGR) 7.71%를 기록하며 성장할 것으로 전망됩니다.
본 보고서는 기술별(분자진단 및 비분자진단), 제품별(장비, 시약 등), 이식 유형별(고형 장기, 줄기세포, 연조직), 용도별(진단 및 연구), 최종 사용자별(독립 검사 기관 등), 지역별(북미, 유럽, 아시아태평양 등)로 분류되어 있습니다. 시장 전망은 금액(달러) 기준으로 제시되어 있습니다.
전 세계 이식 진단 시장 동향 및 인사이트
이식 건수 증가(고형 장기 및 세포 치료)
2024년, 미국 병원에서는 4만 8,000건 이상의 장기 이식이 이루어져 3.3% 증가했습니다. 이는 전 세계적인 증가 추세를 반영한 것입니다. 현재, 순환 정지 후 장기 기증을 통한 이식은 사망 기증자 이식 수술의 36%를 차지하며, 이식을 받을 수 있는 환자층을 확대되고 있습니다. 조혈모세포 이식에서 나타나는 이와 유사한 성장세는 부분적으로 부적합한 기증자의 적격성을 확인하는 고해상도 HLA 유형 분석과 관련이 있으며, 특히 인종적으로 다양한 환자들에게 혜택을 주고 있습니다. 폐 기증이 지속적으로 이루어짐에 따라 이식률은 12개월 만에 이미 16% 상승했습니다. 수술 건수 증가는 적합성 검사, 수술 후 모니터링, 그리고 장기적인 거부 반응 감시에 대한 수요 증가로 이어집니다. 그 결과, 이식 진단 시장에서는 시약 판매가 지속적으로 증가하고, 이미 도입된 시스템의 가동률도 향상되고 있습니다.
NGS 기반 HLA 및 dd-cfDNA 모니터링으로의 전환
NGS 플랫폼은 검체에 바코드를 부여하여 여러 HLA 유전자좌에 대한 고해상도 타이핑을 동시에 수행할 수 있어 처리량을 향상시키는 동시에 대립유전자당 비용을 절감합니다. dd-cfDNA 분석법은 조직 검사보다 조기에 이식편 손상을 감지할 수 있게 되었으며, 심장 이식 환자의 경우 신호치 상승에 대한 위험비는 2.56으로 나타났습니다. 전국의 보험사들은 생검에 따른 합병증 감소로 인해 후단 공정에서 비용이 절감된다는 점을 점점 더 인식하고 있으며, 이에 따라 보험 적용 승인이 가속화되고 있습니다. 검사 기관은 시퀀서, 소프트웨어, 소모품을 묶어 검체당 예측 가능한 요금 체계를 적용하는 시약 임대 계약을 통해 유연성을 확보하고 있으며, 이로 인해 중규모 의료 기관에서의 NGS 도입이 더욱 확대되고 있습니다.
높은 검사 비용과 설비 투자
종합적인 NGS 시스템은 검증 전 50만 달러를 초과할 수 있는 반면, 고품질 시약은 시료당 400달러에 달할 수도 있습니다(arup.com). FDA의 실험실 개발 검사(LDT) 감독으로 인해 10년 동안 약 12억 9,000만 미달러에 달하는 규정 준수 관련 비용이 발생합니다. 처리 능력이 제한된 검사 기관은 이러한 비용을 상각하는 데 어려움을 겪고 있으며, 그 결과 처리 능력이 높은 핵심 센터로의 통합이 진행되고 있습니다. 또한, 비용 압박의 영향은 dd-cfDNA 분석법에도 미치고 있으며, 지불 기관 측의 요금 체계가 분석의 복잡성을 따라가지 못하고 있어 저소득 지역에서의 광범위한 도입이 지연되고 있습니다.
부문별 분석
분자 검사는 타의 추종을 불허하는 대립 유전자 분해능과 다중 분석 능력 덕분에 2025년 이식 진단 시장의 68.92% 점유율을 차지했습니다. 2031년까지 이 부문의 연평균 성장률(CAGR) 7.63%는 추출, 라이브러리 준비, 시퀀싱을 통합된 플랫폼으로 집약하여 수작업 시간을 단축하는 실험실 자동화의 혜택을 받고 있습니다. 유세포 분석법을 이용한 교차 적합성 검사 등 보완적인 비분자 검사는 긴급 사망 기증자 배정에서 여전히 필수적이며, 특수한 이용 사례에서 연평균 성장률(CAGR) 12.02%로 성장하고 있습니다.
플랫폼 기능 강화로 NGS 리드와 AI 기반 보완 분석이 통합되어 모호한 대립유전자의 정합이 이루어짐에 따라, 시퀀싱이 불충분한 영역에서의 콜 정확도가 향상되고 있습니다. 동일한 시퀀서에서 사용되는 dd-cfDNA 키트는 환자 1인당 시약 소비량을 증가시켜, 분자 워크플로우 내 이식 진단 시장 규모를 확대되고 있습니다. 19년에 걸친 벤치마크를 포괄하는 외부 능력 평가 프로그램에서 유전자형 일치율이 꾸준히 상승하고 있어, 기술의 성숙도가 입증되고 있습니다.
2025년에도 시약 및 소모품은 매출의 64.93%를 차지하며 여전히 수익의 주축을 이루고 있습니다. 이는 NGS 실행 시마다 바코드가 부착된 프라이머, 폴리메라제, 캡처 프로브가 소모되기 때문입니다. 한편, 소프트웨어 및 분석 분야는 연평균 성장률(CAGR) 13.58%를 나타낼 것으로 예측되며, 알고리즘을 통한 품질 관리(QC), 페이싱, 임상 보고서 작성의 자동화에 따라 디지털 서비스 분야의 이식 진단 시장 규모가 확대될 전망입니다.
클라우드 네이티브 플랫폼은 On-Premise 인프라의 필요성을 줄이고, 전 세계에서 제출되는 알레르 정보마다 업데이트되는 실시간 변이 데이터베이스를 지원합니다. 장비는 사용량 기반의 임대 방식으로 전환되고 있으며, 이로 인해 자본 지출(CAPEX)이 운영 예산으로 전환되면서 하드웨어의 성장이 둔화되고 있습니다. 벤더들은 AI 라이선스를 시약 키트에 번들로 제공하고, 모든 분석 주기에 데이터 구독을 통합함으로써 지속적인 수익을 확보하고 있습니다.
지역별 분석
북미는 종합적인 메디케어 정책, 4만 8,000건의 이식 수술, 그리고 dd-cfDNA 모니터링을 일상적으로 도입하고 있는 밀집된 의료 센터 네트워크 덕분에 2025년에 전 세계 매출의 42.42%를 차지했습니다. AI 분석 장치의 광범위한 도입과 조기 보험 적용 결정으로 인해 단가는 한 자릿수 중반대의 프리미엄이 유지되고 있습니다. FDA의 LDT(실험실 개발 검사) 규제는 소규모 시설에 타격을 줄 가능성이 있으며, 규모의 경제를 활용할 수 있는 전국적인 참조 검사 기관으로의 아웃소싱을 촉진하게 될 것입니다.
유럽은 통일된 품질 관리 체계를 갖춘 성숙한 인프라를 보유하고 있지만, GDPR(EU 개인정보보호규정)로 인해 희귀 대립 유전자 데이터 교환이 제한되고 있어 다기관 공동 연구 설계가 복잡해지고, 바이오마커 검증은 지연되고 있습니다. 의료기술평가기관은 대부분의 경우 장기적인 임상 결과 데이터 제출을 요구하기 때문에 공급업체의 투자 회수 기간이 장기화되고 있습니다. 그럼에도 불구하고 인구 고령화와 고형 장기 이식 대기자 수 증가로 인해 검사 건수는 안정적으로 유지되고 있습니다.
아시아태평양은 연평균 성장률(CAGR) 11.36%로 가장 빠른 성장세를 기록하고 있습니다. 이는 일본이 유전자 편집을 통한 이종 이식 준비를 선도하고 있으며, 인도가 1년 생존율 85-90%라는 기준을 달성하여 이식 역량을 확대하고 있기 때문입니다. 각국 정부는 수입 의존도를 줄이기 위해 국내 바이오프린팅 및 차세대 염기서열 분석(NGS) 제조에 투자하고 있으며, 이로 인해 시약의 가용성이 높아지고 있습니다. 대규모 인구에 걸친 다양한 HLA 프로파일은 고해상도 유전자형 판정에 대한 수요를 더욱 높여 이식 진단 시장을 확대시키고 있습니다.
기타 혜택:
- 엑셀 형식 시장 예측(ME) 시트
- 3개월간의 애널리스트 지원
자주 묻는 질문
목차
제1장 서론
제2장 조사 방법
제3장 주요 요약
제4장 시장 구도
제5장 시장 규모와 성장 예측
제6장 경쟁 구도
제7장 시장 기회와 향후 전망
JHS 26.09.07According to Mordor Intelligence, transplant diagnostics market size in 2026 is estimated at USD 6.88 billion, growing from 2025 value of USD 6.39 billion with 2031 projections showing USD 9.98 billion, growing at 7.71% CAGR over 2026-2031.
This report is Segmented by Technology (Molecular and Non-Molecular), Product (Instrument, Reagents, and More), Transplant Type (Solid Organ, Stem Cell, and Soft Tissue), Application (Diagnostic and Research), End User (Independent Reference Laboratories, and More), and Geography (North America, Europe, Asia-Pacific, and More). The Market Forecasts are Provided in Terms of Value (USD).
Global Transplant Diagnostics Market Trends and Insights
Growing Transplant Volumes (Solid Organ & Cell Therapy)
US hospitals performed 48,000-plus organ transplants in 2024, a 3.3% rise that mirrors broader global gains. Donation-after-circulatory-death grafts now contribute 36% of deceased-donor procedures, expanding the recipient pool. Parallel momentum in hematopoietic stem-cell transplants is linked to high-resolution HLA typing that validates partially mismatched donors, especially benefitting ethnically diverse patients. Continuous distribution for lungs has already lifted transplant rates 16% within 12 months. Each increment in procedure volume converts into higher demand for compatibility assays, post-operative monitoring, and longitudinal rejection surveillance. Consequently, the transplant diagnostics market records sustained reagent pull-through and greater installed-base utilization.
Shift to NGS-Based HLA & dd-cfDNA Surveillance
NGS platforms provide simultaneous high-resolution typing of multiple HLA loci via sample barcoding, boosting throughput while cutting cost per allele. dd-cfDNA assays now flag graft injury earlier than histology, with hazard ratios of 2.56 for elevated signals in heart recipients. National payers increasingly recognize the downstream savings from fewer biopsy complications, accelerating reimbursement approvals. Laboratories gain flexibility through reagent-rental contracts that bundle sequencers, software, and consumables into predictable per-sample fees, propelling wider NGS adoption across mid-tier centers.
High Assay Costs & Capital Outlay
Comprehensive NGS systems can exceed USD 500,000 before validation, while premium reagents reach USD 400 per sample aruplab.com. FDA oversight of Laboratory-Developed Tests adds compliance expenditures near USD 1.29 billion over 10 years. Laboratories with limited throughput struggle to amortize these expenses, prompting consolidation toward high-volume reference centers. Cost pressure also affects dd-cfDNA assays where payer fee schedules lag analytical complexity, delaying widespread roll-out in low-income settings.
Other drivers and restraints analyzed in the detailed report include:
- AI-Assisted Histocompatibility Matching
- Reagent-Rental & Pay-Per-Use Pricing
- Patchwork Global Reimbursement
For complete list of drivers and restraints, kindly check the Table Of Contents.
Segment Analysis
Molecular assays captured 68.92% of transplant diagnostics market share in 2025 owing to unrivaled allelic resolution and multiplex capacity. The segment's 7.63% CAGR through 2031 benefits from lab automation that consolidates extraction, library prep, and sequencing on unified decks, shortening hands-on time. Complementary non-molecular tests such as flow-cytometric crossmatch remain indispensable for urgent deceased-donor allocation, growing 12.02% CAGR on specialized use cases.
Platform enhancements now merge NGS reads with AI-based imputation to reconcile ambiguous alleles, raising call confidence in under-sequenced regions. dd-cfDNA kits layered on the same sequencers raise reagent consumption per patient episode, lifting the transplant diagnostics market size for molecular workflows. External proficiency programs covering 19 years of benchmarking show genotype concordance steadily increasing, underscoring technology maturity.
Reagents and consumables remained the revenue anchor with 64.93% share in 2025 because every NGS run consumes barcoded primers, polymerases, and capture probes. Yet software and analytics is expected to post 13.58% CAGR, expanding the transplant diagnostics market size for digital services as algorithms automate QC, phasing, and clinical reporting.
Cloud-native platforms reduce on-premise infrastructure needs and support real-time variant databases that update with each global allele submission. Instruments shift toward usage-based leases, reallocating capex to operating budgets and dampening hardware growth. Vendors bundle AI licenses with reagent kits, embedding data subscriptions into every assay cycle to capture recurring revenue.
Complete Report Scope:
- By Technology
- Molecular
- PCR-based Molecular Assays
- Sequencing-based Molecular Assays
- Non-Molecular
- Molecular
- By Product
- Instruments
- Reagents & Consumables
- Software / Analytics
- By Transplant Type
- Solid Organ
- Stem Cell / Bone Marrow
- Soft Tissue
- By Application
- Diagnostic
- Research
- By End User
- Independent Reference Laboratories
- Hospital & Transplant Centres
- Academic & Research Institutes
- Geography
- North America
- United States
- Canada
- Mexico
- Europe
- Germany
- United Kingdom
- France
- Italy
- Spain
- Rest of Europe
- Asia-Pacific
- China
- Japan
- India
- South Korea
- Australia
- Rest of Asia-Pacific
- Middle East and Africa
- GCC
- South Africa
- Rest of Middle East and Africa
- South America
- Brazil
- Argentina
- Rest of South America
- North America
Geography Analysis
North America held 42.42% of global revenue in 2025 due to comprehensive Medicare policies, 48,000 transplant procedures, and dense center networks that routinely deploy dd-cfDNA monitoring. Widespread adoption of AI analyzers and early reimbursement decisions support mid-single-digit unit price premiums. FDA regulation of LDTs may pinch smaller facilities, provoking outsourcing to national reference laboratories that command scale efficiencies.
Europe presents mature infrastructure with harmonized quality schemes; however, GDPR limits rare-allele data exchange, complicating multicenter study design and slowing biomarker validation. Health-technology-assessment bodies often request extended clinical outcome data, extending payback periods for vendors. Nonetheless, population aging and rising solid-organ waitlists sustain steady test volumes.
Asia-Pacific registers the fastest expansion at 11.36% CAGR as Japan pioneers gene-edited xenograft readiness and India scales transplant capacity with 85-90% one-year survival benchmarks. Governments invest in local bioprinting and NGS manufacturing to mitigate import dependence, amplifying reagent accessibility. Diverse HLA profiles across large populations further elevate demand for high-resolution genotyping, expanding the transplant diagnostics market.
- Abbott Laboratories
- Becton, Dickinson & Co
- bioMerieux
- Bio-Rad Laboratories
- CareDx Inc.
- Roche
- Hologic
- Illumina
- QIAGEN
- Thermo Fisher Scientific
- Immucor
- Omixon
- GenDx (GenCell)
- BioGenuix
- Oxford Nanopore Technologies
- Eurofins
- Natera
- BGI
- Eurofins Transplant Genomics
- Genetron Health
- Pacific Biosciences
Additional Benefits:
- The market estimate (ME) sheet in Excel format
- 3 months of analyst support
TABLE OF CONTENTS
1 Introduction
- 1.1 Study Assumptions & Market Definition
- 1.2 Scope of the Study
2 Research Methodology
3 Executive Summary
4 Market Landscape
- 4.1 Market Overview
- 4.2 Market Drivers
- 4.2.1 Growing Transplant Volumes (Solid-Organ & Cell Therapy)
- 4.2.2 Shift To NGS-Based HLA & Ccfdna Surveillance
- 4.2.3 Reagent Rental + Pay-Per-Use Pricing By Vendors
- 4.2.4 AI-Assisted Histocompatibility Matching
- 4.2.5 3-D Printed Micro-Organs As Reference Controls
- 4.3 Market Restraints
- 4.3.1 High Assay Costs & Capital Outlay
- 4.3.2 Patchwork Global Reimbursement
- 4.3.3 Data-Privacy Hurdles In Cross-Border Registries
- 4.4 Porter's Five Forces
- 4.4.1 Threat of New Entrants
- 4.4.2 Bargaining Power of Buyers
- 4.4.3 Bargaining Power of Suppliers
- 4.4.4 Threat of Substitutes
- 4.4.5 Intensity of Competitive Rivalry
5 Market Size & Growth Forecasts (Value, USD)
- 5.1 By Technology
- 5.1.1 Molecular
- 5.1.1.1 PCR-based Molecular Assays
- 5.1.1.2 Sequencing-based Molecular Assays
- 5.1.2 Non-Molecular
- 5.1.1 Molecular
- 5.2 By Product
- 5.2.1 Instruments
- 5.2.2 Reagents & Consumables
- 5.2.3 Software / Analytics
- 5.3 By Transplant Type
- 5.3.1 Solid Organ
- 5.3.2 Stem Cell / Bone Marrow
- 5.3.3 Soft Tissue
- 5.4 By Application
- 5.4.1 Diagnostic
- 5.4.2 Research
- 5.5 By End User
- 5.5.1 Independent Reference Laboratories
- 5.5.2 Hospital & Transplant Centres
- 5.5.3 Academic & Research Institutes
- 5.6 Geography
- 5.6.1 North America
- 5.6.1.1 United States
- 5.6.1.2 Canada
- 5.6.1.3 Mexico
- 5.6.2 Europe
- 5.6.2.1 Germany
- 5.6.2.2 United Kingdom
- 5.6.2.3 France
- 5.6.2.4 Italy
- 5.6.2.5 Spain
- 5.6.2.6 Rest of Europe
- 5.6.3 Asia-Pacific
- 5.6.3.1 China
- 5.6.3.2 Japan
- 5.6.3.3 India
- 5.6.3.4 South Korea
- 5.6.3.5 Australia
- 5.6.3.6 Rest of Asia-Pacific
- 5.6.4 Middle East and Africa
- 5.6.4.1 GCC
- 5.6.4.2 South Africa
- 5.6.4.3 Rest of Middle East and Africa
- 5.6.5 South America
- 5.6.5.1 Brazil
- 5.6.5.2 Argentina
- 5.6.5.3 Rest of South America
- 5.6.1 North America
6 Competitive Landscape
- 6.1 Market Concentration
- 6.2 Market Share Analysis
- 6.3 Company Profiles (includes Global level Overview, Market level overview, Core Segments, Financials as available, Strategic Information, Market Rank/Share for key companies, Products & Services, and Recent Developments)
- 6.3.1 Abbott Laboratories
- 6.3.2 Becton, Dickinson & Co
- 6.3.3 bioMerieux SA
- 6.3.4 Bio-Rad Laboratories Inc.
- 6.3.5 CareDx Inc.
- 6.3.6 F. Hoffmann-La Roche AG
- 6.3.7 Hologic Inc.
- 6.3.8 Illumina Inc.
- 6.3.9 Qiagen NV
- 6.3.10 Thermo Fisher Scientific Inc.
- 6.3.11 Immucor Inc.
- 6.3.12 Omixon Ltd.
- 6.3.13 GenDx (GenCell)
- 6.3.14 BioGenuix
- 6.3.15 Oxford Nanopore Technologies
- 6.3.16 Eurofins Scientific
- 6.3.17 Natera Inc.
- 6.3.18 BGI Genomics
- 6.3.19 Eurofins Transplant Genomics
- 6.3.20 Genetron Health
- 6.3.21 Pacific Biosciences
7 Market Opportunities & Future Outlook
- 7.1 White-space & Unmet-need Assessment


