|
시장보고서
상품코드
2123594
유황 비료 시장 : 점유율 분석, 업계 동향과 통계, 성장 예측(2026-2031년)Sulfur Fertilizer - Market Share Analysis, Industry Trends & Statistics, Growth Forecasts (2026 - 2031) |
||||||
 Mordor Intelligence
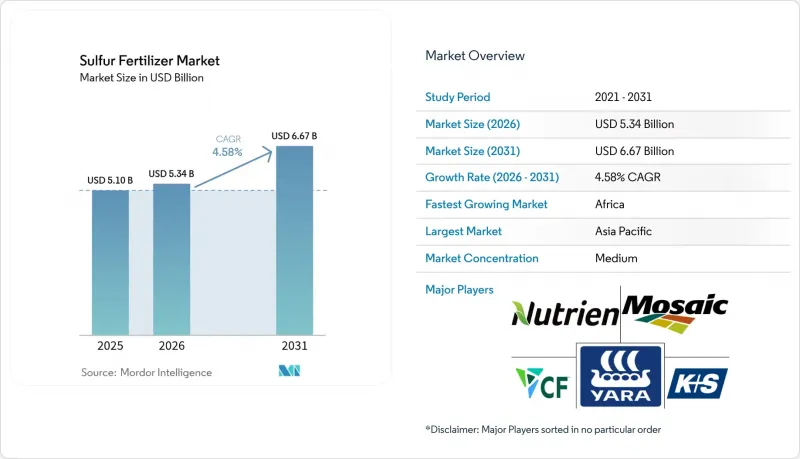
Mordor Intelligence에 의하면, 2026년 유황 비료 시장 규모는 53억 4,000만 달러로 추정되고 있어 2025년 51억 달러에서 확대되어, 2031년에는 66억 7,000만 달러에 이를 것으로 예측됩니다.
2026년부터 2031년까지 연평균 성장률(CAGR) 4.58%로 성장할 것으로 전망됩니다.
본 보고서는 유형(황산염 비료, 원소 유황 등), 형태(고체 및 액체), 시비 방법(토양 시비, 시비 관개 등), 작물 유형(곡물, 유지종자 및 콩류 등),유통 채널(농가 직접 판매, 소매 등), 지역(북미, 유럽 등)별로 분류되어 있습니다. 시장 전망은 금액(달러) 기준으로 제시되어 있습니다.
세계 유황 비료 시장 동향 및 인사이트
토양 내 황 결핍
토양 검사 결과에 따르면, 대기질 규제로 인해 황산염 에어로졸이 제거된 결과, 지난 30년 동안 토양 내 황 농도가 30-50% 감소했으며, 황은 질소, 인, 칼륨에 이어 수확량을 제한하는 네 번째로 중요한 영양소가 되었습니다. 헥타르당 30-45kg의 유황을 시비한 작물의 경우, 밀 수확량이 15-25% 증가할 뿐만 아니라 곡물의 단백질 함량도 높아집니다. 유기물이 적은 집약적 경작 지역이 가장 큰 영향을 받으며, 현재는 밭별 검사 키트를 통해 농가가 작기 시작 전에 유황 결핍 분포도를 작성할 수 있게 되었습니다. 이 기능은 잠재적인 영양소 부족을 측정 가능한 수요로 전환하기 때문에 유황 비료 시장의 주요 원동력이 되고 있습니다. 상업용 옥수수 농장의 수확량 모니터링 결과, 잎의 유황 농도가 0.2% 미만으로 떨어지면 해당 지역의 수확량이 최대 18% 감소하는 것으로 기록되어, 대규모 농장에 있어 경제적 중요성이 부각되고 있습니다. 기후 패턴의 변화로 강우 분포가 변함에 따라, 침출에 의한 손실로 잔류 유황이 더욱 감소하므로 매년 보충하는 것이 사실상 필수적입니다.
유지작물의 재배 면적 및 수확량 증가
카놀라나 대두와 같은 유지종자는 곡물에 비해 질소 단위당 필요한 유황량이 2-3배 더 많기 때문에 전 세계 재배 면적의 확대에 따라 비료 수요가 더욱 증가하고 있습니다. 미주리주 한 대학의 포장 시험에 따르면, 황산암모늄 100파운드를 시비함으로써 대두 수확량이 1에이커당 8.1부셸 증가했으며, 투입 비용을 차감한 후에도 1에이커당 80달러의 이익 증가로 이어졌습니다고 보고되었습니다. 이러한 경제적 이점으로 인해 성숙한 시장에서도 도입이 지속되고 있으며, 유황 비료의 판매량이 안정적으로 확대되는 데 기여하고 있습니다. 전 세계 카놀라 재배 면적은 2030년까지 180만 헥타르 확대될 것으로 예측되어, 캐나다와 호주에서의 고유황 배합 비료 수요를 더욱 높이고 있습니다. 또한, 단백질 함량 상한이 높은 생명공학 품종도 더 많은 유황을 필요로 하기 때문에 종자의 유전적 특성이 비료 전략과 직접적으로 연결되어 있습니다.
다영양소 특수 비료와의 경쟁
농가에서는 한 번의 시비로 여러 영양소 결핍을 해결할 수 있는 복합비료에 대한 수요가 증가하고 있어, 이로 인해 황 단독에 대한 수요가 감소할 가능성이 있습니다. 공급업체들은 유황을 보다 광범위한 영양소 패키지에 포함시켜 대응하고 있지만, 가격 경쟁과 배합의 복잡성이 소규모 생산자들에게 진입 장벽으로 작용하고 있습니다. 대형 유통업체들은 추가 비용을 절감하면서도 유황을 포함한 미량 영양소 팩을 자유롭게 조합한 세트 상품을 판매하고 있어, 이로 인해 순수 유황의 판매가 잠식되고 있습니다. 경쟁력을 유지하기 위해 유황 비료 공급업체들은 턴키 방식의 작물 영양 프로그램을 제공하는 공동 마케팅 제휴를 모색하고 있습니다. 이러한 변화로 인해 유황 단독 제품의 이익률이 압박을 받게 되어, 소규모 사업자 간의 통합이 진행될 가능성이 있습니다.
부문 분석
2025년에는 황산암모늄, 황산칼륨, 단일 과인산석회 등의 황산염계 비료가 전 세계 매출의 50.45%를 차지했습니다. 이는 식물에 대한 즉효성과 배합 용이성을 반영한 결과입니다. 원소 유황은 규모는 작지만 연평균 성장률(CAGR) 6.39%로 더 빠르게 성장하고 있습니다. 이는 높은 분석 값이 운송 비용을 절감하고, 제어된 산화 특성이 정밀 시비 프로그램에 적합하기 때문입니다. 미분화 및 펠릿화 같은 기술 혁신으로 인해 산화 지연 시간이 단축되어, 생육 기간이 짧은 작물에 대한 적용 범위가 확대되고 있습니다. 분할 시비 전략에서는 초기 성장 단계에는 황산염을, 지속적인 방출을 위해서는 원소 유황을 조합함으로써, 유황 비료 시장 수요가 제로섬이 아니라 상호 보완적임을 강조하고 있습니다.
원소 유황의 동향은 가변 시비율 비료 살포기 및 원격 감지 지도의 보급을 뒷받침하고 있습니다. 이는 영양분 농도를 높여 밭을 오가는 횟수를 줄이는 것을 목적으로 합니다. 유황 코팅 요소나 유황 벤토나이트가 주류 혼합물에 포함되는 가운데, 균일한 입자 크기와 예측 가능한 산화를 보장할 수 있는 제조업체가 시장 점유율을 확대될 전망입니다.
고체 제품은 효율적인 보관과 광대한 농지에서 기존 살포기와의 호환성을 바탕으로 2025년에도 69.25%의 시장 점유율을 유지했습니다. 처리 능력과 저장 기간이 중요한 협동조합의 혼합 공장에서는 과립형 및 프리울 형태가 주류를 이루고 있습니다. 한편, 고부가가치 원예 분야의 시비 관개 및 엽면 살포 프로그램의 보급을 배경으로, 액체 유황은 연평균 성장률(CAGR) 6.95%로 시장을 확대되고 있습니다.
암모늄 티오설페이트(12-0-0-26S)는 액체 제품의 성장세를 상징하는 제품으로, 질소 용액이나 농약과 탱크 내에서 혼합이 가능해 한 번의 살포 작업으로 효율적으로 시비할 수 있습니다. 생산자들 사이에서는 미세 관개 시의 균일성은 물론, 중요한 생식 단계에서 식물이 이를 빠르게 흡수한다는 점이 높이 평가받고 있습니다. 각 공급업체들은 운송 거리를 단축하기 위해 지역 터미널을 건설하고 있으며, 이로 인해 고체 제품과의 배송 비용 격차가 줄어들고, 유황 비료 시장 전체에서 대상 경작 면적이 확대될 것으로 전망됩니다.
지역별 분석
2025년, 아시아태평양은 36.55%의 점유율로 유황 비료 시장을 주도했습니다. 중국의 비료 사용량은 여전히 세계 평균을 상회하고 있으며, 과잉 질소를 억제하기 위한 노력이 수확량을 유지하면서 손실을 줄이는 균형 잡힌 NPK-S 시비법의 채택을 뒷받침하고 있습니다. 인도에서는 정밀 살포기로의 전환과 토양 건강 카드에 대한 주 정부의 보조금 지원으로 인해 유황 비료가 표준적인 재배 관행으로 더욱 정착되고 있습니다. 동남아시아 국가들에서는 팜유 농장 및 벼 이모작을 통해 수요가 증가하는 반면, 일본 등 선진국에서는 고부가가치 농산물을 위해 염화물 함량이 극히 낮은 제품이 요구되고 있습니다. 2031년까지 연평균 성장률(CAGR) 5.35%를 나타낼 것으로 예측되는 이 지역의 성장은 기후 스마트 농업 목표에 부합하는 정책에 힘입은 것입니다.
아프리카는 연평균 성장률(CAGR) 6.15%로 가장 빠르게 성장하는 지역입니다. 토양 조사에 따르면 사하라 사막 이남의 많은 지역에서 유황이 부족하며, 각국 정부는 현재 비료 보조금과 균형 잡힌 영양 섭취를 촉진하는 농업 보급 서비스를 병행하고 있습니다. GERD(지라-에티오피아-루웬 댐) 완공 후 건설 중인 에티오피아의 국내 복합 시설은 수입 의존도를 낮출 것입니다. 한편, 남아프리카의 상업 농장에서는 이미 알칼리성 토양 관리에 원소 유황 혼합물을 활용하고 있습니다. 유통상의 과제는 여전히 남아 있지만, 기부자가 지원하는 회랑 프로젝트와 민간 혼합 거점이 라스트 마일 접근성 개선을 목표로 하고 있어, 유황 비료 시장 전망을 밝게 하고 있습니다.
북미에서는 미국이 정유시설에서 회수된 유황 820만 메트르톤을 매년 인산염 및 황산암모늄 생산에 활용하고 있어 연평균 성장률(CAGR)이 3.94%로 견조한 추세를 보이고 있습니다. 캐나다산 유황에 대한 최근 관세 조치로 인해 단기적인 공급 부족이 발생하고 있지만, 풍부한 국내 가스 자원과 정유시설 네트워크가 공급의 기반이 되고 있습니다. 정밀 농업, 피복 작물의 도입, 그리고 지속가능성 인증이 수요의 점진적인 증가를 뒷받침하고 있습니다. 유럽은 연평균 성장률(CAGR) 3.07%를 기록하며, 엄격한 수질 규제와 작물의 단백질 함량 유지 필요성 사이에서 균형을 맞추고 있어 서서히 방출되는 유황 제품이 주목받고 있습니다.
기타 혜택:
- 엑셀 형식 시장 예측(ME) 시트
- 3개월간의 애널리스트 지원
자주 묻는 질문
목차
제1장 서론
제2장 조사 방법
제3장 주요 요약
제4장 시장 구도
제5장 시장 규모와 성장 예측
제6장 경쟁 구도
제7장 시장 기회와 향후 전망
JHS 26.09.07According to Mordor Intelligence, sulfur fertilizers market size in 2026 is estimated at USD 5.34 billion, growing from 2025 value of USD 5.1 billion with 2031 projections showing USD 6.67 billion, growing at 4.58% CAGR over 2026-2031.

This report is Segmented by Type (Sulfate Fertilizer, Elemental Sulfur, and More), Form (Solid and Liquid), Mode of Application (Soil Application, Fertigation, and More), Crop Type (Cereals and Grains, Oilseeds and Pulses, and More), Distribution Channel (Direct-To-Farm, Retail, and More) and Geography (North America, Europe, and More). The Market Forecasts are Provided in Terms of Value (USD).
Global Sulfur Fertilizer Market Trends and Insights
Sulfur Deficiency in Soil
Soil tests indicate sulfur levels have fallen 30-50% during the past three decades as air-quality rules removed sulfate aerosols, making sulfur the fourth most yield-limiting nutrient after nitrogen, phosphorus, and potassium. Crops that receive 30-45 kilograms of sulfur per hectare show wheat yield gains of 15-25% together with higher grain protein. Intensively cropped regions with low organic matter are the most vulnerable, and site-specific test kits now allow farmers to map deficiencies before the season begins. This capability is a primary engine for the sulfur fertilizers market because it converts latent nutrient shortages into measurable demand. Yield monitors on commercial corn farms now record site yield drops of up to 18% when leaf sulfur falls below 0.2%, underscoring the economic stakes for large operations. As climate patterns shift rainfall distribution, leaching losses further lower residual sulfur, making annual supplementation a practical necessity.
Rising Oilseed Acreage and Yields
Oilseed crops such as canola and soybean require two to three times more sulfur per unit of nitrogen than cereals, which intensifies fertilizer demand as the global planted area expands. University field trials in Missouri report 8.1 bushel-per-acre soybean gains from 100 pounds of ammonium sulfate, yielding a USD 80 per-acre profit lift after input costs. The economics encourage continued adoption even in mature markets, reinforcing a stable pull-through on sulfur volumes. Global canola acreage is projected to expand by 1.8 million hectares by 2030, amplifying demand for high-sulfur blends in Canada and Australia. Biotech cultivars with higher protein ceilings also pull more sulfur, linking seed genetics directly to fertilizer strategy.
Competition from Multi-Nutrient Specialty Fertilizers
Farmers increasingly favor single-pass blends that address multiple deficiencies, which can dilute standalone demand for sulfur. Suppliers are responding by embedding sulfur into broader nutrient packages, but pricing competition and formulation complexity raise barriers for smaller producers. Large distributors bundle mix and match micronutrient packs that include sulfur at lower incremental cost, eroding standalone sales. To stay relevant, sulfur fertilizer suppliers are exploring co-marketing alliances that offer turnkey crop nutrition programs. Such shifts could compress standalone sulfur margins and push consolidation among smaller players.
Other drivers and restraints analyzed in the detailed report include:
- Government Incentives for Sustainable Agriculture
- Adoption of Controlled-Release Sulfur-Coated Urea
- Volatility in Elemental Sulfur Prices
For complete list of drivers and restraints, kindly check the Table Of Contents.
Segment Analysis
In 2025, sulfate fertilizers such as ammonium sulfate, potassium sulfate, and single superphosphate delivered 50.45% of global revenue, reflecting their immediate plant availability and ease of blending. Elemental sulfur, though smaller, is growing faster at a 6.39% CAGR as its higher analysis lowers freight costs and its controlled oxidation fits precision programs. Micronized and pastilled innovations shorten oxidation lag, extending applicability to short-season crops. Split-application strategies combine sulfate for early growth and elemental sulfur for sustained release, underscoring complementary rather than zero-sum demand within the sulfur fertilizers market.
The elemental trend plays into the wider adoption of variable-rate applicators and remote-sensing maps, which rely on higher nutrient density to limit field passes. As sulfur-coated urea and sulfur-bentonite enter mainstream blends, producers that can guarantee uniform particle size and predictable oxidation stand to gain share.
Solid products retained a 69.25% share in 2025, backed by efficient storage and compatibility with conventional spreaders across broad acres. Granulated and prilled formats dominate cooperative blending plants where throughput and shelf life matter. Yet liquid sulfur is advancing at a 6.95% CAGR on the strength of fertigation and foliar programs in high-value horticulture.
Ammonium thiosulfate (12-0-0-26S) typifies liquid momentum, allowing tank mixing with nitrogen solutions and pesticides for single-pass efficiency. Growers appreciate the uniformity in micro-irrigation as well as quicker plant uptake during critical reproductive stages. Vendors are building regional terminals to shorten hauls, which should reduce delivered cost gaps versus solids and widen addressable acreage across the sulfur fertilizers market.
Complete Report Scope:
- By Type
- Sulfate Fertilizers
- Ammonium Sulfate
- Potassium Sulfate
- Calcium Sulfate (Gypsum)
- Single Superphosphate
- Elemental Sulfur
- Micronized Sulfur
- Prilled/Pastilled Sulfur
- Sulfate of Micronutrients
- Zinc Sulfate
- Magnesium Sulfate
- Others
- Others (Sulfur-coated Urea, Sulfur Bentonite)
- Sulfate Fertilizers
- By Form
- Solid
- Liquid
- By Mode of Application
- Soil Application
- Fertigation
- Foliar Spray
- Controlled-Release/Coated Granules
- By Crop Type
- Cereals and Grains
- Oilseeds and Pulses
- Fruits and Vegetables
- Turf and Ornamentals
- Others
- By Distribution Channel
- Direct-to-Farm
- Retail Dealers
- Cooperatives
- Online Platforms
- By Geography
- North America
- United States
- Canada
- Mexico
- Rest of North America
- Europe
- Germany
- United Kingdom
- France
- Russia
- Spain
- Rest of Europe
- Asia-Pacific
- China
- Japan
- India
- South Korea
- Rest of Asia-Pacific
- South America
- Brazil
- Argentina
- Rest of South America
- Middle East
- Saudi Arabia
- United Arab Emirates
- Rest of Middle East
- Africa
- South Africa
- Egypt
- Rest of Africa
- North America
Geography Analysis
Asia-Pacific led the sulfur fertilizers market with a 36.55% share in 2025. China's fertilizer intensity remains above global norms, and efforts to curb excess nitrogen spur the adop-tion of balanced NPK-S regimens that sustain yields while reducing losses. India's shift toward precision spreaders and state subsidies for soil health cards pushes sulfur deeper into standard practice. Southeast Asian nations are raising demand through palm oil estates and double-cropped rice, whereas developed economies such as Japan seek ultra-low chloride options for high-value produce. Regional growth of 5.35% CAGR through 2031 is anchored by policy alignment with climate-smart agriculture goals.
Africa is the fastest-growing region at 6.15% CAGR. Soil surveys indicate sulfur scarcity in many sub-Saharan zones, and governments now couple fertilizer subsidies with extension services that promote balanced nutrition. Ethiopia's domestic complex under construction post-GERD will cut import reliance, while South Africa's commercial farms already leverage elemental sulfur blends to manage alkaline soils. Distribution challenges persist, yet donor-backed corridor projects and private blending hubs aim to improve last-mile reach, brightening prospects for the sulfur fertilizers market.
North America posts a steady 3.94% CAGR as the United States channels 8.2 million metric tons of recovered sulfur each year from refineries into phosphate and ammonium sulfate production. Recent tariffs on Canadian sulfur inject short-term tightness, but abundant domestic gas and refinery networks anchor supply. Precision agronomy, cover-crop adoption, and sustainability certifications fuel incremental demand. Europe, at 3.07% CAGR, balances stringent water-quality directives with the need to uphold crop protein levels, making controlled-release sulfur variants attractive.
- Nutrien Ltd.
- Yara International ASA
- The Mosaic Company
- K+S AG
- Israel Chemicals Ltd.
- Haifa Chemicals Ltd.
- Nufarm Limited
- Koch Industries Inc.
- CF Industries Holdings Inc.
- OCP S.A.
- BASF SE
- Sinochem Holdings Corp. Ltd.
- Saudi Arabian Fertilizer Company (SAFCO) (Saudi Basic Industries Corporation (SABIC))
- Tiger-Sul Products LLC (Tessenderlo Group)
- TogliattiAzot PJSC (Uralchem Group)
Additional Benefits:
- The market estimate (ME) sheet in Excel format
- 3 months of analyst support
TABLE OF CONTENTS
1 Introduction
- 1.1 Study Assumptions and Market Definition
- 1.2 Scope of the Study
2 Research Methodology
3 Executive Summary
4 Market Landscape
- 4.1 Market Overview
- 4.2 Market Drivers
- 4.2.1 Sulfur deficiency in soil
- 4.2.2 Rising oilseed acreage and yields
- 4.2.3 Government incentives for sustainable agriculture
- 4.2.4 Adoption of controlled-release sulfur-coated urea
- 4.2.5 Increasing availability of recovered sulfur from desulfurization units
- 4.2.6 AI-based precision nutrient application platforms
- 4.3 Market Restraints
- 4.3.1 Competition from multi-nutrient specialty fertilizers
- 4.3.2 Volatility in elemental sulfur feedstock prices
- 4.3.3 Environmental risk of sulfate leaching into groundwater
- 4.3.4 Distribution bottlenecks for prilled elemental sulfur in emerging markets
- 4.4 Regulatory Landscape
- 4.5 Technological Outlook
- 4.6 Porter's Five Forces Analysis
- 4.6.1 Threat of New Entrants
- 4.6.2 Bargaining Power of Buyers
- 4.6.3 Bargaining Power of Suppliers
- 4.6.4 Threat of Substitute Products
- 4.6.5 Intensity of Competitive Rivalry
5 Market Size and Growth Forecasts (Value, USD)
- 5.1 By Type
- 5.1.1 Sulfate Fertilizers
- 5.1.1.1 Ammonium Sulfate
- 5.1.1.2 Potassium Sulfate
- 5.1.1.3 Calcium Sulfate (Gypsum)
- 5.1.1.4 Single Superphosphate
- 5.1.2 Elemental Sulfur
- 5.1.2.1 Micronized Sulfur
- 5.1.2.2 Prilled/Pastilled Sulfur
- 5.1.3 Sulfate of Micronutrients
- 5.1.3.1 Zinc Sulfate
- 5.1.3.2 Magnesium Sulfate
- 5.1.3.3 Others
- 5.1.4 Others (Sulfur-coated Urea, Sulfur Bentonite)
- 5.1.1 Sulfate Fertilizers
- 5.2 By Form
- 5.2.1 Solid
- 5.2.2 Liquid
- 5.3 By Mode of Application
- 5.3.1 Soil Application
- 5.3.2 Fertigation
- 5.3.3 Foliar Spray
- 5.3.4 Controlled-Release/Coated Granules
- 5.4 By Crop Type
- 5.4.1 Cereals and Grains
- 5.4.2 Oilseeds and Pulses
- 5.4.3 Fruits and Vegetables
- 5.4.4 Turf and Ornamentals
- 5.4.5 Others
- 5.5 By Distribution Channel
- 5.5.1 Direct-to-Farm
- 5.5.2 Retail Dealers
- 5.5.3 Cooperatives
- 5.5.4 Online Platforms
- 5.6 By Geography
- 5.6.1 North America
- 5.6.1.1 United States
- 5.6.1.2 Canada
- 5.6.1.3 Mexico
- 5.6.1.4 Rest of North America
- 5.6.2 Europe
- 5.6.2.1 Germany
- 5.6.2.2 United Kingdom
- 5.6.2.3 France
- 5.6.2.4 Russia
- 5.6.2.5 Spain
- 5.6.2.6 Rest of Europe
- 5.6.3 Asia-Pacific
- 5.6.3.1 China
- 5.6.3.2 Japan
- 5.6.3.3 India
- 5.6.3.4 South Korea
- 5.6.3.5 Rest of Asia-Pacific
- 5.6.4 South America
- 5.6.4.1 Brazil
- 5.6.4.2 Argentina
- 5.6.4.3 Rest of South America
- 5.6.5 Middle East
- 5.6.5.1 Saudi Arabia
- 5.6.5.2 United Arab Emirates
- 5.6.5.3 Rest of Middle East
- 5.6.6 Africa
- 5.6.6.1 South Africa
- 5.6.6.2 Egypt
- 5.6.6.3 Rest of Africa
- 5.6.1 North America
6 Competitive Landscape
- 6.1 Market Concentration
- 6.2 Strategic Moves
- 6.3 Market Share Analysis
- 6.4 Company Profiles (includes Global level Overview, Market level overview, Core Segments, Financials as available, Strategic Information, Market Rank/Share for key companies, Products and Services, and Recent Developments)
- 6.4.1 Nutrien Ltd.
- 6.4.2 Yara International ASA
- 6.4.3 The Mosaic Company
- 6.4.4 K+S AG
- 6.4.5 Israel Chemicals Ltd.
- 6.4.6 Haifa Chemicals Ltd.
- 6.4.7 Nufarm Limited
- 6.4.8 Koch Industries Inc.
- 6.4.9 CF Industries Holdings Inc.
- 6.4.10 OCP S.A.
- 6.4.11 BASF SE
- 6.4.12 Sinochem Holdings Corp. Ltd.
- 6.4.13 Saudi Arabian Fertilizer Company (SAFCO) (Saudi Basic Industries Corporation (SABIC))
- 6.4.14 Tiger-Sul Products LLC (Tessenderlo Group)
- 6.4.15 TogliattiAzot PJSC (Uralchem Group)