

|
시장보고서
상품코드
2123638
모델 기반 기업 시장 : 시장 점유율 분석, 업계 동향 및 통계, 성장 예측(2026-2031년)Model-based Enterprise - Market Share Analysis, Industry Trends & Statistics, Growth Forecasts (2026 - 2031) |
||||||
 Mordor Intelligence
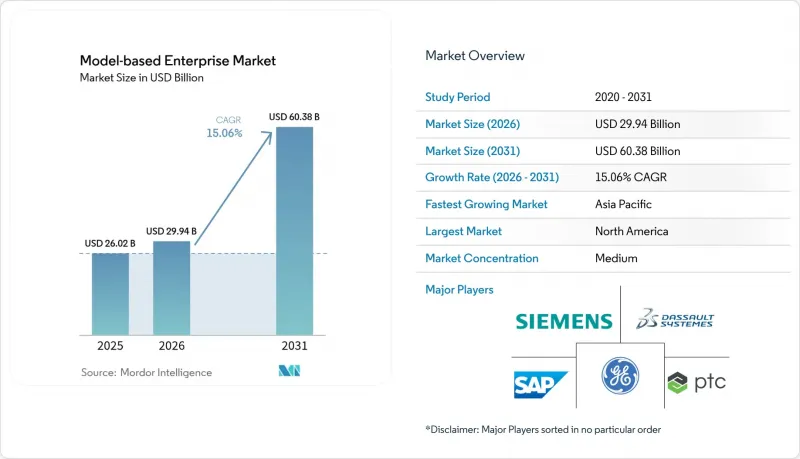
Mordor Intelligence에 의하면, 모델 기반 기업 시장 규모는 2025년 260억 2,000만 달러로 평가되었고, 2026년에는 299억 4,000만 달러로 추정되고, 2026-2031년 CAGR 15.06%로 성장을 지속할 전망이며, 2031년에는 603억 8,000만 달러에 이를 것으로 예측됩니다.
본 보고서는 제공 서비스별(솔루션 및 서비스), 솔루션 유형별(PLM 소프트웨어, CAD/CAM/CAE, 기타), 서비스 유형별(통합·도입, 컨설팅·교육, 기타), 도입 형태별(온프레미스 및 클라우드), 최종 사용자 산업별(항공우주 및 방위, 건설 및 인프라, 기타), 지역별로 분류되어 있습니다. 시장 예측은 금액(달러) 기준으로 제시되어 있습니다.
세계의 모델 기반 기업 시장 동향 및 인사이트
미국 국방부(DoD)의 디지털 엔지니어링 의무화로 북미 도입 가속화
방위 관련 계약업체들은 현재 설계, 분석, 조달, 유지 관리에 관한 의사 결정에서 3D 모델을 유일한 신뢰할 수 있는 정보원으로 취급해야 합니다. 약 30만 개공급업체가 향후 계약 자격을 유지하기 위해 프로세스, 소프트웨어 스택, 사이버 보안 대책의 업데이트에 착수하고 있습니다. 이러한 움직임은 하청업체들이 지침을 준수하는 워크플로우에 적응함에 따라 민간 항공우주 부문으로도 파급되고 있습니다. 각 도구 공급업체들은 문서 작성 시간을 단축하고 추적성을 향상시키는 규정 준수 대응용 패키지 템플릿 및 자동화된 모델 기반 정의(MBD) 검사 도구를 제공함으로써 이러한 움직임에 대응하고 있습니다.
자동차 OEM 각사의 EV 플랫폼에서 풀 3D 디지털 스레드로의 전환
배터리 전기자동차(BEV) 프로그램에서는 기계, 전기, 열 시스템의 병렬 설계가 필수적입니다. 통합된 3D 디지털 스레드의 도입을 통해 주요 자동차 제조업체들은 플랫폼 개발 주기를 72개월에서 36개월로 단축하는 동시에 추적성을 향상시킬 수 있었습니다. 디지털 트윈과 모델 기반 시스템 엔지니어링(MBSE)의 통합을 통해 팀은 에너지 흐름, 충돌 시 거동, 배터리 열화를 조기에 시뮬레이션할 수 있게 되어, 개발 후기 단계에서의 재설계 및 보증 리스크를 억제하고 있습니다. 이러한 이점으로 인해 유럽, 북미, 중국에서 광범위한 도입이 진행되고 있습니다.
데이터 상호운용성 문제가 원활한 통합을 저해하고 있습니다.
엔지니어링 프로젝트의 약 65%에서는 과거 CAD 파일을 기능이 풍부한 MBD 호환 모델로 변환하는 과정에서 여전히 지연이 발생하고 있습니다. 단순한 형식 변환만으로는 불충분하며, 팀은 수십 년에 걸쳐 구축된 피처, 제약 조건, 연결된 도면도 유지해야 합니다. 전용 변환 도구는 점차 개선되고 있지만, 기업 전체 차원의 전환에는 여전히 막대한 자원이 필요하며 데이터 유출 위험도 수반하기 때문에 디지털 스레드 추진이 정체될 우려가 있습니다.
부문 분석
‘솔루션’ 부문은 2025년 매출의 70.35%를 차지했으며, 대부분의 도입 사례에서 핵심적인 역할을 하고 있음을 강조합니다. 그러나 기업들이 모델 기반 관행을 대규모로 전개하는 데 따른 복잡성에 직면함에 따라, 서비스 계약은 연평균 성장률(CAGR) 17.46%로 성장을 지속하고, 있습니다. 각 서비스 제공업체는 데이터 마이그레이션 및 검증을 자동화하기 위해 AI를 도입하고 있으며, 이를 통해 가치 실현까지의 시간을 단축하고 모델 정확도에 대한 신뢰도를 높이고 있습니다. 디지털 스레드 기술에 초점을 맞춘 교육 및 인증 프로그램에 대한 수요가 증가하면서, 인력 부족이 여전히 지속되고 있음이 부각되고 있습니다. 전문 서비스 기업의 진입으로 인해, 대규모 컨설팅 팀을 고용하는 비용을 들이지 않고도 지도를 받을 수 있는 중견 제조업체를 위한 선택지가 넓어지고 있습니다.
구독 모델의 부상으로 수익원은 영구 라이선스형 소프트웨어에서 성과 지표나 성과 연동형 계약에 연계된 지속적인 서비스 관계로 전환되고 있습니다. 유지보수 지원 계약에 적용되는 예측 분석을 통해 생산에 차질이 발생하기 전에 통합상의 결함을 감지할 수 있습니다. 이러한 기능은 고객이 신뢰할 수 있는 파트너에 대한 의존도를 높여, 모델 기반 기업(MBE) 시장 내 서비스 부문의 점유율 상승 추세를 뒷받침하고 있습니다.
제품 수명 주기 관리(PLM) 플랫폼은 여전히 대부분의 도입 사례의 기반이 되고 있지만, 조직이 설계와 운영 간의 폐쇄형 피드백을 추구함에 따라 디지털 트윈 및 시뮬레이션 부문이 주목을 받고 있습니다. 고정밀 모델에 실시간 센서 데이터가 공급됨으로써 자체 업데이트형 디지털 트윈이 생성되어 유지보수의 지침이 되고, 성능을 최적화하며 자산의 수명을 연장합니다. 시뮬레이션과 시스템 엔지니어링의 융합을 통해 요구 사항을 조기에 검증함으로써 재작업을 줄일 수 있습니다. 이러한 이점은 항공우주 및 의료기기 등 규제가 엄격한 분야에서 특히 두드러집니다.
시각화 및 협업 도구에는 AR/VR 오버레이 기능이 추가되어 몰입형 설계 검토가 용이해졌습니다. 엔지니어, 공급업체, 나아가 현장 기술자까지 동일한 모델을 실시간으로 확인할 수 있으므로 의사 결정까지 걸리는 시간이 단축됩니다. CAD/CAM/CAE 제품군에서는 제품 제조 정보가 3D 지오메트리에 직접 내장되게 되었습니다. 이를 통해 검사 계획이나 현장 계측 플랫폼을 포함한 하류 소프트웨어가 단일 데이터 세트를 활용할 수 있게 되어, 변환 절차가 줄어들고 수정으로 인한 오류를 최소화할 수 있습니다.
지역별 분석
북미는 국방 지출, 성숙한 항공우주 공급망, 전기차 출시를 가속화하려는 자동차 제조업체들의 지원에 힘입어 2025년 매출의 37.62%를 차지했습니다. 디지털 모델을 공식적인 기술 표준으로 의무화하는 연방 정부의 정책으로 인해, 보수적인 계약업체들조차도 현대화를 추진하게 되었습니다. 캐나다와 멕시코는 규정 준수 증명이 요구되는 통합 공급망을 통해 참여하고 있으며, 이는 북미 대륙 전체에 걸친 광범위한 도입을 촉진하고 있습니다.
아시아태평양은 2026-2031년 연평균 성장률(CAGR) 18.34%를 기록하며 가장 빠르게 성장하는 지역입니다. 클라우드 기반 PLM은 일본의 정밀 기기 제조업체, 한국의 대형 전자 기업, 인도의 엔지니어링 서비스 제공업체에게 진입 장벽을 낮추고 있습니다. 중국의 디지털 공장 투자는 광대한 생산 네트워크 전반에 걸쳐 확장 가능한 디지털 스레드 솔루션에 대한 수요를 뒷받침하고 있습니다. 지방 자치 단체는 스마트 제조에 대한 보조금을 추진하며 중소기업 시장 진입을 가속화하고 있습니다.
유럽에서는 독일의 ‘인더스트리 4.0’ 이니셔티브와 프랑스의 첨단 항공우주 프로그램이 주도하며 견조한 도입이 진행되고 있습니다. 벨파스트에 위치한 영국의 디지털 트윈 센터는 차세대 항공기 개발 분야에서 경쟁력을 유지하겠다는 국가의 의지를 보여주고 있습니다. 지속가능성에 관한 규제로 인해 탄소 발자국 추적 및 자원 활용 최적화를 도모하는 모델 중심 설계가 더욱 촉진되고 있습니다. 지역 표준화 기구들은 상호 운용성 프레임워크에 대해 협력하고 있어 국경을 초월한 협력을 원활하게 하고 있습니다.
기타 혜택
- 엑셀 형식 시장 예측(ME) 시트
- 3개월간의 애널리스트 지원
자주 묻는 질문
목차
제1장 서론
제2장 조사 방법
제3장 주요 요약
제4장 시장 구도
제5장 시장 규모 및 성장 예측
제6장 경쟁 구도
제7장 시장 기회 및 향후 전망
AJY 26.09.11According to Mordor Intelligence, the model-based enterprise market size is expected to grow from USD 26.02 billion in 2025 to USD 29.94 billion in 2026 and is forecast to reach USD 60.38 billion by 2031 at 15.06% CAGR over 2026-2031.
This report is Segmented by Offering (Solutions, and Services), Solution Type (PLM Software, CAD/CAM/CAE, and More), Service Type (Integration and Implementation, Consulting and Training, and More), Deployment Mode (On-Premise, and Cloud), End User Industry (Aerospace and Defense, Construction and Infrastructure, and More), and Geography. The Market Forecasts are Provided in Terms of Value (USD).
Global Model-based Enterprise Market Trends and Insights
DoD Digital Engineering Mandates Accelerating Adoption in North America
Defense contractors must now treat 3D models as the single source of truth for design, analysis, sourcing, and sustainment decisions. Close to 300,000 suppliers have started updating processes, software stacks, and cybersecurity safeguards to stay eligible for future contracts. Uptake is spilling over to commercial aerospace as shared subcontractors align with mandate-compliant workflows. Tool vendors are responding with packaged compliance templates and automated model-based definition (MBD) checkers that cut documentation time and enhance traceability.
Automotive OEM Shift to Full-3D Digital Thread for EV Platforms
Battery-electric programs rely on concurrent design of mechanical, electrical, and thermal systems. Deploying a unified 3D digital thread has allowed leading automakers to shrink platform cycles from 72 months to 36 months while improving traceability. The integration of digital twins with model-based systems engineering lets teams simulate energy flow, crash behavior, and battery degradation early, curbing late redesigns and warranty risk. These gains drive widespread rollouts across Europe, North America, and China.
Data-Interoperability Challenges Hinder Seamless Integration
Roughly 65% of engineering projects still encounter delays when transforming historical CAD files into feature-rich, MBD-ready models. Geometry translation alone is not enough; teams must also preserve features, constraints, and linked drawings built over decades. Specialized conversion tools are improving, yet enterprise-wide migrations remain resource intensive and carry risk of data loss that can stall digital-thread initiatives.
Other drivers and restraints analyzed in the detailed report include:
- Surge in Cloud-Native PLM Suites Enabling SMB Access in Asia-Pacific
- ROI From Aerospace MRO Turn-Around-Time Reduction
- Workforce Reskilling Creates Implementation Hurdle
For complete list of drivers and restraints, kindly check the Table Of Contents.
Segment Analysis
The Solutions segment generated 70.35% of 2025 revenue, underscoring its role as the backbone of most deployments. Service engagements, however, are registering a 17.46% CAGR as enterprises confront the complexity of rolling out model-based practices at scale. Service providers are embedding AI to automate data migration and validation, shortening time-to-value and boosting confidence in model accuracy. Training and certification packages focused on digital-thread skills are rising in demand, highlighting the persistent talent gap. The influx of specialized service firms is broadening options for mid-market manufacturers seeking guidance without the expense of large consulting teams.
Rising subscription models are shifting revenue from perpetual software toward continuous service relationships tied to performance metrics and outcome-based contracts. Predictive analytics applied within maintenance and support agreements can flag integration glitches before they disrupt production. These capabilities reinforce client reliance on trusted partners, sustaining the upward trajectory of the Services share within the model-based enterprise market.
Product-lifecycle-management platforms remain the foundation of most implementations, but the Digital-Twin & Simulation segment is gaining prominence as organizations seek closed-loop feedback between design and operation. Real-time sensor data feeding high-fidelity models creates self-updating digital twins that guide maintenance, optimize performance, and extend asset life. The convergence of simulation and systems engineering reduces rework by validating requirements early, a benefit that is especially acute in regulated domains such as aerospace and medical devices.
Visualization and collaboration tools are adding AR/VR overlays to facilitate immersive design reviews. Engineers, suppliers, and even field technicians can inspect the same model in real time, shrinking the decision window. CAD/CAM/CAE suites now embed product-manufacturing information directly in 3D geometry. This allows downstream software, including inspection planning and shop-floor metrology platforms, to consume a single data set, trimming translation steps and minimizing revision errors.
Complete Report Scope:
- By Offering
- Solutions
- Services
- By Solution Type
- PLM Software
- CAD/CAM/CAE
- Digital-Twin and Simulation
- Visualization and Collaboration
- By Service Type
- Integration and Implementation
- Consulting and Training
- Support and Maintenance
- By Deployment Mode
- On-premise
- Cloud
- Public Cloud
- Private Cloud
- Hybrid Cloud
- By End User Industry
- Aerospace and Defense
- Automotive
- Construction and Infrastructure
- Power and Energy
- Retail and CPG
- Electronics and Hi-Tech
- Marine and Offshore
- Other Industries
- By Geography
- North America
- United States
- Canada
- Mexico
- South America
- Brazil
- Argentina
- Chile
- Peru
- Rest of South America
- Europe
- Germany
- United Kingdom
- France
- Italy
- Spain
- Rest of Europe
- Asia-Pacific
- China
- Japan
- South Korea
- India
- Australia
- New Zealand
- Rest of Asia-Pacific
- Middle East
- United Arab Emirates
- Saudi Arabia
- Turkey
- Rest of Middle East
- Africa
- South Africa
- Rest of Africa
- North America
Geography Analysis
North America contributed 37.62% of 2025 revenue, supported by defense spending, a mature aerospace supply chain, and automakers seeking to accelerate electric-vehicle launches. Federal policies that enforce digital models as the official technical baseline are nudging even conservative contractors to modernize. Canada and Mexico participate through integrated supply chains that must also prove compliance, driving widespread adoption across the continent.
Asia-Pacific is the fastest-growing region with an 18.34% CAGR over 2026-2031. Cloud-hosted PLM lowers entry barriers for Japan's precision manufacturers, South Korea's electronics champions, and India's engineering-services providers. China's investment in digital factories fuels demand for digital-thread solutions that can scale across vast production networks. Local governments promote smart-manufacturing grants, accelerating SMB participation.
Europe maintains robust adoption driven by Germany's Industrie 4.0 initiatives and France's advanced aerospace programs. A United Kingdom digital-twin center in Belfast demonstrates national commitment to remain competitive in next-generation aircraft development. Sustainability regulations further encourage model-centric design to track carbon footprints and optimize resource use. Regional standards bodies collaborate on interoperability frameworks, smoothing cross-border collaboration.
- Siemens AG
- Dassault Systemes SE
- PTC Inc.
- SAP SE
- Ansys, Inc.
- Autodesk Inc.
- IBM Corporation
- Oracle Corporation
- HCL Technologies Limited
- Aras Corporation
- Anark Corporation
- Hexagon AB
- Altair Engineering Inc.
- Ansys Inc.
- Rockwell Automation Inc.
- IFS AB
- Bentley Systems Inc.
- Capgemini SE
Additional Benefits:
- The market estimate (ME) sheet in Excel format
- 3 months of analyst support
TABLE OF CONTENTS
1 Introduction
- 1.1 Study Assumptions and Market Definition
- 1.2 Scope of the Study
2 Research Methodology
3 Executive Summary
4 Market Landscape
- 4.1 Market Overview
- 4.2 Market Drivers
- 4.2.1 DoD Digital Engineering Mandates Accelerating Adoption in North America
- 4.2.2 Automotive OEM Shift to Full-3D Digital Thread for EV Platforms
- 4.2.3 Surge in Cloud-Native PLM Suites Enabling SMB Access in Asia-Pacific
- 4.2.4 ROI From Aerospace MRO Turn-Around Time Reduction
- 4.2.5 Integrating Model-Based Definition with Additive-Manufacturing Quality Workflows
- 4.3 Market Restraints
- 4.3.1 Data-Interoperability Gaps Between Legacy CAD and Next-Gen MBD Standards
- 4.3.2 High Up-Front Workforce Reskilling Costs
- 4.3.3 Cyber-security Concerns Over IP in Cloud Deployments
- 4.4 Regulatory Outlook
- 4.5 Technological Outlook
- 4.6 Porter's Five Forces Analysis
- 4.6.1 Threat of New Entrants
- 4.6.2 Bargaining Power of Buyers/Consumers
- 4.6.3 Bargaining Power of Suppliers
- 4.6.4 Threat of Substitute Products
- 4.6.5 Intensity of Competitive Rivalry
- 4.7 Macroeconomic Impact Analysis
5 Market Size and Growth Forecasts (Value)
- 5.1 By Offering
- 5.1.1 Solutions
- 5.1.2 Services
- 5.2 By Solution Type
- 5.2.1 PLM Software
- 5.2.2 CAD/CAM/CAE
- 5.2.3 Digital-Twin and Simulation
- 5.2.4 Visualization and Collaboration
- 5.3 By Service Type
- 5.3.1 Integration and Implementation
- 5.3.2 Consulting and Training
- 5.3.3 Support and Maintenance
- 5.4 By Deployment Mode
- 5.4.1 On-premise
- 5.4.2 Cloud
- 5.4.2.1 Public Cloud
- 5.4.2.2 Private Cloud
- 5.4.2.3 Hybrid Cloud
- 5.5 By End User Industry
- 5.5.1 Aerospace and Defense
- 5.5.2 Automotive
- 5.5.3 Construction and Infrastructure
- 5.5.4 Power and Energy
- 5.5.5 Retail and CPG
- 5.5.6 Electronics and Hi-Tech
- 5.5.7 Marine and Offshore
- 5.5.8 Other Industries
- 5.6 By Geography
- 5.6.1 North America
- 5.6.1.1 United States
- 5.6.1.2 Canada
- 5.6.1.3 Mexico
- 5.6.2 South America
- 5.6.2.1 Brazil
- 5.6.2.2 Argentina
- 5.6.2.3 Chile
- 5.6.2.4 Peru
- 5.6.2.5 Rest of South America
- 5.6.3 Europe
- 5.6.3.1 Germany
- 5.6.3.2 United Kingdom
- 5.6.3.3 France
- 5.6.3.4 Italy
- 5.6.3.5 Spain
- 5.6.3.6 Rest of Europe
- 5.6.4 Asia-Pacific
- 5.6.4.1 China
- 5.6.4.2 Japan
- 5.6.4.3 South Korea
- 5.6.4.4 India
- 5.6.4.5 Australia
- 5.6.4.6 New Zealand
- 5.6.4.7 Rest of Asia-Pacific
- 5.6.5 Middle East
- 5.6.5.1 United Arab Emirates
- 5.6.5.2 Saudi Arabia
- 5.6.5.3 Turkey
- 5.6.5.4 Rest of Middle East
- 5.6.6 Africa
- 5.6.6.1 South Africa
- 5.6.6.2 Rest of Africa
- 5.6.1 North America
6 Competitive Landscape
- 6.1 Strategic Developments
- 6.2 Vendor Positioning Analysis
- 6.3 Company Profiles (includes Global level Overview, Market level overview, Core Segments, Financials as available, Strategic Information, Products and Services, and Recent Developments)
- 6.3.1 Siemens AG
- 6.3.2 Dassault Systemes SE
- 6.3.3 PTC Inc.
- 6.3.4 SAP SE
- 6.3.5 Ansys, Inc.
- 6.3.6 Autodesk Inc.
- 6.3.7 IBM Corporation
- 6.3.8 Oracle Corporation
- 6.3.9 HCL Technologies Limited
- 6.3.10 Aras Corporation
- 6.3.11 Anark Corporation
- 6.3.12 Hexagon AB
- 6.3.13 Altair Engineering Inc.
- 6.3.14 Ansys Inc.
- 6.3.15 Rockwell Automation Inc.
- 6.3.16 IFS AB
- 6.3.17 Bentley Systems Inc.
- 6.3.18 Capgemini SE
7 Market Opportunities and Future Outlook
- 7.1 White-space and Unmet-Need Assessment


