|
시장보고서
상품코드
2123692
의료용 영상 워크스테이션 시장 : 시장 점유율 분석, 업계 동향 및 통계, 성장 예측(2026-2031년)Medical Imaging Workstations - Market Share Analysis, Industry Trends & Statistics, Growth Forecasts (2026 - 2031) |
||||||
 Mordor Intelligence
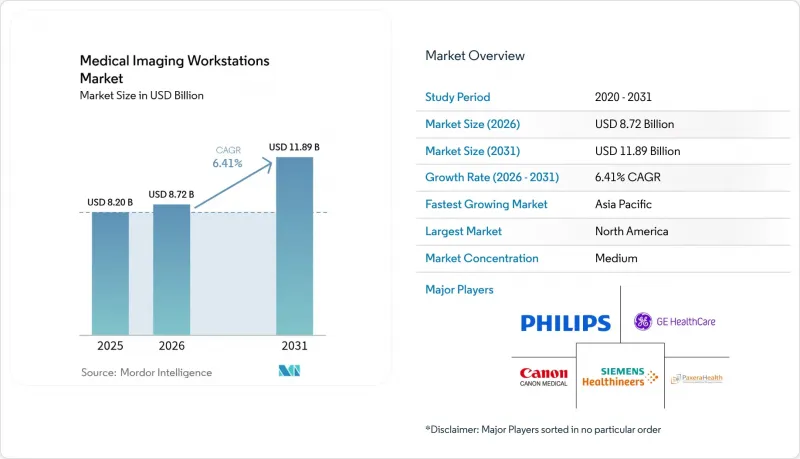
Mordor Intelligence에 의하면, 의료용 영상 워크스테이션 시장 규모는 2025년에 82억 달러로 평가되었고, 2026년 87억 2,000만 달러에서 2031년까지 118억 9,000만 달러에 이를 것으로 예측되며, 예측 기간(2026-2031년) CAGR은 6.41%를 나타낼 전망입니다.
본 보고서는 구성 요소별(시각화 소프트웨어, 디스플레이 장치, 기타), 모달리티별(컴퓨터 단층촬영(CT), 자기공명영상(MRI), 기타), 이용 형태별(시크 클라이언트 워크스테이션, 씬 클라이언트/웹 스트리밍 워크스테이션), 최종 사용자별(병원, 기타), 지역별(북미, 유럽, 기타)로 분류되어 있습니다. 시장 예측은 금액(달러) 기준으로 제시되어 있습니다.
세계의 의료용 영상 워크스테이션 시장 동향 및 인사이트
영상 모달리티 분야의 급속한 기술 발전
광자 계수 CT, 전신 MRI 스크리닝, 콘빔 유방 CT, 자율형 초음파 진단 장치가 결합되어 워크스테이션의 교체 주기마다 요구되는 계산 능력의 상한선을 높이고 있습니다. 광자 계수 스캐너는 방사선 피폭을 최대 80%까지 줄이는 반면, 원시 데이터의 양을 4배로 증가시키기 때문에 실시간 3D 재구성을 지원하는 GPU가 필요합니다. GE Healthcare와 NVIDIA의 제휴는 각 벤더들이 영상 획득 단계에 AI 추론을 통합하고 있음을 보여주며, 그 결과 워크스테이션 소프트웨어는 자동 분할, 트라이아지, 품질 관리를 통합적으로 관리할 수 있어야 합니다. Prenuvo의 AI 기반 전신 MRI 플랫폼은 다기관 분석으로의 전환을 촉진하고 있으며, 각 벤더로 하여금 더 높은 처리량, 대용량 캐시, 멀티 모니터를 지원하는 인체공학적 워크스테이션을 설계하도록 요구하고 있습니다.
신흥 시장의 영상 검사 건수 증가
아시아태평양 전반에서 지속적으로 진행되고 있는 CT 및 MRI 도입 프로그램은 영상 처리 기능 업그레이드에 대한 후속 수요를 창출하고 있습니다. 인구 고령화로 인해, 특히 고도의 후처리가 필요한 종양학 및 심장 영상 분야에서 1인당 스캔 빈도가 증가하고 있습니다. 캐논 메디컬의 인도 전략은 보건부가 하드웨어 교체 주기와 병행하여 영상 아카이브 시스템 도입에 자금을 지원하고 있는 중소득 국가로 제조업체들이 더 광범위하게 발판을 옮기고 있음을 보여줍니다. 에티오피아에서는 텔레라디오로지의 도입으로 환자 대기 시간이 71% 단축된 사실이, 씬 클라이언트 워크스테이션이 어떻게 외딴 지역의 병원과 제한된 수의 방사선과 전문의를 연결해 주는지를 여실히 보여줍니다. 따라서 현장 IT 팀을 보유하지 않은 의료 기관에게 확장성이 뛰어난 클라우드 접근성은 구매 시 중요한 판단 기준이 되고 있습니다.
프리미엄 워크스테이션의 높은 초기 비용과 수명 주기 비용
설비 투자 예산은 여전히 지원 인프라보다 직접적인 환자 치료용 장비에 우선적으로 배분되고 있습니다. 다년간의 서비스 계약 및 소프트웨어 업데이트를 포함하면 총 소유 비용(TCO)이 초기 가격의 2배에 달하는 경우가 흔합니다. 소규모 의료 기관에서는 인증된 리퍼비시 하드웨어를 고려하고 있지만, 이러한 저가 제품에는 최신 GPU가 탑재되지 않은 경우가 많아 AI 성능이 제한될 수밖에 없습니다. 구독형 소프트웨어는 자본 지출의 급증을 완화할 수 있지만, 7년 기간으로 볼 때 누적 비용이 영구 라이선스 비용을 초과하는 경우도 있습니다. 방사선과 분야의 진료 보수가 감소함에 따라 재무적 검토가 더욱 엄격해지고, 조달 주기가 장기화되고 있습니다.
부문 분석
시각화 소프트웨어는 2025년 매출의 57.12%를 차지했으며, 이는 기능이 맞춤형 하드웨어가 아닌 코드에 통합되었음을 보여줍니다. 벤더들이 알고리즘 라이선스와 디스플레이 구매를 분리하고 신속한 무선 업데이트를 가능하게 함에 따라, 그 우위는 더욱 확대될 것으로 예측됩니다. 구독형 AI 분할 플러그인은 지속적인 수익원을 창출하고 기능 도입까지의 리드 타임을 단축합니다. 대조적으로, 디스플레이 유닛은 7.54%라는 가장 높은 연평균 성장률(CAGR)을 기록하고 있습니다. 이는 4K 및 8K 해상도 덕분에 미세 석회화나 폐 결절 판독 시 진단 불확실성이 감소하기 때문입니다. 6메가픽셀 해상도와 USB-C 도킹 기능을 갖춘 EIZO의 ‘RadiForce RX670’은 케이블의 복잡함을 최소화하는 인체공학적 이점의 좋은 예입니다.
구성 요소의 통합도 조달 동향을 좌우하고 있습니다. 씬 클라이언트 구성으로 인해 가치는 로컬 GPU에서 중앙 처리 노드로 이동하는 한편, 자동 보정 및 쾌적한 조명 기능으로 인해 디스플레이의 평균 판매 가격(ASP)은 상승하고 있습니다. 원격 영상 판독을 목표로 하는 시설이 늘어나는 가운데, 병원 정보 시스템에 통합된 제로 실적 뷰어는 전용 그래픽 카드에 대한 마지막 의존성을 해소합니다. 그 결과, 의료용 영상 워크스테이션 시장에서 소프트웨어의 비중은 그 어떤 하드웨어 항목보다 빠르게 계속 확대될 것으로 보입니다.
컴퓨터 단층 촬영(CT) 워크스테이션은 다기관 대응 기능 및 광자 계수 기술의 업그레이드를 배경으로 2025년 매출의 30.28%를 차지했습니다. 이 부문은 단일 CT 뷰어로 외상, 종양학, 심장 질환 사례를 모두 처리할 수 있기 때문에 기업 차원의 표준화 혜택을 누리고 있습니다. 한편, 유방촬영 플랫폼은 전국적인 검진 프로그램의 확대와 3D 토모신테시스의 보급에 힘입어 7.82%라는 가장 높은 연평균 성장률(CAGR)을 기록하고 있습니다. 콘빔 유방 CT를 통한 유방 압박의 제거는 데이터 부하를 더욱 증가시켜 워크스테이션 교체 투자를 정당화하는 요인이 될 것으로 보입니다.
MRI 워크스테이션은 설치상의 제약을 완화하는 헬륨 프리 자석의 등장으로 인해 성장세가 가속화되고 있습니다. 기존에는 하드웨어 콘솔에 의존하던 초음파 진단은 현재 클라우드 기반 후처리를 활용하여 원시 시넬 루프에서 자동 측정값을 추출할 수 있게 되었습니다. 핵의학 워크스테이션의 혁신은 디지털 검출기에 의존하고 있으며, 이를 통해 재구성 시간이 단축되고 피폭 선량이 감소하는 동시에 전신 PET 촬영이 가능해집니다.
지역별 분석
북미는 2025년 매출의 37.32%를 차지했으며, 미국과 캐나다의 의료 기관은 AI 분류 도구 및 자율 영상 획득 기술의 초기 도입자로 자리매김하고 있습니다. 이 지역은 고도의 시술에 대해 보상이 지급되는 명확한 CPT 코드의 혜택을 받고 있어, 병원은 워크스테이션에 대한 투자를 신속하게 회수할 수 있습니다. 성숙한 벤더 생태계가 혁신 주기를 가속화하고 있으며, 이미 300개 이상의 FDA 승인 AI 알고리즘을 통합할 수 있게 되었습니다.
아시아태평양은 진행 중인 병원 건설, 정부 주도의 클라우드 헬스케어 프로그램, 급속한 인구 고령화를 배경으로 연평균 성장률(CAGR) 8.02%의 전망을 보이고 있습니다. 중국에서는 군립 병원과 3차 의료 기관을 연결하는 성 수준의 원격 방사선 진단 허브가 지속적으로 확대되고 있는 반면, 인도의 ‘아유슈만 바라트(Ayushman Bharat)’ 계획에 따라 지방 도시의 진단 건수가 증가하고 있습니다. 많은 신규 시설에서는 기존 PACS 단계를 건너뛰고 개원 초기부터 클라우드 네이티브 아카이브를 도입하고 있으며, 현지 IT 인력을 최소화하는 씬 클라이언트 아키텍처가 선호되고 있습니다.
유럽에서는 ‘유럽 헬스 데이터 스페이스(European Health Data Space)’ 이니셔티브가 국경을 초월한 영상 교환을 촉진하고, 병원에 상호 운용 가능한 뷰어 도입을 장려함에 따라 꾸준한 확대가 나타나고 있습니다. 독일과 프랑스에서 전국적인 유방암 검진 확대는 3D 유방촬영 워크스테이션 도입을 뒷받침하고 있는 반면, 영국의 NHS 현대화 기금은 AI를 활용한 CT 폐암 검진 시범 사업을 지원하고 있습니다.
중동 및 아프리카에서는 민관 파트너십을 통해 주요 영상 진단센터에 자금이 지원되고 있으나, 정세 불안정이나 환율 변동으로 인해 조달이 지연될 가능성이 있습니다.
라틴아메리카에서는 진단용 하드웨어 수입 관세를 인하하는 지역 무역 협정에 따라 보급이 확대되고 있으나, 광대역 인터넷 보급 현황에 편차가 있어 지방 지역의 씬 클라이언트 도입은 제한되고 있습니다.
기타 혜택
- 엑셀 형식 시장 예측(ME) 시트
- 3개월간 애널리스트 지원
자주 묻는 질문
목차
제1장 서론
제2장 조사 방법
제3장 주요 요약
제4장 시장 구도
제5장 시장 규모 및 성장 예측
제6장 경쟁 구도
제7장 시장 기회 및 향후 전망
AJY 26.09.11According to Mordor Intelligence, the medical imaging workstations market size was valued at USD 8.20 billion in 2025 and estimated to grow from USD 8.72 billion in 2026 to reach USD 11.89 billion by 2031, at a CAGR of 6.41% during the forecast period (2026-2031).
This report is Segmented by Component (Visualization Software, Display Units, and Others), Modality (Computed Tomography (CT), Magnetic Resonance Imaging (MRI), and More), Usage Mode (Thick-Client Workstations, Thin-Client / Web-Streaming Workstations), End User (Hospitals, and More), and Geography (North America, Europe and More). The Market Forecasts are Provided in Terms of Value (USD).
Global Medical Imaging Workstations Market Trends and Insights
Rapid technological evolution in imaging modalities
Photon-counting CT, whole-body MRI screening, cone-beam breast CT, and autonomous ultrasound together raise the computational ceiling for every workstation refresh cycle. Photon-counting scanners cut radiation exposure by as much as 80% while quadrupling raw data volume, demanding GPUs that support real-time 3-D reconstructions. GE HealthCare and NVIDIA's collaboration shows how vendors are embedding AI inference at the image-acquisition layer, which in turn obliges workstation software to orchestrate automated segmentation, triage, and quality control. Prenuvo's AI-enabled whole-body MRI platform reinforces the shift toward multi-organ analysis, compelling vendors to design workstations with higher throughput, larger cache, and multi-monitor ergonomics.
Growing imaging procedure volumes in emerging markets
Continual CT and MRI installation programs across Asia Pacific generate follow-on demand for visualization upgrades. Demographic aging lifts per-capita scan rates, particularly for oncology and cardiac imaging, which rely on sophisticated post-processing. Canon Medical's India strategy signals manufacturers' broader pivot to mid-income countries whose health ministries are funding picture-archiving rollouts alongside hardware refresh cycles. Ethiopia's 71% reduction in patient waiting time after teleradiology deployment underscores how thin-client workstations connect remote hospitals to scarce radiologists. Scalable cloud access therefore becomes a core purchasing criterion for facilities that lack on-site IT teams.
High upfront and lifecycle costs of premium workstations
Capital budgets still favor direct patient-care devices over support infrastructure. Total cost of ownership often doubles initial price once multiyear service contracts and software renewals are included. Smaller facilities look at certified refurbished hardware, yet those bargains often lack modern GPUs, throttling AI performance. Subscription software can smooth out capital spikes; however, cumulative fees sometimes exceed perpetual licenses over a seven-year horizon. Reimbursement erosion in radiology magnifies financial scrutiny, stretching procurement cycles.
Other drivers and restraints analyzed in the detailed report include:
- Rising healthcare expenditure coupled with disease burden
- Accelerated healthcare digitization-enterprise PACS/VNA migrations
- Shortage of radiologists / advanced visualization specialists
For complete list of drivers and restraints, kindly check the Table Of Contents.
Segment Analysis
Visualization software generated 57.12% of 2025 revenue, illustrating how functionality now sits in code rather than bespoke hardware. That dominance will widen as vendors decouple algorithm licenses from display purchases, allowing rapid over-the-air updates. Subscription AI-segmentation plug-ins create recurring revenue streams and shorten feature lead times. Display units, in contrast, post the fastest 7.54% CAGR because 4 K and 8 K resolutions reduce diagnostic uncertainty in microcalcification and lung-nodule review. EIZO's RadiForce RX670 with six-megapixel resolution and USB-C docking typifies ergonomic gains that minimize cable clutter.
Component convergence also guides procurement: thin-client setups shift value from local GPUs into centralized processing nodes, while auto-calibration and comfort-lighting features lift display ASPs. As more facilities aim for remote reading, zero-footprint viewers embedded in the hospital information system remove the last dependency on proprietary graphics cards. Consequently, software's proportion of the medical imaging workstations market will continue to grow more rapidly than any hardware line item.
Computed tomography workstations controlled 30.28% of 2025 revenue on the back of multi-organ utility and photon-counting upgrades. The segment benefits from enterprise standardization, as a single CT viewer can serve trauma, oncology, and cardiac cases. Mammography platforms, however, register the fastest 7.82% CAGR as national screening programs expand and 3-D tomosynthesis becomes common. Cone-beam breast CT's elimination of breast compression will further raise data loads and justify workstation refresh investments.
MRI workstations gain momentum from helium-free magnet launches that ease siting constraints. Ultrasound, historically attached to hardware consoles, now leverages cloud-based post-processing that extracts automated measurements from raw cine loops. Nuclear-medicine workstation innovation hinges on digital detectors, which reduce recon time and cut dose while enabling total-body PET acquisitions.
Complete Report Scope:
- By Component
- Visualization Software
- Display Units
- Others
- By Modality
- Computed Tomography (CT)
- Magnetic Resonance Imaging (MRI)
- Ultrasound
- Mammography
- Others
- By Usage Mode
- Thick-Client Workstations
- Thin-Client / Web-Streaming Workstations
- By End-User
- Hospitals
- Diagnostic Imaging Centers
- Specialty Clinics
- Others
- By Geography
- North America
- United States
- Canada
- Mexico
- Europe
- Germany
- United Kingdom
- France
- Italy
- Spain
- Rest of Europe
- Asia Pacific
- China
- Japan
- India
- Australia
- South Korea
- Rest of Asia Pacific
- Middle East and Africa
- GCC
- South Africa
- Rest of Middle East and Africa
- South America
- Brazil
- Argentina
- Rest of South America
- North America
Geography Analysis
North America contributed 37.32% of 2025 revenue as U.S. and Canadian providers remained early adopters of AI triage tools and autonomous image acquisition. The region benefits from well-defined CPT codes that reimburse advanced procedures, allowing hospitals to recoup workstation investments quickly. A mature vendor ecosystem accelerates innovation cycles, with 300+ FDA-cleared AI algorithms already available for integration.
Asia Pacific recorded an 8.02% CAGR outlook driven by ongoing hospital build-outs, government cloud-health programs, and rapidly aging populations. China continues to scale provincial teleradiology hubs that connect county hospitals to tertiary centers, while India's Ayushman Bharat scheme boosts diagnostic volumes in secondary cities. Many new facilities bypass legacy PACS and deploy cloud-native archives from day one, favoring thin-client architectures that minimize local IT staffing.
Europe shows steady expansion as the European Health Data Space initiative encourages cross-border image exchange, nudging hospitals toward interoperable viewers. National breast-screening extensions in Germany and France stimulate adoption of 3-D mammography workstations, while UK NHS modernization funds support AI-assisted CT lung-screening pilots.
In the Middle East and Africa, public-private partnerships fund flagship imaging centers, yet political volatility and exchange-rate swings can delay procurement.
Latin America gains traction through regional trade agreements that cut import duties on diagnostic hardware, though inconsistent broadband coverage limits thin-client rollouts in rural sites.
- GE Healthcare
- Siemens Healthineers
- Canon
- Koninklijke Philips
- Hologic
- Carestream Health
- Sectra
- PaxeraHealth
- Agfa HealthCare
- Barco NV
- FUJIFILM
- Esaote
- Intelerad Medical
- Aycan Medical
- EIZO Corp.
- Viztek
- eRAD Inc.
Additional Benefits:
- The market estimate (ME) sheet in Excel format
- 3 months of analyst support
TABLE OF CONTENTS
1 Introduction
- 1.1 Study Assumptions & Market Definition
- 1.2 Scope of the Study
2 Research Methodology
3 Executive Summary
4 Market Landscape
- 4.1 Market Overview
- 4.2 Market Drivers
- 4.2.1 Rapid technological evolution in imaging modalities
- 4.2.2 Growing imaging procedure volumes in emerging markets
- 4.2.3 Rising healthcare expenditure coupled with rising disease burden
- 4.2.4 Accelerated healthcare digitization-enterprise PACS/VNA migrations
- 4.2.5 Ongoing innovations in hospital and diagnostic center infrastructure in emegring economies
- 4.2.6 Vendor-neutral API ecosystems enabling SaaS visualization plug-ins
- 4.3 Market Restraints
- 4.3.1 High upfront & lifecycle costs of premium workstations
- 4.3.2 Shortage of radiologists / advanced visualization specialists
- 4.3.3 Escalating zero-trust cybersecurity & HIPAA compliance expenses
- 4.3.4 GPU foundry capacity constraints & supply-chain shocks
- 4.4 Regulatory Landscape
- 4.5 Technological Outlook
- 4.6 Porter's Five Forces Analysis
- 4.6.1 Threat of New Entrants
- 4.6.2 Bargaining Power of Buyers
- 4.6.3 Bargaining Power of Suppliers
- 4.6.4 Threat of Substitutes
- 4.6.5 Competitive Rivalry
5 Market Size & Growth Forecasts (Value)
- 5.1 By Component
- 5.1.1 Visualization Software
- 5.1.2 Display Units
- 5.1.3 Others
- 5.2 By Modality
- 5.2.1 Computed Tomography (CT)
- 5.2.2 Magnetic Resonance Imaging (MRI)
- 5.2.3 Ultrasound
- 5.2.4 Mammography
- 5.2.5 Others
- 5.3 By Usage Mode
- 5.3.1 Thick-Client Workstations
- 5.3.2 Thin-Client / Web-Streaming Workstations
- 5.4 By End-User
- 5.4.1 Hospitals
- 5.4.2 Diagnostic Imaging Centers
- 5.4.3 Specialty Clinics
- 5.4.4 Others
- 5.5 By Geography
- 5.5.1 North America
- 5.5.1.1 United States
- 5.5.1.2 Canada
- 5.5.1.3 Mexico
- 5.5.2 Europe
- 5.5.2.1 Germany
- 5.5.2.2 United Kingdom
- 5.5.2.3 France
- 5.5.2.4 Italy
- 5.5.2.5 Spain
- 5.5.2.6 Rest of Europe
- 5.5.3 Asia Pacific
- 5.5.3.1 China
- 5.5.3.2 Japan
- 5.5.3.3 India
- 5.5.3.4 Australia
- 5.5.3.5 South Korea
- 5.5.3.6 Rest of Asia Pacific
- 5.5.4 Middle East and Africa
- 5.5.4.1 GCC
- 5.5.4.2 South Africa
- 5.5.4.3 Rest of Middle East and Africa
- 5.5.5 South America
- 5.5.5.1 Brazil
- 5.5.5.2 Argentina
- 5.5.5.3 Rest of South America
- 5.5.1 North America
6 Competitive Landscape
- 6.1 Market Concentration
- 6.2 Market Share Analysis
- 6.3 Company Profiles (includes Global level Overview, Market level overview, Core Segments, Financials as available, Strategic Information, Market Rank/Share for key companies, Products & Services, and Recent Developments)
- 6.3.1 GE HealthCare
- 6.3.2 Siemens Healthineers AG
- 6.3.3 Canon Medical Systems Corporation
- 6.3.4 Koninklijke Philips N.V.
- 6.3.5 Hologic Inc.
- 6.3.6 Carestream Health
- 6.3.7 Sectra AB
- 6.3.8 PaxeraHealth
- 6.3.9 Agfa HealthCare
- 6.3.10 Barco NV
- 6.3.11 Fujifilm Healthcare
- 6.3.12 Esaote SpA
- 6.3.13 Intelerad Medical
- 6.3.14 Aycan Medical
- 6.3.15 EIZO Corp.
- 6.3.16 Viztek
- 6.3.17 eRAD Inc.
7 Market Opportunities & Future Outlook
- 7.1 White-Space & Unmet-Need Assessment