|
시장보고서
상품코드
2123694
관절 로봇 시장 : 점유율 분석, 업계 동향과 통계, 성장 예측(2026-2031년)Articulated Robot - Market Share Analysis, Industry Trends & Statistics, Growth Forecasts (2026 - 2031) |
||||||
 Mordor Intelligence
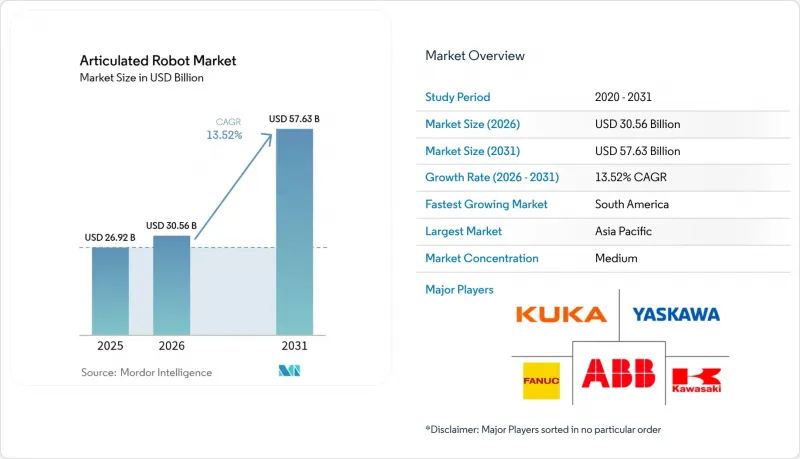
Mordor Intelligence에 의하면, 2026년 관절 로봇 시장 규모는 305억 6,000만 달러로 추정되고 있어 2025년 269억 2,000만 달러에서 성장하여 2031년에는 576억 3,000만 달러에 이를 것으로 예측됩니다.
2026년부터 2031년까지 연평균 성장률(CAGR) 13.52%로 성장할 것으로 전망됩니다.
본 보고서는 적재 중량(16kg 이하, 16-60kg, 그 이상), 축 수(4축, 5축, 그 이상), 용도(자재관리, 용접·납땜, 조립, 도장·디스펜싱 등), 최종 사용자 산업(자동차, 전기 및 전자, 금속 및 기계, 제약·의료기기 등) 및 지역별로 분류되어 있습니다. 시장 예측은 금액(달러) 기준으로 제시되어 있습니다.
세계 관절 로봇 시장 동향 및 인사이트
인더스트리 4.0이 주도하는 자동화로의 전환
각 제조업체는 관절 로봇을 AI 분석 및 IoT 센서와 연동하여 품질, 가동률, 에너지 소비를 자율적으로 최적화하는 폐쇄형 생산 생태계를 구축하고 있습니다. 폭스콘의 ‘라이트 오프(Light-Off)’ 공장에서는 로봇 작업 셀에 예측 유지보수 알고리즘을 도입함으로써 직원 수를 15만 명 감축하면서도 생산량을 유지하고 있습니다. 샤오미의 24시간 365일 가동되는 스마트폰 제조 시설은 이러한 ‘다크 팩토리’ 모델의 확장성을 입증하고 있습니다. 이러한 도입을 통해 자동화의 경제성은 ‘인력 대체’에서 ‘제품 구성의 유연성’으로 전환되어, 맞춤형 로트나 새로운 제품 변종 도입을 위한 신속한 생산 라인 전환이 가능해집니다.
인건비 급등과 숙련된 노동자 부족
현재 로봇의 가동 비용은 시간당 1.60-2달러로, 많은 지역에서 5.50달러를 초과하는 인건비보다 낮기 때문에 투자 수익률(ROI) 산정 시 자동화가 명백히 유리합니다. 제너럴 모터스(GM)와 존 디어는 로봇 용접 셀을 도입한 후 용접 인건비를 50% 절감하고 불량률을 25% 낮췄습니다. GXO 로지스틱스 등의 창고 운영 회사는 인력 부족을 보완하면서 안전 지표를 향상시키기 위해 아폴로의 휴머노이드 로봇을 도입하고 있습니다. 유럽과 동아시아의 인구 고령화가 이러한 촉진요인을 장기적으로 뒷받침하고 있습니다.
초기 도입 및 통합 비용의 높음
관절 로봇 셀의 총 비용은 시스템 통합, 안전 설비 및 교육 비용을 포함하면 2배까지 늘어날 수 있어 중소기업에게는 도입 장벽이 되고 있습니다. 라틴아메리카의 중소기업들은 통합 업체나 자금 조달 기회가 제한적이라는 점을 도입의 주요 장벽으로 꼽고 있습니다. ‘Robots-as-a-Service(RaaS)’ 모델은 설비 투자(CapEx)를 운영비(OpEx)로 전환함으로써 이러한 제약을 완화합니다. Formic사는 가동률 99.8%로 20만 생산 시간 계약을 달성했다고 보고했으며, 이는 사용량에 따른 과금 방식의 자동화에 대한 투자자들의 높은 관심을 여실히 보여주고 있습니다.
부문 분석
16kg 이하 등급은 전자, 제약 및 협동 로봇 도입을 배경으로 연평균 성장률(CAGR) 15.42%를 기록하며 다른 모든 등급을 상회할 것으로 예측됩니다. 한편, 16-60kg 부문은 2025년 시점에서 관절 로봇 시장 점유율의 32.54%를 차지했습니다. 사용자들은 속도, 에너지 절약, 그리고 사람과 로봇의 공존에 있어 안전성 측면에서 경량 플랫폼을 선호하고 있습니다. 프리덤 프레시 호주(Freedom Fresh Australia)의 마카다미아 생산 라인에서는 경량 스카라 로봇을 사용하여 0.39초의 사이클을 실현하고 있으며, 이는 식품 포장 분야의 생산성 향상을 입증하고 있습니다. 에너지 효율에 대한 압박으로 인해 소재 혁신도 진행되고 있습니다. 코그니보틱스(Cognibotics)사의 탄소섬유 암은 강성을 유지하면서도 전력 소비를 90% 절감하고 있습니다.
자동차 차체 공장이나 주조 공정에서 60-225kg 및 225kg을 초과하는 로봇에 대한 수요는 안정적이지만, 각 OEM 업체들이 설비 확장보다는 기존 설비의 가동률 향상에 주력하고 있어 성장은 둔화되고 있습니다. 고하중 암에는 공압 에너지 사용량을 90% 절감하는 형상 기억 합금 그리퍼가 점점 더 많이 채택되고 있습니다. 2026년부터 2031년까지 대형 다관절 로봇 시장 규모는 전기차용 배터리 팩 운반 및 풍력 터빈 부품 취급 수요에 힘입어 한 자릿수 성장률로 확대될 것으로 예측됩니다.
2025년에는 6축 모델이 매출의 51.35%를 차지하며, 용접, 도장, 정밀 조립 분야에서 사실상 주력 기종으로 다관절 로봇 시장을 지탱하고 있습니다. 가격대는 경량 모델의 경우 5,000달러 미만부터 클린룸용 모델의 경우 50만 달러를 넘는 것까지 다양합니다. 모듈식 컨트롤러 덕분에 설치 면적이 축소되어, 공간에 제약이 있는 중소기업에게 큰 이점이 되고 있습니다.
7축 및 하이퍼덱스텔라스형은 연평균 성장률(CAGR) 15.98%를 기록하며 가장 빠르게 성장하는 틈새 시장입니다. 야마하의 YA 시리즈는 팔꿈치 부분이 좁은 지그 주변에서 회전하기 때문에 고밀도 생산 셀에서 타크트 타임 단축을 가능하게 합니다. MDPI가 연구 중인 병렬 토폴로지 로봇은 픽 앤 플레이스 작업에서 더 높은 강성 대 중량비를 실현할 것으로 기대됩니다. 자동차 내장이 점점 더 복잡해지고 가전제품의 소형화 추세가 진행됨에 따라, 좁은 공간 내에서 이동하기 위한 추가 축에 대한 수요는 더욱 높아질 것입니다.
지역별 분석
아시아태평양은 중국 시장 규모와 일본의 혁신 생태계에 힘입어 2025년에는 매출의 42.05%를 차지하며 그 우위를 유지했습니다. 각 지역 정부는 중소기업의 도입을 가속화하는 선도적인 프로젝트에 자금을 지원하고 있으며, 국내 임금 상승으로 인해 비용 면에서의 우위가 둔화되고 있음에도 불구하고 다관절 로봇 시장 규모 확대를 안정적으로 유지하고 있습니다. 일본의 ‘로봇 세액 공제’와 한국의 ‘AI 바우처 제도’ 덕분에 파이프라인 활동은 견조한 추세를 보이고 있습니다.
남미는 자동차의 전동화와 농업 자동화에 대한 외국인 직접 투자에 힘입어 2031년까지 연평균 성장률(CAGR) 14.86%로 가장 빠른 성장이 예상됩니다. 브라질의 SOLIX 필드 로봇은 AI 비전 기술이 관절 로봇의 설계 범위를 야외 작물 관리로 확장하는 한 가지 사례를 보여줍니다. Case IH가 진행한 2,000만 달러 규모의 솔로카바 공장 개보수에서는 AI를 도입해 수확기의 기능 90%를 제어하고 있으며, 이는 이 지역에서 첨단 로봇 기술에 대한 수요가 높음을 보여줍니다.
북미에서는 연방 정부의 생산 거점 국내 복귀(리쇼어링) 장려 정책과 전기차(EV) 공급망 프로젝트에 힘입어, 2024년 도입 대수는 전년 대비 12% 증가한 총 4만 4,303대를 기록했습니다. 유럽은 에너지 가격 급등이라는 역풍에 직면해 있지만, 현지 생산 능력에 대한 투자를 추진하고 있습니다. 야스카와 전기가 3,150만 유로를 투자한 슬로베니아 거점에서는 2027년까지 EMEA 지역으로의 로봇 출하량의 80%를 현지에서 생산할 예정입니다. 중동 및 아프리카은 여전히 발전 단계에 있지만, 건설 및 석유화학 플랜트 유지보수 분야에서 실증 실험이 진행되고 있어, 장기적인 관절 로봇 시장 보급을 위한 기반이 마련되고 있습니다.
기타 혜택:
- 엑셀 형식 시장 예측(ME) 시트
- 3개월간의 애널리스트 지원
자주 묻는 질문
목차
제1장 서론
제2장 조사 방법
제3장 주요 요약
제4장 시장 구도
제5장 시장 규모와 성장 예측
제6장 경쟁 구도
제7장 시장 기회와 향후 동향
JHS 26.09.07According to Mordor Intelligence, articulated robot market size in 2026 is estimated at USD 30.56 billion, growing from 2025 value of USD 26.92 billion with 2031 projections showing USD 57.63 billion, growing at 13.52% CAGR over 2026-2031.
This report is Segmented by Payload Capacity (Up To 16 Kg, 16 - 60 Kg, and More), Axis Type (4-Axis, 5-Axis, and More), Application (Material Handling, Welding and Soldering, Assembly, Painting and Dispensing, and More), End-User Industry (Automotive, Electrical and Electronics, Metals and Machinery, Pharmaceutical and Medical Devices, and More), and Geography. The Market Forecasts are Provided in Terms of Value (USD).
Global Articulated Robot Market Trends and Insights
Shift toward Industry 4.0-led automation
Manufacturers are linking articulated robots with AI analytics and IoT sensors to create closed-loop production ecosystems that self-optimise quality, uptime, and energy consumption. Foxconn's lights-off sites cut headcount by 150,000 yet sustained output by embedding predictive-maintenance algorithms in robotic workcells. Xiaomi's 24/7 smartphone facility demonstrates the scalability of such dark-factory models. These deployments shift automation economics from manpower substitution to product-mix agility, enabling rapid re-tooling for customised lots and variant introductions.
Rising labor cost and skilled-worker shortage
Robot operating costs of USD 1.60-2.00 per hour now undercut human wages exceeding USD 5.50 in many regions, tilting ROI calculations decisively toward automation. General Motors and John Deere trimmed welding labor expenses by 50% and defects by 25% after adopting robotic welding cells. Warehouse operators such as GXO Logistics have turned to Apollo humanoids to bridge head-count gaps while improving safety metrics. Ageing demographics in Europe and East Asia anchor this driver for the long term.
High upfront acquisition and integration cost
Total cost of an articulated robot cell can double once integration, safety equipment, and training are included, discouraging smaller enterprises. Latin American SMEs cite limited access to integrators and finance as key barriers to adoption. Robots-as-a-Service models mitigate this restraint by converting cap-ex into opex; Formic reported 200,000 contracted production hours at 99.8% uptime, highlighting investor appetite for pay-per-use automation.
Other drivers and restraints analyzed in the detailed report include:
- Government incentives for smart manufacturing
- Automotive e-mobility cap-ex boom
- Servo-motor and semiconductor supply bottlenecks
For complete list of drivers and restraints, kindly check the Table Of Contents.
Segment Analysis
The <= 16 kg class is projected to outpace all others at a 15.42% CAGR on the back of electronics, pharma, and collaborative deployments, whereas the 16-60 kg segment retained 32.54% of articulated robot market share in 2025. Users favour lighter platforms for speed, energy thrift, and human-adjacent safety. Freedom Fresh Australia's macadamia line runs 0.39-second cycles with a lightweight SCARA unit, underscoring productivity gains in food packing. Energy-efficiency pressures are driving material innovations: carbon-fibre arms from Cognibotics cut consumption by 90% while maintaining rigidity.
Demand for 60-225 kg and > 225 kg robots remains stable in automotive body-shop and foundry tasks, yet growth decelerates as OEMs sweat installed assets rather than expand footprint. High-payload arms increasingly integrate shape-memory alloy grippers that slash pneumatic energy use by 90%. Over 2026-2031, the articulated robot market size for heavy-duty classes is forecast to expand at single-digit rates, supported by EV battery pack lifting and wind-turbine component handling.
Six-axis models captured 51.35% of revenue in 2025, anchoring the articulated robot market as the de-facto workhorse for welding, painting and precision assembly. Cost points now span under USD 5,000 for light units to beyond USD 500,000 for clean-room variants. Modular controllers are shrinking installation footprints, a boon for SMEs with space constraints.
Seven-axis and hyper-dexterous formats are the fastest-rising niche, charting a 15.98% CAGR. Yamaha's YA series elbows rotate around confined fixtures, enabling shorter takt times in dense production cells. Parallel-topology robots studied by MDPI promise higher stiffness-to-weight ratios for pick-and-place cycles. As automotive interiors grow more complex and consumer electronics trend toward miniaturisation, demand for extra axes to navigate tight envelopes will intensify.
Complete Report Scope:
- By Payload Capacity
- Up to 16 kg
- 16 - 60 kg
- 60 - 225 kg
- Above 225 kg
- By Axis Type
- 4-Axis
- 5-Axis
- 6-Axis
- 7-Axis and Above
- By Application
- Material Handling
- Welding and Soldering
- Assembly
- Painting and Dispensing
- Packaging and Palletizing
- Inspection and Quality Assurance
- Others
- By End-user Industry
- Automotive
- Electrical and Electronics
- Metals and Machinery
- Pharmaceutical and Medical Devices
- Food and Beverages
- E-commerce and Logistics
- Other End-User Industries
- By Geography
- North America
- United States
- Canada
- Mexico
- South America
- Brazil
- Argentina
- Chile
- Rest of South America
- Europe
- Germany
- United Kingdom
- France
- Italy
- Spain
- Russia
- Rest of Europe
- Asia-Pacific
- China
- India
- Japan
- South Korea
- Singapore
- Malaysia
- Australia
- Rest of Asia-Pacific
- Middle East and Africa
- Middle East
- United Arab Emirates
- Saudi Arabia
- Turkey
- Rest of Middle East
- Africa
- South Africa
- Nigeria
- Egypt
- Rest of Africa
- Middle East
- North America
Geography Analysis
Asia-Pacific retained its dominance with 42.05% revenue in 2025, propelled by China's scale and Japan's innovation ecosystems. Regional governments fund lighthouse projects that accelerate SME uptake, stabilising articulated robot market size gains even as domestic wage growth tempers cost advantages. Japan's Robot Tax Credit and Korea's AI Voucher Scheme keep pipeline activity robust.
South America is forecast to grow the fastest at 14.86% CAGR through 2031, underwritten by foreign direct investments in automotive electrification and agri-automation. Brazil's SOLIX field robot shows how AI vision extends articulated design into open-field crop management. Case IH's USD 20 million Sorocaba upgrade embeds AI to command 90% harvester functions, demonstrating regional appetite for advanced robotics.
North America posted 12% year-on-year installation growth in 2024-totaling 44,303 units-supported by federal reshoring incentives and EV supply-chain projects. Europe faces energy-price headwinds yet invests in local capacity; Yaskawa's EUR 31.5 million Slovenian hub will localise 80% of EMEA robot deliveries by 2027. The Middle East and Africa remain nascent but attract pilots in construction and petrochemical maintenance, laying the groundwork for long-run articulated robot market adoption.
- ABB Ltd.
- FANUC Corporation
- Yaskawa Electric Corp.
- KUKA AG
- Kawasaki Heavy Industries Ltd.
- Mitsubishi Electric Corp.
- Nachi-Fujikoshi Corp.
- DENSO Corp.
- Seiko Epson Corp.
- Staubli International AG
- Hyundai Robotics Co., Ltd.
- Comau SpA
- Omron Adept Technology Inc.
- Universal Robots A/S
- Durr AG (Paint Robots)
- Estun Automation Co., Ltd.
- SIASUN Robot & Automation Co.
- JAKA Robotics Ltd.
- Techman Robot Inc.
- Precise Automation Inc.
- CMA Robotics SpA
- Gudel Group AG
- IAI Corporation
- Aubo Robotics Inc.
- Robot Industrial Association (RIA)
Additional Benefits:
- The market estimate (ME) sheet in Excel format
- 3 months of analyst support
TABLE OF CONTENTS
1 INTRODUCTION
- 1.1 Study Assumptions and Market Definition
- 1.2 Scope of the Study
2 RESEARCH METHODOLOGY
3 EXECUTIVE SUMMARY
4 MARKET LANDSCAPE
- 4.1 Market Overview
- 4.2 Market Drivers
- 4.2.1 Shift toward Industry 4.0-led automation
- 4.2.2 Rising labor cost and skilled-worker shortage
- 4.2.3 Government incentives for smart manufacturing
- 4.2.4 Automotive e-mobility cap-ex boom
- 4.2.5 AI-enabled adaptive articulated cobots
- 4.2.6 Fulfilment-center automation by e-commerce majors
- 4.3 Market Restraints
- 4.3.1 High upfront acquisition and integration cost
- 4.3.2 Scarcity of system-integration talent
- 4.3.3 Cyber-security risk in connected robot controllers
- 4.3.4 Servo-motor and semiconductor supply bottlenecks
- 4.4 Industry Value Chain Analysis
- 4.5 Regulatory Landscape
- 4.6 Technological Outlook
- 4.7 Industry Attractiveness - Porter's Five Forces Analysis
- 4.7.1 Threat of New Entrants
- 4.7.2 Bargaining Power of Buyers
- 4.7.3 Bargaining Power of Suppliers
- 4.7.4 Threat of Substitutes
- 4.7.5 Intensity of Competitive Rivalry
- 4.8 Impact of Macroeconomic Factors on the Market
5 MARKET SIZE AND GROWTH FORECASTS (VALUES)
- 5.1 By Payload Capacity
- 5.1.1 Up to 16 kg
- 5.1.2 16 - 60 kg
- 5.1.3 60 - 225 kg
- 5.1.4 Above 225 kg
- 5.2 By Axis Type
- 5.2.1 4-Axis
- 5.2.2 5-Axis
- 5.2.3 6-Axis
- 5.2.4 7-Axis and Above
- 5.3 By Application
- 5.3.1 Material Handling
- 5.3.2 Welding and Soldering
- 5.3.3 Assembly
- 5.3.4 Painting and Dispensing
- 5.3.5 Packaging and Palletizing
- 5.3.6 Inspection and Quality Assurance
- 5.3.7 Others
- 5.4 By End-user Industry
- 5.4.1 Automotive
- 5.4.2 Electrical and Electronics
- 5.4.3 Metals and Machinery
- 5.4.4 Pharmaceutical and Medical Devices
- 5.4.5 Food and Beverages
- 5.4.6 E-commerce and Logistics
- 5.4.7 Other End-User Industries
- 5.5 By Geography
- 5.5.1 North America
- 5.5.1.1 United States
- 5.5.1.2 Canada
- 5.5.1.3 Mexico
- 5.5.2 South America
- 5.5.2.1 Brazil
- 5.5.2.2 Argentina
- 5.5.2.3 Chile
- 5.5.2.4 Rest of South America
- 5.5.3 Europe
- 5.5.3.1 Germany
- 5.5.3.2 United Kingdom
- 5.5.3.3 France
- 5.5.3.4 Italy
- 5.5.3.5 Spain
- 5.5.3.6 Russia
- 5.5.3.7 Rest of Europe
- 5.5.4 Asia-Pacific
- 5.5.4.1 China
- 5.5.4.2 India
- 5.5.4.3 Japan
- 5.5.4.4 South Korea
- 5.5.4.5 Singapore
- 5.5.4.6 Malaysia
- 5.5.4.7 Australia
- 5.5.4.8 Rest of Asia-Pacific
- 5.5.5 Middle East and Africa
- 5.5.5.1 Middle East
- 5.5.5.1.1 United Arab Emirates
- 5.5.5.1.2 Saudi Arabia
- 5.5.5.1.3 Turkey
- 5.5.5.1.4 Rest of Middle East
- 5.5.5.2 Africa
- 5.5.5.2.1 South Africa
- 5.5.5.2.2 Nigeria
- 5.5.5.2.3 Egypt
- 5.5.5.2.4 Rest of Africa
- 5.5.5.1 Middle East
- 5.5.1 North America
6 COMPETITIVE LANDSCAPE
- 6.1 Market Concentration
- 6.2 Strategic Moves
- 6.3 Market Share Analysis
- 6.4 Company Profiles (includes Global level Overview, Market level overview, Core Segments, Financials as available, Strategic Information, Market Rank/Share for key companies, Products and Services, and Recent Developments)
- 6.4.1 ABB Ltd.
- 6.4.2 FANUC Corporation
- 6.4.3 Yaskawa Electric Corp.
- 6.4.4 KUKA AG
- 6.4.5 Kawasaki Heavy Industries Ltd.
- 6.4.6 Mitsubishi Electric Corp.
- 6.4.7 Nachi-Fujikoshi Corp.
- 6.4.8 DENSO Corp.
- 6.4.9 Seiko Epson Corp.
- 6.4.10 Staubli International AG
- 6.4.11 Hyundai Robotics Co., Ltd.
- 6.4.12 Comau SpA
- 6.4.13 Omron Adept Technology Inc.
- 6.4.14 Universal Robots A/S
- 6.4.15 Durr AG (Paint Robots)
- 6.4.16 Estun Automation Co., Ltd.
- 6.4.17 SIASUN Robot & Automation Co.
- 6.4.18 JAKA Robotics Ltd.
- 6.4.19 Techman Robot Inc.
- 6.4.20 Precise Automation Inc.
- 6.4.21 CMA Robotics SpA
- 6.4.22 Gudel Group AG
- 6.4.23 IAI Corporation
- 6.4.24 Aubo Robotics Inc.
- 6.4.25 Robot Industrial Association (RIA)
7 MARKET OPPORTUNITIES AND FUTURE TRENDS
- 7.1 White-Space and Unmet-Need Assessment