

|
시장보고서
상품코드
2123710
전기영동 장비 및 소모품 시장 : 시장 점유율 분석, 업계 동향 및 통계, 성장 예측(2026-2031년)Electrophoresis Equipment And Supplies - Market Share Analysis, Industry Trends & Statistics, Growth Forecasts (2026 - 2031) |
||||||
 Mordor Intelligence
Mordor Intelligence에 의하면, 전기영동 장비 및 소모품 시장 규모는 2025년 22억 2,000만 달러로 평가되었고, 2026년에는 23억 3,000만 달러로 추정되고, 2026-2031년 CAGR 4.79%로 성장을 지속할 전망이며, 2031년에는 29억 4,000만 달러에 이를 것으로 예측됩니다.
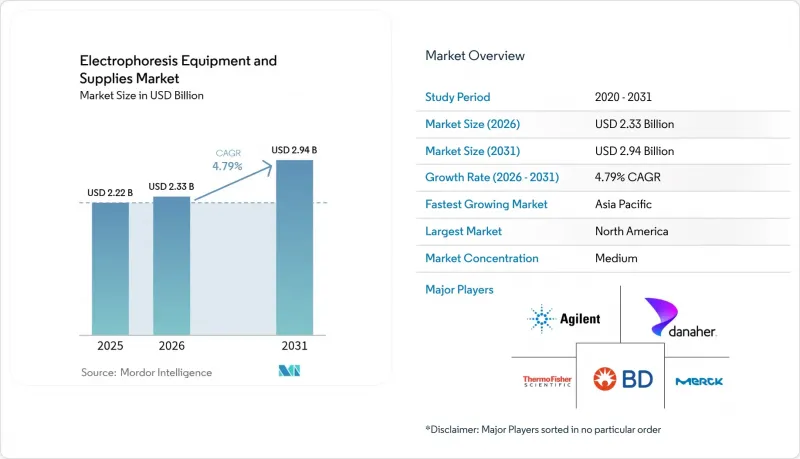
본 보고서는 제품별(시스템, 시약 및 소모품, 소프트웨어 이미징 솔루션), 용도별(유전체학, 기타), 워크플로 단계별(시료 전처리, 분리, 시각화), 지역별(북미, 유럽, 아시아태평양, 중동 및 아프리카, 남미)로 분류되어 있습니다. 시장 예측은 금액(달러) 기준으로 제시되어 있습니다.
세계의 전기영동 장비 및 소모품 시장 동향과 인사이트
맞춤형 의료 및 유전체 진단의 보급 확대
모세관 전기영동은 PCR 워크플로우와 원활하게 연동되어, 낭포성 섬유증 및 헌팅턴병과 같은 질환의 근본 원인이 되는 유전자 변이를 신속하고 자동으로 검출합니다. 『Clinical Chemistry and Laboratory Medicine』지에 게재된 성능 벤치마크에 따르면, 전기영동을 통해 수작업 시간을 최소화하면서 1교대당 수백 개의 검체를 스크리닝할 수 있는 것으로 확인되었으며, 이를 통해 병원 검사실의 운영 비용을 절감할 수 있습니다. 현재, 포인트 오브 케어용 마이크로플루이딕스 장치는 이러한 기능을 병상 환경까지 확대되고 있습니다. 소형 카트리지를 통해 5분 이내에 분리를 완료할 수 있어, 정밀의료 프로토콜에서 이 기법의 중요성을 입증하고 있습니다.
전 세계 학술 및 수탁 연구 인프라의 확대
인도, 중국, 인도네시아, 나이지리아에서 정부 자금에 의한 검사실 확충으로 인해, 전기영동은 교육 및 연구의 기반이 되는 도구로서의 입지를 확고히 하고 있습니다. 분자생물학 프로그램 입학자 수의 급증에 따라, 기본적인 수평형 및 수직형 젤 장치와 엔트리 레벨 모세관 시스템의 대량 조달이 진행되고 있습니다. 계약 연구 기관(CRO)은 전기영동 분석법을 멀티오믹스 서비스 라인에 통합함으로써 이러한 추세를 더욱 가속화하고 있으며, 각 지역 거점에서 소모품에 대한 안정적인 수요를 확보하고 있습니다.
첨단 전기영동 시스템의 고액 설비 투자 및 운영 비용
최첨단 모세관 유전자 분석 장치의 가격은 7만 5,000달러에서 15만 달러 사이입니다. 폴리머 매트릭스나 모세관 등의 소모품은 일상적으로 사용할 경우 3년 이내에 초기 하드웨어 구매 비용을 초과할 가능성이 있습니다. 분석용 수입품에 대해 제안된 관세표가 적용될 경우, 생명과학 부문 전체의 운영 예산에 630억 달러가 추가될 것이며, 소규모 연구소는 장비 교체 계획을 연기할 수밖에 없을 것으로 보입니다. 고순도 완충액공급망에서 발생하는 공급 차질은 비용 구조의 취약성을 여실히 드러내고 있으며, 자원이 제한된 지역에서는 가격이 도입의 주요 장벽으로 작용하고 있습니다.
부문 분석
2025년 전기영동 장비 및 소모품 시장에서 시약 및 소모품의 규모는 10억 2,000만 달러로 평가되었고, 총 수익의 46.02%를 차지했습니다. 완충액 농축액, 프리캐스트 젤, 형광 염색제, 분자량 래더는 일회용이거나 재사용 횟수가 제한적이기 때문에 자본 지출이 부진한 시기에도 수익을 안정적으로 유지하는 보충 주기가 보장됩니다. 시스템 매출은 여전히 경기 순환의 영향을 받지만, 실험실이 기존 젤 박스를 AI가 탑재된 문서화 모듈로 교체함에 따라 소프트웨어 및 이미징 제품군의 매출은 연평균 6.21% 성장할 것으로 예측됩니다. 에든버러 대학의 GelGenie 엔진은 픽셀 수준의 정밀도로 미약한 밴드를 분석하고 규정 준수 보고서를 자동으로 생성함으로써 이러한 전환을 구현하고 있습니다.
마이크로플루이딕스 카트리지의 발전으로 칩 기반 소모품과 탁상형 분석 장치를 결합한 새로운 하이브리드 카테고리가 확립되고 있습니다. 각 ‘랩 온 어 칩(Lab-on-a-chip)’ 실행 시 나노리터 단위의 시약만 소비되므로 시약 구매량은 최대 90%까지 감소하지만, 칩 매출은 전체적으로 증가합니다. 공급업체들은 이러한 상충 관계를 활용하여 이익률의 안정화를 도모하고 있습니다. 차세대 기기에 탑재된 스마트 유지보수 대시보드는 버퍼나 모세관의 자동 재주문을 촉진하여, 전기영동 장치 및 소모품 시장을 뒷받침하는 ‘소모품 우선’ 비즈니스 모델을 강화하고 있습니다.
2025년에는 NGS 및 qPCR에 선행하는 DNA 시료 전처리, RNA 무결성 검사, 단편 분석 프로토콜을 배경으로, 유전체학 워크플로가 전기영동 장치 및 소모품 시장의 54.96% 점유율을 차지했습니다. 그러나 2031년까지의 연평균 성장률(CAGR)이 가장 높은 분야는 임상 진단 부문으로 6.68%이며, 이는 단백질 치료에 대한 CE-SDS 검증과 병원 검사실 도입을 간소화하는 FDA 클래스 I 면제에 힘입은 결과입니다. 단백질체학 부문에서는 전하 변이체 모니터링에 사용되는 모세관 등전점 초점화로의 전환이 진행되고 있으며, 10개 실험실을 대상으로 한 업계 라운드 로빈 검사에서 pI 값의 상대 표준 편차가 5% 이하로 나타나 엄격한 출시 기준을 충족하고 있습니다.
전기영동은 신속한 처리, 제한된 검체의 선별, 확실한 육안 확인이 요구되는 1차 스크리닝 업무에 여전히 적합합니다. 임상 실험실이 외래 진료 환경으로 전환되는 가운데, 이 기술은 설치 면적이 작고 소모품이 일체형이기 때문에 관리된 유틸리티가 필요한 질량 분석기에 비해 물류 측면에서 우위를 차지합니다.
지역별 분석
북미는 바이오의약품 클러스터의 밀집도가 높고, FDA의 명확한 지침이 있으며, 젤 및 모세관 시스템의 도입 기반이 잘 갖춰져 있어 2025년에는 전 세계 매출의 42.03%를 차지했습니다(FDA.GOV). 업그레이드 수요는 전자 배치 기록을 통합하여 GMP 준수를 효율화하는 완전 자동화 하드웨어에 집중되어 있습니다. 과학 기기 수입에 대한 관세 불확실성은 틈새 부품의 조달 비용을 상승시킬 가능성은 있지만, 주로 지역 내에서 제조되는 소모품공급 흐름을 방해할 가능성은 낮을 것으로 보입니다.
아시아태평양은 연평균 성장률(CAGR) 5.39%로 예측되는 가장 빠르게 성장하는 지역입니다. 중국의 ‘제14차 5개년 계획’에서는 대학 수준의 생화학 실험실에 막대한 자금이 배정된 반면, 인도의 생산 연계형 인센티브 프로그램은 분석 기기를 대상으로 하여 대학 네트워크 전반에 걸쳐 조달 붐을 일으키고 있습니다. 일본과 한국에서는 바이오시밀러 개발을 위한 고급 모세관 시스템이 계속해서 선호되고 있어, 안정적이고 고부가가치 수요를 뒷받침하고 있습니다.
유럽은 생명공학 스타트업 증가와 공공 의료 시스템의 비용 절감 사이에서 균형을 유지하며 안정적인 성장을 이어가고 있습니다. EU의 의료기기 규제 조화로 인해 지역 간 제품 출시가 간소화되고 있지만, 지속가능성 관련 지침으로 인해 공급업체들은 소모품에서 플라스틱 폐기물을 최소화해야 하는 압박을 받고 있습니다.
라틴아메리카와 중동 및 아프리카는 아직 발전 단계에 있지만, 미래가 기대되고 있습니다. 브라질과 사우디아라비아 보건부는 헤모글로빈 질환 신생아 선별 검사에서 전기영동 검증을 의무화하고 있어, 향후 플랫폼 업그레이드를 위한 기반을 마련하고 있습니다.
기타 혜택
- 엑셀 형식 시장 예측(ME) 시트
- 3개월간의 애널리스트 지원
자주 묻는 질문
목차
제1장 서론
제2장 조사 방법
제3장 주요 요약
제4장 시장 구도
제5장 시장 규모 및 성장 예측
제6장 경쟁 구도
제7장 시장 기회 및 향후 전망
AJY 26.09.11According to Mordor Intelligence, the electrophoresis equipment and supplies market size is expected to grow from USD 2.22 billion in 2025 to USD 2.33 billion in 2026 and is forecast to reach USD 2.94 billion by 2031 at 4.79% CAGR over 2026-2031.
This report is Segmented by Product (Systems, Reagents & Consumables, and Software & Imaging Solutions), Application (Genomics, and More), Workflow Stage (Sample Preparation, Separation, and Visualization), and Geography (North America, Europe, Asia-Pacific, MEA, South America). The Market Forecasts are Provided in Terms of Value (USD).
Global Electrophoresis Equipment And Supplies Market Trends and Insights
Growing Adoption of Personalized Medicine and Genomic Diagnostics
Capillary electrophoresis couples seamlessly with PCR workflows to deliver rapid, automated detection of gene variants underlying disorders such as cystic fibrosis and Huntington's disease. Performance benchmarks published in Clinical Chemistry and Laboratory Medicine confirm that electrophoresis can screen hundreds of samples per shift with minimal hands-on time, which reduces operational costs for hospital labs. Point-of-care microfluidic devices now bring this capability to bedside settings, where compact cartridges complete separations in less than five minutes, underscoring the modality's relevance to precision-care protocols.
Expansion of Academic and Contract Research Infrastructure Worldwide
Government-funded laboratory build-outs across India, China, Indonesia, and Nigeria position electrophoresis as a foundational teaching and research tool. Enrollment surges in molecular-biology programs have triggered bulk procurements of basic horizontal and vertical gel units as well as entry-level capillary systems. Contract research organizations (CROs) carry this momentum forward by integrating electrophoretic assays into multi-omic service lines, ensuring steady consumables pull-through across regional hubs.
High Capital and Operating Costs of Advanced Electrophoresis Systems
State-of-the-art capillary genetic analyzers list between USD 75,000 and USD 150,000. Consumables, including polymer matrices and capillaries, can outstrip the initial hardware outlay within three years of routine use. Proposed tariff schedules on analytical imports would add USD 63 billion to operating budgets across life-science sectors, prompting smaller laboratories to postpone refresh plans. Supply chain interruptions in high-purity buffers underscore the fragility of the cost structure, making price a primary adoption barrier in resource-constrained geographies.
Other drivers and restraints analyzed in the detailed report include:
- Rising Demand for High-Throughput Quality Control in Biologics Manufacturing
- Convergence with Microfluidics and Automation Platforms
- Competition from Alternative Separation Technologies Such as LC-MS
For complete list of drivers and restraints, kindly check the Table Of Contents.
Segment Analysis
Electrophoresis equipment and supplies market size for reagents and consumables was USD 1.02 billion in 2025, equating to 46.02% of overall revenue. Buffer concentrates, pre-cast gels, fluorescent stains, and molecular weight ladders are single-use or limited-reuse items, guaranteeing a replenishment cycle that cushions revenue against capital-spending lulls. Systems sales remain cyclical but software and imaging suites are forecast to compound at 6.21% annually as laboratories retrofit legacy gel boxes with AI-enabled documentation modules. The University of Edinburgh GelGenie engine exemplifies this transition by parsing faint bands with pixel-level accuracy and automatically generating compliance-ready reports.
Advances in microfluidic cartridges carve out a new hybrid category of chip-based consumables plus bench-top analyzers. Each lab-on-a-chip run consumes nanoliter volumes, reducing reagent purchases by as much as 90%, but drives higher chip revenue in aggregate, a trade-off vendors leverage to stabilize margin profiles. Smart-maintenance dashboards inside next-generation instruments prompt automatic re-ordering of buffers and capillaries, reinforcing the consumables-first business model that underpins the electrophoresis equipment and supplies market.
Genomics workflows controlled 54.96% of electrophoresis equipment and supplies market share in 2025 on the back of DNA sample preparation, RNA integrity checks, and fragment analysis protocols that precede NGS or qPCR. Yet the highest CAGR through 2031 belongs to clinical diagnostics at 6.68%, buoyed by CE-SDS validation for protein therapeutics and the FDA Class I exemption that simplifies implementation in hospital labs. Proteomics continues to pivot toward capillary isoelectric focusing for charge-variant monitoring, where industry round-robin studies across ten labs yielded relative standard deviations under 5% on pI values, meeting stringent release criteria.
Electrophoresis remains well suited to frontline screening tasks that need quick turnaround, limited sample triage, and definitive visual confirmation. As clinical labs migrate to outpatient settings, the technology's modest footprint and self-contained consumables give it a logistical edge over mass spectrometers that demand controlled utilities.
Complete Report Scope:
- By Product
- Systems
- Gel Electrophoresis Systems
- Capillary Electrophoresis Systems
- Microfluidic Electrophoresis Systems
- Reagents & Consumables
- Gels & Buffers
- Stains & Dyes
- Membranes & Blotting Media
- Molecular Weight Standards & Ladders
- Software & Imaging Solutions
- Gel Documentation & Analysis Software
- CE Data Analysis Platforms
- AI-Driven Automation Suites
- Systems
- By Application
- Genomics (DNA/RNA Analysis)
- Proteomics (Protein Characterization)
- Clinical Diagnostics
- Quality Control & Process Validation
- By Workflow Stage
- Sample Preparation & Loading
- Separation & Fractionation
- Visualization, Imaging & Data Analysis
- By End-User
- Academic & Research Institutes
- Hospitals & Diagnostic Centers
- Pharmaceutical & Biotechnology Companies
- Geography
- North America
- United States
- Canada
- Mexico
- Europe
- Germany
- United Kingdom
- France
- Italy
- Spain
- Rest of Europe
- Asia-Pacific
- China
- Japan
- India
- Australia
- South Korea
- Rest of Asia-Pacific
- Middle East & Africa
- GCC
- South Africa
- Rest of Middle East & Africa
- South America
- Brazil
- Argentina
- Rest of South America
- North America
Geography Analysis
North America contributed 42.03% of global revenue in 2025 thanks to its dense biopharma cluster, clear FDA guidance, and deep installed base of gel and capillary systems FDA.GOV. Replacement demand centers on fully automated hardware that integrates electronic batch records to streamline GMP compliance. Tariff uncertainty on scientific imports could raise acquisition costs for niche components but is unlikely to disrupt consumables flows, which are predominantly regionally manufactured.
Asia-Pacific is the fastest-advancing territory with a projected 5.39% CAGR. China's 14th Five-Year Plan earmarks substantial funding for college-level biochemistry labs, while India's production-linked incentive program covers analytical instruments, triggering procurement waves across university networks. Japan and South Korea continue to favor premium capillary systems for biosimilar development, reinforcing steady high-value demand.
Europe maintains equilibrium growth, balancing rising biotech start-ups with cost-containment in public health systems. EU device regulation harmonization simplifies pan-regional launches, but sustainability directives push vendors to minimize plastic waste in consumables.
Latin America and MEA remain nascent yet promising: national health ministries in Brazil and Saudi Arabia now require electrophoresis confirmation for hemoglobinopathy newborn screening, establishing a foothold for future platform upgrades.
- Agilent Technologies
- Bio-Rad Laboratories
- Thermo Fisher Scientific
- Danaher (Cytiva & Beckman Coulter)
- Merck
- GE Healthcare
- PerkinElmer
- QIAGEN
- Lonza Group Ltd.
- Shimadzu
- Sebia
- SCIEX
- Helena Laboratories
- Cleaver Scientific Ltd.
- Analytik Jena
- Lumex Instruments
- Consort NV
- Bio-Techne (ProteinSimple)
- Hitachi High-Tech Corp.
- Creative Diagnostics
Additional Benefits:
- The market estimate (ME) sheet in Excel format
- 3 months of analyst support
TABLE OF CONTENTS
1 Introduction
- 1.1 Study Assumptions & Market Definition
- 1.2 Scope of the Study
2 Research Methodology
3 Executive Summary
4 Market Landscape
- 4.1 Market Overview
- 4.2 Market Drivers
- 4.2.1 Accelerating Biopharmaceutical Research and Development Expenditure
- 4.2.2 Growing Adoption of Personalized Medicine and Genomic Diagnostics
- 4.2.3 Expansion of Academic and Contract Research Infrastructure Worldwide
- 4.2.4 Rising Demand for High-Throughput Quality Control in Biologics Manufacturing
- 4.2.5 Increasing Government Funding for Molecular Biology Education Programs In Emerging Economies
- 4.2.6 Convergence of Electrophoresis With Microfluidics and Automation Platforms
- 4.3 Market Restraints
- 4.3.1 High Capital and Operating Costs of Advanced Electrophoresis Systems
- 4.3.2 Competition from Alternative Separation Technologies Such as LC-MS
- 4.3.3 Limited Skilled Workforce for Complex Data Interpretation in Developing Regions
- 4.3.4 Vulnerabilities in Supply Of Critical High-Purity Reagents and Consumables
- 4.4 Regulatory Landscape
- 4.5 Porter's Five Forces Analysis
- 4.5.1 Threat of New Entrants
- 4.5.2 Bargaining Power of Buyers
- 4.5.3 Bargaining Power of Suppliers
- 4.5.4 Threat of Substitutes
- 4.5.5 Intensity of Rivalry
5 Market Size & Growth Forecasts (Value, USD)
- 5.1 By Product
- 5.1.1 Systems
- 5.1.1.1 Gel Electrophoresis Systems
- 5.1.1.2 Capillary Electrophoresis Systems
- 5.1.1.3 Microfluidic Electrophoresis Systems
- 5.1.2 Reagents & Consumables
- 5.1.2.1 Gels & Buffers
- 5.1.2.2 Stains & Dyes
- 5.1.2.3 Membranes & Blotting Media
- 5.1.2.4 Molecular Weight Standards & Ladders
- 5.1.3 Software & Imaging Solutions
- 5.1.3.1 Gel Documentation & Analysis Software
- 5.1.3.2 CE Data Analysis Platforms
- 5.1.3.3 AI-Driven Automation Suites
- 5.1.1 Systems
- 5.2 By Application
- 5.2.1 Genomics (DNA/RNA Analysis)
- 5.2.2 Proteomics (Protein Characterization)
- 5.2.3 Clinical Diagnostics
- 5.2.4 Quality Control & Process Validation
- 5.3 By Workflow Stage
- 5.3.1 Sample Preparation & Loading
- 5.3.2 Separation & Fractionation
- 5.3.3 Visualization, Imaging & Data Analysis
- 5.4 By End-User
- 5.4.1 Academic & Research Institutes
- 5.4.2 Hospitals & Diagnostic Centers
- 5.4.3 Pharmaceutical & Biotechnology Companies
- 5.5 Geography
- 5.5.1 North America
- 5.5.1.1 United States
- 5.5.1.2 Canada
- 5.5.1.3 Mexico
- 5.5.2 Europe
- 5.5.2.1 Germany
- 5.5.2.2 United Kingdom
- 5.5.2.3 France
- 5.5.2.4 Italy
- 5.5.2.5 Spain
- 5.5.2.6 Rest of Europe
- 5.5.3 Asia-Pacific
- 5.5.3.1 China
- 5.5.3.2 Japan
- 5.5.3.3 India
- 5.5.3.4 Australia
- 5.5.3.5 South Korea
- 5.5.3.6 Rest of Asia-Pacific
- 5.5.4 Middle East & Africa
- 5.5.4.1 GCC
- 5.5.4.2 South Africa
- 5.5.4.3 Rest of Middle East & Africa
- 5.5.5 South America
- 5.5.5.1 Brazil
- 5.5.5.2 Argentina
- 5.5.5.3 Rest of South America
- 5.5.1 North America
6 Competitive Landscape
- 6.1 Market Concentration
- 6.2 Market Share Analysis
- 6.3 Company Profiles (includes Global level Overview, Market level overview, Core Business Segments, Financials, Headcount, Key Information, Market Rank, Market Share, Products and Services, and analysis of Recent Developments)
- 6.3.1 Agilent Technologies Inc.
- 6.3.2 Bio-Rad Laboratories Inc.
- 6.3.3 Thermo Fisher Scientific Inc.
- 6.3.4 Danaher (Cytiva & Beckman Coulter)
- 6.3.5 Merck KGaA (Millipore Sigma)
- 6.3.6 GE Healthcare
- 6.3.7 PerkinElmer Inc.
- 6.3.8 QIAGEN N.V.
- 6.3.9 Lonza Group Ltd.
- 6.3.10 Shimadzu Corporation
- 6.3.11 Sebia Group
- 6.3.12 SCIEX
- 6.3.13 Helena Laboratories
- 6.3.14 Cleaver Scientific Ltd.
- 6.3.15 Analytik Jena AG
- 6.3.16 Lumex Instruments
- 6.3.17 Consort NV
- 6.3.18 Bio-Techne (ProteinSimple)
- 6.3.19 Hitachi High-Tech Corp.
- 6.3.20 Creative Diagnostics
7 Market Opportunities & Future Outlook
- 7.1 White-space & Unmet-need Assessment


