

|
시장보고서
상품코드
2123713
스마트 디스플레이 시장 : 시장 점유율 분석, 업계 동향 및 통계, 성장 예측(2026-2031년)Smart Display - Market Share Analysis, Industry Trends & Statistics, Growth Forecasts (2026 - 2031) |
||||||
 Mordor Intelligence
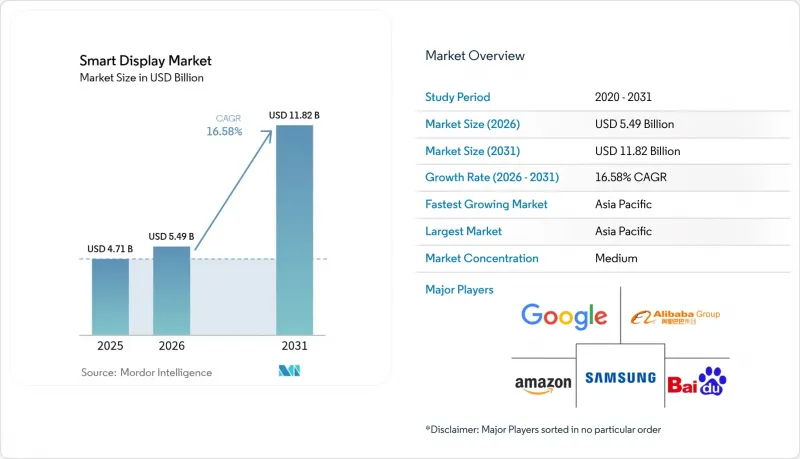
Mordor Intelligence에 의하면, 2026년 스마트 디스플레이 시장 규모는 54억 9,000만 달러로 추정되고, 2025년 47억 1,000만 달러에서 확대해, 2031년에는 118억 2,000만 달러에 이를 것으로 예측됩니다.
2026-2031년 연평균 성장률(CAGR)은 16.58%가 될 것으로 전망됩니다.
본 보고서는 음성 어시스턴트별(Amazon Alexa, 기타), 화면 크기별(5-10인치, 기타), 디스플레이 기술별(LCD, 기타), 해상도별(풀 HD, 기타), 설치 형태별(독립형, 기타), 연결 방식별(Wi-Fi 전용, 기타), 최종 사용자 산업별(자동차, 기타), 지역별(북미, 기타)로 분류되어 있습니다. 시장 예측은 금액(달러) 기준으로 제시되어 있습니다.
세계의 스마트 디스플레이 시장 동향 및 인사이트
북미의 다중 모드 ‘음성 우선’형 스마트 홈 허브 보급 확대
스마트 디스플레이는 단일 인터페이스를 통해 조명, 보안, 엔터테인먼트 시스템을 통합적으로 제어하는 시각과 음성을 융합한 하이브리드형으로 진화하고 있습니다. 음성 어시스턴트의 보급률은 2026년까지 미국에서 1억 5,710만 명에 달할 것으로 예상되며, 이에 따라 보다 정교한 명령을 처리하고 상황에 맞는 시각 정보를 제공하는 기기로의 업그레이드가 촉진되고 있습니다. 생성형 AI를 통해 출퇴근 데이터를 바탕으로 온도 조절기를 미리 예열하는 등 선제적인 제안을 할 수 있게 되면서, 제품의 가치에 대한 인식이 높아지고 있습니다. 삼성의 ‘Vision AI’를 탑재한 디스플레이는 2024년 해당 회사가 프리미엄 카테고리 출하량의 28.3%를 차지하는 데 기여했습니다. 소매업체들은 디스플레이와 구독 서비스를 세트로 판매하고 있으며, 이를 통해 지속적인 수익과 고객 유지율을 높이고 있습니다. 애플이 첫 스마트 홈 디스플레이를 준비 중이어서 경쟁이 치열해지고 있으며, 생태계를 구성하는 각 기업은 매년 라인업을 쇄신해야 하는 압박을 받고 있습니다.
Matter 호환 기기의 보급이 플랫폼 간 상호 운용성을 가속화
Matter 1.4에서는 Wi-Fi와 Thread를 통합한 인증 홈 라우터가 도입되어, 설정 시 오류가 대폭 감소하고 설치 작업 시간도 단축되었습니다. 2025년 중반까지 1,000종 이상의 Matter 인증 제품이 출시될 것으로 예상되며, 소비자는 락인(lock-in)을 걱정하지 않고 서로 다른 브랜드의 제품을 조합하여 사용할 수 있게 될 것입니다. 기업들은 이 프로토콜의 안전한 도입 과정을 제로 트러스트(Zero Trust) 요건을 충족하기 위한 첫걸음으로 간주하고 있으며, 이것이 상업 부문에서의 더 광범위한 도입을 뒷받침하고 있습니다. 유틸리티자들은 수요 반응 프로그램을 지원하기 위해 Matter 기반 에너지 대시보드 도입을 검토하고 있습니다. 또한, 이 표준은 기존 Wi-Fi 인프라를 활용하여 배선 공사 없이 Thread 경계 라우터를 호스팅할 수 있기 때문에 호텔 및 레저 산업에서 기존 설비를 개조할 기회도 창출하고 있습니다.
상시 켜져 있는 마이크의 보안 취약성으로 인한 B2B 조달 지연
금융 기관과 병원에서는 공급업체가 데이터 채널을 문서화하고 기기 상의 처리가 충분함을 입증할 때까지 도입을 일시 중단하고 있습니다. CISO가 ISO 27001 요건에 따른 침투 테스트를 요구함에 따라 조달 주기가 최대 45일까지 길어지고 있습니다. Matter의 옵션인 오프라인 모드는 우려 사항 중 일부를 완화하지만, 기기 통합 관리를 복잡하게 만들기 때문에 비용과 통합의 복잡성을 증가시키는 하이브리드 아키텍처에 대한 수요가 발생하고 있습니다. FedRAMP와 동등한 인증을 획득한 공급업체는 더 신속하게 계약을 따내고 있으며, 선점 우위를 확보하고 있습니다.
부문 분석
음성 어시스턴트가 탑재된 스마트 디스플레이 시장 규모는 2025년에 41억 8,000만 달러에 달했습니다. Amazon Alexa는 Fire TV 및 Ring을 통한 교차 판매의 기세를 타고 2025년에 33.12%의 시장 점유율을 차지했습니다. 구글 어시스턴트는 네스트 허브(Nest Hub)를 통해 그 뒤를 이었으며, 한편 알리바바의 티몰 지니(Tmall Genie)는 중국 방언에 맞추어 컨텐츠를 현지화하는 AI 챗봇 통합에 힘입어 연평균 성장률(CAGR) 18.38%로 성장했습니다. 음성 어시스턴트가 탑재된 스마트 디스플레이 시장 규모는 2025년에 41억 8,000만 달러에 달했으며, 생성형 모델을 통해 과거 대화 내역을 기억할 수 있게 됨에 따라 교체 수요가 증가하고 있습니다. 애플이 2025년 3월에 발표한 6인치 ‘홈 디스플레이’는 새로운 경쟁의 시작을 알리고 있으며, iOS 사용자 가구를 홈킷(HomeKit) 생태계로 끌어들이는 계기가 될 가능성이 있습니다.
표준 중국어에 최적화된 대규모 언어 모델의 지속적인 확대로 인해, 중국 내 알렉사(Alexa)의 우위는 서서히 약화되고 있습니다. 중국에서는 바이두(Baidu)의 듀어OS(DuerOS)가 모바일 스마트 스크린 시장의 41.1%를 차지하고 있으나, 이는 10.3% 감소한 수치입니다. 각 브랜드는 시각 검색, 유아용 안전 모드, QR 코드 결제를 연동한 다중 모드 쇼핑 카트 등을 통해 타사와의 차별화를 꾀하고 있습니다. 이러한 움직임은 Matter가 연결성 통합을 모색하고 있는 반면, 스마트 디스플레이 시장이 지역별 특화된 경험층으로 세분화되고 있음을 보여줍니다.
2025년에는 5-10인치 카테고리가 매출의 52.10%를 차지하며 시장을 휩쓸었습니다. 이는 설치 공간과 시청 편의성의 균형이 잘 잡혀 있기 때문입니다. 요리 레시피, 침실 알람, 책상에서의 화상 통화 등은 주로 이 대각선 크기에 적합하며, BOM 비용을 낮게 억제하고 있습니다. 한편, 소매점, 병원, 자동차 대시보드 등에서 더욱 풍부한 시각적 효과가 요구됨에 따라 10인치 이상과 부문은 연평균 성장률(CAGR) 18.92%로 확대되고 있습니다. 더 넓은 패널은 화상 채팅과 스마트 홈 대시보드를 동시에 표시할 수 있는 분할 화면 모드를 가능하게 하여 사용자 참여 지표를 향상시키고 있습니다.
대각선 길이가 10인치를 초과하면 평균 판매 가격이 급등하여 제조업체의 이익률을 높여줍니다. 이 부문에서는 OLED 보급률이 높아, 스마트 디스플레이 시장이 프리미엄 가격대를 확립하는 데 기여하고 있습니다. 패널 제조업체들은 대형 화면 수요의 급증에 대응하기 위해 생산 능력을 Gen 8.6 유리 기판으로 전환하고 있습니다. 한편, 5인치 이하 기기는 저가대 틈새 시장이나 침대 옆 용도로만 사용되고 있지만, 이미 소형 화면에서 알림 기능을 담당하고 있는 웨어러블 기기와의 경쟁으로 인해 스마트 디스플레이 시장 내 점유율은 축소되고 있습니다.
LCD는 성숙한 공급망과 경쟁적인 가격 책정 덕분에 2025년에도 81.05%의 점유율을 유지했습니다. 자동차 계기판에서는 열 안정성과 높은 밝기 덕분에 LTPS LCD가 선호되는 경향이 있습니다. 그러나 각 벤더들이 OLED의 깊은 흑색과 유연성을 활용하여 곡면 및 롤러블 폼 팩터를 구현하고 있기 때문에 OLED의 연평균 성장률(CAGR)은 21.35%로 가속화되고 있습니다. 고급 호텔의 스마트 미러에서는 반사 유리를 통해 비활성 상태의 디스플레이를 가리기 위해 OLED 라미네이트가 채택되어, 더 높은 ARPU를 실현하고 있습니다.
OLED 기반 스마트 디스플레이 시장 규모는 한국과 중국의 6세대 연성 제조 공장 가동에 힘입어 2031년까지 34억 2,000만 달러를 넘어설 것으로 예측됩니다. MicroLED에 대한 조사에서는 더욱 높은 밝기와 수명이 기대되며, 인쇄 전사 기술도 비용 목표에 가까워지고 있습니다. 각 제조업체는 단일 기술에 대한 의존 위험을 회피하기 위해, 특허 상호 라이선싱 및 패널 포트폴리오 다각화를 통해 리스크 헤지를 도모하고 있습니다.
지역별 분석
아시아태평양은 2025년 매출 점유율 37.42%로 스마트 디스플레이 시장을 주도했으며, 2031년까지 연평균 성장률(CAGR) 17.05%로 성장할 것으로 전망됩니다. 바이두(Baidu)와 알리바바(Alibaba)와 같은 중국 벤더들은 2024년 스마트 스피커 출하량이 25.6% 감소한 데 대응하여, 디스플레이에 대규모 언어 모델(LLM)을 통합함으로써 가치 제안을 혁신했습니다. 정부가 지원하는 AI 칩 개발 노력 덕분에 부품 원가(BOM)가 낮아져 100달러 미만의 대형 화면 모델 출시가 가능해졌으며, 이에 따라 지방 지역으로의 보급이 확대되고 있습니다. 한국 브랜드들은 OLED 혁신에 주력하고 있으며, 현지 패널 생태계를 활용하여 지역 전체에 프리미엄 모델을 수출하고 있습니다.
북미는 광대역이 거의 보편화되었고 음성 비서 채택률도 높아 여전히 기술 동향의 선구자적 지위를 유지하고 있습니다. 가정에서는 1세대 스마트 스피커를 우수한 마이크와 엣지 AI를 탑재한 Matter 지원 모델로 교체하는 추세가 주류를 이루고 있으며, 이것이 성장의 원동력이 되고 있습니다. 아마존은 미국 스마트 스피커 시장에서 29%의 점유율을 유지하고 있으며, 알렉사(Alexa)에 생성형 AI 기능을 업그레이드함으로써 더 큰 크기의 에코 쇼(Echo Show) 모델로의 업셀링을 촉진하고 있습니다. 애플이 2025년에 시장에 진입하면, 부유층 iOS 사용자층의 일부를 끌어모아 벤더 순위에 재편을 가져올 가능성이 있습니다.
유럽에서는 개인정보 보호와 지속가능성이 중시되고 있어, 기기 내 처리 기능이나 재활용 소재를 채택한 제품에 대한 수요가 촉진되고 있습니다. 유럽의 스마트 홈 시장은 2024년에 221억 1,000만 달러에 달했으며, 향후 시행될 에코디자인 규정에 따라 의무화되는 에너지 관리 기능으로 인해 소비량을 모니터링하는 Matter 인증 허브로의 조달이 진행되고 있습니다. 북유럽 국가에서는 음성 어시스턴트의 언어 지원 부족으로 인해 보급이 지연되고 있으나, 규제의 명확화와 에너지 절약 개조에 대한 보조금으로 인해 잠재적 수요가 유발될 것으로 예측됩니다. 남미, 중동 및 아프리카의 신흥 지역에서는 스마트폰 OEM 업체들이 생태계 정착을 촉진하기 위해 소형 스크린을 번들로 제공하고 있어 점차 보급이 확대되고 있으나, 가격에 대한 민감도와 불안정한 통신 환경이 판매량 증가를 억제하고 있습니다.
기타 혜택
- 엑셀 형식 시장 예측(ME) 시트
- 3개월간의 애널리스트 지원
자주 묻는 질문
목차
제1장 서론
제2장 조사 방법
제3장 주요 요약
제4장 시장 구도
제5장 산업 생태계 분석
제6장 기술 전망
제7장 Porter's Five Forces 분석
제8장 시장 규모 및 성장 예측
제9장 경쟁 구도
제10장 시장 기회 및 향후 전망
AJY 26.09.11According to Mordor Intelligence, smart display market size in 2026 is estimated at USD 5.49 billion, growing from 2025 value of USD 4.71 billion with 2031 projections showing USD 11.82 billion, growing at 16.58% CAGR over 2026-2031.
This report is Segmented by Voice Assistant (Amazon Alexa, and More), Screen Size (5 - 10 Inches, and More), Display Technology (LCD, and More), Resolution (Full HD, and More), Installation Type (Stand-Alone, and More), Connectivity (Wi-Fi Only, and More), End-User Industry (Automotive, and More), and Geography (North America, and More). The Market Forecasts are Provided in Terms of Value (USD).
Global Smart Display Market Trends and Insights
Rising adoption of multimodal voice-first smart-home hubs in North America
Smart displays are evolving into visual-voice hybrids that orchestrate lighting, security, and entertainment systems from a single interface. Voice-assistant penetration is expected to reach 157.1 million U.S. users by 2026, underpinning device upgrades that handle richer commands and provide contextual visuals. Generative AI is enabling proactive suggestions-such as pre-warming thermostats based on commute data-raising perceived value. Samsung's Vision AI-equipped displays helped the company capture 28.3% of premium category shipments in 2024. Retailers are bundling displays with subscription services, driving recurring revenue and stickiness. Competitive intensity is heightening as Apple prepares its first smart home display, prompting ecosystem players to refresh line-ups annually.
Proliferation of Matter-compliant devices accelerating platform interoperability
Matter 1.4 introduced certified home routers that unify Wi-Fi and Thread, slashing onboarding failures and cutting installer time. By mid-2025 more than 1,000 Matter-certified products are expected, giving consumers confidence to mix brands without fearing lock-in. Enterprises view the protocol's secure commissioning as a step toward meeting zero-trust mandates, encouraging broader commercial rollouts. Utilities are exploring Matter-based energy dashboards to support demand-response programs. The standard also unlocks retrofit opportunities in hospitality, where existing Wi-Fi infrastructure can host Thread border routers without rewiring.
Security vulnerabilities in always-on microphones causing B2B procurement delays
Financial institutions and hospitals are pausing deployments until vendors document data pathways and prove on-device processing sufficiency. Procurement cycles have stretched by up to 45 days as CISOs demand penetration tests aligned with ISO 27001 requirements. Matter's optional offline mode eases some concerns but complicates central device management, prompting requests for hybrid architectures that add cost and integration complexity. Vendors that achieve FedRAMP-equivalent attestations are winning contracts faster, creating early-mover advantages.
Other drivers and restraints analyzed in the detailed report include:
- Automotive OEM integration of smart mirrors and pillar-to-pillar cockpit displays
- AI-powered contextual UI driving premium price mix in more than 10-inch category
- Persistent panel shortage in 8-10-inch LCD fabs limiting supply elasticity
For complete list of drivers and restraints, kindly check the Table Of Contents.
Segment Analysis
The smart display market size for voice-assistant devices reached USD 4.18 billion in 2025. Amazon Alexa held 33.12% market share in 2025, riding cross-sell momentum from Fire TV and Ring. Google Assistant followed through Nest hubs, while Alibaba's TmallGenie grew at 18.38% CAGR, buoyed by AI chatbot integration that localizes content for Chinese dialects. The smart display market size for voice-assistant devices reached USD 4.18 billion in 2025, and replacement demand is strengthening as generative models enable memory of prior conversations. Apple's March 2025 six-inch Home Display announcement signals fresh competition that may draw iOS households into its HomeKit universe.
Continued expansion of Mandarin-optimized large language models is eroding Alexa's edge in China, where Baidu DuerOS controlled 41.1% of mobile smart screens despite a 10.3 percentage-point decline. Brands are differentiating via visual search, kid-safe modes, and multimodal shopping carts that link QR-based checkout. These moves illustrate how the smart display market is fragmenting into region-specific experience layers even as Matter attempts to harmonize connectivity.
The 5-10-inch category dominated with 52.10% revenue in 2025 because it balances countertop space and viewing comfort. Kitchen recipes, bedroom alarms, and desk video calls mostly fit this diagonal, keeping BOM costs low. Yet the >10-inch cohort is expanding at a 18.92% CAGR as retailers, hospitals, and vehicle dashboards demand richer visuals. Wider panels invite split-screen modes for simultaneous video chats and smart-home dashboards, elevating user engagement metrics.
Average selling prices jump when diagonal exceeds 10 inches, improving manufacturer margins. OLED penetration is higher in this tier, helping the smart display market command premium price points. Panel makers are shifting capacity toward Gen 8.6 glass substrates to serve the large-format rush. Meanwhile, <5-inch devices remain in budget niches and as bedside companions, but their slice of the smart display market is shrinking under competition from wearables that already occupy the small-screen notification role.
LCD retained 81.05% share in 2025, thanks to mature supply chains and competitive pricing. Automotive instrument clusters often favor LTPS LCD for thermal stability and brightness. However, OLED's 21.35% CAGR is accelerating as vendors exploit its deep blacks and flexibility to fashion curved or rollable form factors. Smart mirrors in luxury hotels use OLED laminates to hide inactive displays behind reflective glass, commanding higher ARPU.
The smart display market size for OLED-based units is forecast to exceed USD 3.42 billion by 2031, aided by Gen 6 flexible fabs in South Korea and China. MicroLED research promises even higher luminance and lifespan, with printed transfer techniques edging closer to cost targets. Manufacturers are hedging by cross-licensing patents and mixing panel portfolios to avoid single-technology risk.
Complete Report Scope:
- By Voice Assistant
- Amazon Alexa
- Google Assistant
- Baidu DuerOS
- Alibaba TmallGenie
- Apple Siri
- Others
- By Screen Size
- Less than 5 Inches
- 5 - 10 Inches
- Above 10 Inches
- By Display Technology
- LCD
- OLED
- Others (Micro-LED, E-Paper)
- By Resolution
- HD (= 720p)
- Full HD (1080p)
- 4K and Above
- By Installation Type
- Stand-alone Smart Displays
- Integrated Smart Displays (smart mirrors, kiosk, shelf-edge)
- By Connectivity
- Wi-Fi Only
- Wi-Fi + Cellular
- Wi-Fi + Zigbee/Thread/Matter
- By End-user Industry
- Residential Smart Home
- Automotive
- Retail and Hospitality
- Healthcare
- Corporate and Education
- Others (Transportation Hubs, Public Sector)
- By Geography
- North America
- United States
- Canada
- Mexico
- Europe
- Germany
- United Kingdom
- France
- Italy
- Spain
- Nordics (Denmark, Sweden, Norway, Finland)
- Rest of Europe
- Asia-Pacific
- China
- Japan
- South Korea
- India
- Southeast Asia
- Australia
- Rest of Asia-Pacific
- South America
- Brazil
- Argentina
- Rest of South America
- Middle East
- Gulf Cooperation Council Countries
- Turkey
- Rest of Middle East
- Africa
- South Africa
- Nigeria
- Rest of Africa
- North America
Geography Analysis
Asia Pacific led the smart display market with 37.42% revenue share in 2025 and is set to compound at 17.05% CAGR through 2031. Chinese vendors such as Baidu and Alibaba responded to a 25.6% slump in 2024 smart-speaker shipments by layering large language models onto displays, resetting value propositions. Government-backed AI chip initiatives are lowering BOM costs, enabling sub-USD 100 large-screen models that widen rural penetration. South Korean brands focus on OLED innovation, leveraging local panel ecosystems to export premium units across the region.
North America remains a technology trendsetter with near-ubiquitous broadband and high voice-assistant uptake. Replacement cycles dominate growth as households swap first-generation screens for Matter-capable variants with superior microphones and edge AI. Amazon retained 29% of U.S. smart-speaker units, rolling out generative AI upgrades to Alexa that encourage upsells to larger Echo Show models. Apple's 2025 entry could lure a slice of the affluent iOS base, reshuffling vendor rankings.
Europe emphasizes privacy and sustainability, stimulating demand for devices with on-device processing and recycled materials. The European Smart Home market reached USD 22.11 billion in 2024, and energy-management features mandated by upcoming Ecodesign rules are steering procurement toward Matter-certified hubs that monitor consumption. Nordic adoption lags owing to voice-assistant language gaps, but regulatory clarity and subsidies for energy retrofits are expected to unlock latent demand. Emerging regions in South America, the Middle East, and Africa witness gradual uptake as smartphone OEMs bundle smaller screens to drive ecosystem stickiness, although price sensitivity and patchy connectivity temper volumes.
- Amazon.com Inc.
- Google LLC
- Baidu Inc.
- Alibaba Group Holding Ltd.
- Xiaomi Corp.
- Lenovo Group Ltd.
- LG Electronics Inc.
- Samsung Electronics Co., Ltd.
- Meta Platforms Inc. (Portal)
- Sony Corp.
- TCL Tech. Group
- Hisense Group
- Sharp Corp.
- Koninklijke Philips N.V.
- Panasonic Holdings Corp.
- Huawei Tech. Co. Ltd.
- BOE Technology Group Co. Ltd.
- Vizio Inc.
- JBL (Harman Int'l)
- Apple Inc.
Additional Benefits:
- The market estimate (ME) sheet in Excel format
- 3 months of analyst support
TABLE OF CONTENTS
1 INTRODUCTION
- 1.1 Study Assumptions and Market Definition
- 1.2 Scope of the Study
2 RESEARCH METHODOLOGY
3 EXECUTIVE SUMMARY
4 MARKET LANDSCAPE
- 4.1 Market Overview
- 4.2 Market Drivers
- 4.2.1 Rising adoption of multimodal voice-first smart-home hubs in North America
- 4.2.2 Proliferation of Matter-compliant devices accelerating platform interoperability
- 4.2.3 Automotive OEM integration of smart mirrors and pillar-to-pillar cockpit displays
- 4.2.4 AI-powered contextual UI driving premium price mix in Above 10-inch category, Asia-led
- 4.2.5 Retail demand for frictionless checkout and dynamic shelf-edge signage
- 4.2.6 Hospital bedside smart terminals improving patient engagement and HCAHPS scores
- 4.3 Market Restraints
- 4.3.1 Security vulnerabilities in always-on microphones causing B2B procurement delays
- 4.3.2 Persistent panel shortage in 8-10-inch LCD fabs limiting supply elasticity
- 4.3.3 Fragmented regional data-privacy mandates raising localisation costs
- 4.3.4 Voice-assistant language support gaps curbing uptake across Nordics and Caribbeans
5 INDUSTRY ECOSYSTEM ANALYSIS
6 TECHNOLOGICAL OUTLOOK
7 PORTER'S FIVE FORCES ANALYSIS
- 7.1 Porter's Five Forces
- 7.1.1 Bargaining Power of Suppliers
- 7.1.2 Bargaining Power of Buyers
- 7.1.3 Threat of New Entrants
- 7.1.4 Threat of Substitutes
- 7.1.5 Intensity of Competitive Rivalry
8 MARKET SIZE AND GROWTH FORECASTS (VALUES)
- 8.1 By Voice Assistant
- 8.1.1 Amazon Alexa
- 8.1.2 Google Assistant
- 8.1.3 Baidu DuerOS
- 8.1.4 Alibaba TmallGenie
- 8.1.5 Apple Siri
- 8.1.6 Others
- 8.2 By Screen Size
- 8.2.1 Less than 5 Inches
- 8.2.2 5 - 10 Inches
- 8.2.3 Above 10 Inches
- 8.3 By Display Technology
- 8.3.1 LCD
- 8.3.2 OLED
- 8.3.3 Others (Micro-LED, E-Paper)
- 8.4 By Resolution
- 8.4.1 HD (= 720p)
- 8.4.2 Full HD (1080p)
- 8.4.3 4K and Above
- 8.5 By Installation Type
- 8.5.1 Stand-alone Smart Displays
- 8.5.2 Integrated Smart Displays (smart mirrors, kiosk, shelf-edge)
- 8.6 By Connectivity
- 8.6.1 Wi-Fi Only
- 8.6.2 Wi-Fi + Cellular
- 8.6.3 Wi-Fi + Zigbee/Thread/Matter
- 8.7 By End-user Industry
- 8.7.1 Residential Smart Home
- 8.7.2 Automotive
- 8.7.3 Retail and Hospitality
- 8.7.4 Healthcare
- 8.7.5 Corporate and Education
- 8.7.6 Others (Transportation Hubs, Public Sector)
- 8.8 By Geography
- 8.8.1 North America
- 8.8.1.1 United States
- 8.8.1.2 Canada
- 8.8.1.3 Mexico
- 8.8.2 Europe
- 8.8.2.1 Germany
- 8.8.2.2 United Kingdom
- 8.8.2.3 France
- 8.8.2.4 Italy
- 8.8.2.5 Spain
- 8.8.2.6 Nordics (Denmark, Sweden, Norway, Finland)
- 8.8.2.7 Rest of Europe
- 8.8.3 Asia-Pacific
- 8.8.3.1 China
- 8.8.3.2 Japan
- 8.8.3.3 South Korea
- 8.8.3.4 India
- 8.8.3.5 Southeast Asia
- 8.8.3.6 Australia
- 8.8.3.7 Rest of Asia-Pacific
- 8.8.4 South America
- 8.8.4.1 Brazil
- 8.8.4.2 Argentina
- 8.8.4.3 Rest of South America
- 8.8.5 Middle East
- 8.8.5.1 Gulf Cooperation Council Countries
- 8.8.5.2 Turkey
- 8.8.5.3 Rest of Middle East
- 8.8.6 Africa
- 8.8.6.1 South Africa
- 8.8.6.2 Nigeria
- 8.8.6.3 Rest of Africa
- 8.8.1 North America
9 COMPETITIVE LANDSCAPE
- 9.1 Market Concentration
- 9.2 Strategic Moves
- 9.3 Market Share Analysis
- 9.4 Company Profiles (includes Global level Overview, Market level overview, Core Segments, Financials as available, Strategic Information, Market Rank/Share for key companies, Products and Services, and Recent Developments)
- 9.4.1 Amazon.com Inc.
- 9.4.2 Google LLC
- 9.4.3 Baidu Inc.
- 9.4.4 Alibaba Group Holding Ltd.
- 9.4.5 Xiaomi Corp.
- 9.4.6 Lenovo Group Ltd.
- 9.4.7 LG Electronics Inc.
- 9.4.8 Samsung Electronics Co., Ltd.
- 9.4.9 Meta Platforms Inc. (Portal)
- 9.4.10 Sony Corp.
- 9.4.11 TCL Tech. Group
- 9.4.12 Hisense Group
- 9.4.13 Sharp Corp.
- 9.4.14 Koninklijke Philips N.V.
- 9.4.15 Panasonic Holdings Corp.
- 9.4.16 Huawei Tech. Co. Ltd.
- 9.4.17 BOE Technology Group Co. Ltd.
- 9.4.18 Vizio Inc.
- 9.4.19 JBL (Harman Int'l)
- 9.4.20 Apple Inc.
10 MARKET OPPORTUNITIES AND FUTURE OUTLOOK
- 10.1 White-space and Unmet-Need Assessment


