

|
시장보고서
상품코드
2123715
광학 현미경 시장 : 시장 점유율 분석, 업계 동향 및 통계, 성장 예측(2026-2031년)Optical Microscopes - Market Share Analysis, Industry Trends & Statistics, Growth Forecasts (2026 - 2031) |
||||||
 Mordor Intelligence
Mordor Intelligence에 의하면, 광학 현미경 시장 규모는 2025년 29억 2,000만 달러로 평가되었고, 2026년에는 30억 8,000만 달러로 추정되고, 2031년까지 40억 5,000만 달러에 이를 것으로 예상되며, 2026-2031년 CAGR 5.62%로 성장할 전망입니다.
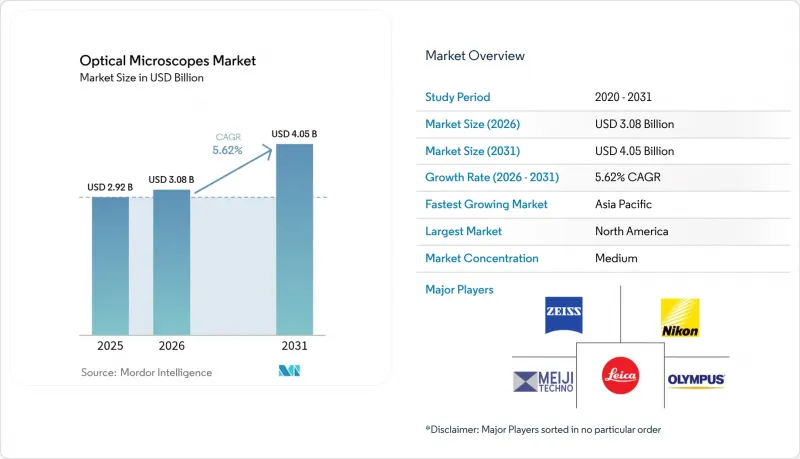
본 보고서는 제품별(복합 현미경, 실체 현미경, 디지털 현미경, 역상 현미경, 기타), 최종 사용자별(병원 및 클리닉, 학술·연구 기관, 진단 검사 기관, 제약·바이오기술 기업, 기타), 지역별(북미, 유럽, 아시아태평양, 기타)로 분류되어 있습니다. 시장 전망은 금액(달러) 기준으로 제시되어 있습니다.
세계의 광학 현미경 시장 동향 및 인사이트
생명과학 분야의 연구 개발(R&D)에 대한 자금 지원 증가
각국의 예산은 광학 현미경 시장에 견고한 지지력을 제공합니다. 미국은 2025년에 국립보건원(NIH)에 486억 달러를 배정했으며, 그 중 12%가 첨단 이미징 시스템을 많이 사용하는 공유 장비에 할당되었습니다. 또한 ‘Horizon Europe’은 같은 해 건강 연구를 위해 72억 유로(79억 달러)를 배정했으며, 모든 슬라이드 스캐너와 형광 현미경을 통합한 디지털 병리 네트워크를 우선순위로 삼고 있습니다. 일본의 생명과학 예산 1조 1,000억 엔(74억 달러)은 신경과학용 초해상도 플랫폼에 중점을 두고 있습니다. 생세포 및 재생의학 프로젝트는 환경 제어와 다중 채널 형광에 의존하기 때문에 역상 현미경과 공초점 현미경 시스템이 가장 많은 수주를 확보하고 있습니다. 조달 주기가 18-24개월이므로, 2025년에 수주된 장비는 2027년까지 공장 생산 라인을 가동하게 되어, 광학 현미경 시장을 단기적인 예산 변동의 영향으로부터 보호하게 될 것입니다.
디지털화와 AI를 활용한 영상 분석
현재 구매 기준을 좌우하는 요인은 광학 사양보다 머신러닝 알고리즘이 더 큰 비중을 차지하고 있습니다. 카이저는 2025년 초에 ‘Arivis Cloud’를 출시하여, 사용자가 온사이트 GPU 클러스터 없이도 테라바이트 규모의 데이터 세트를 처리할 수 있도록 했습니다. 연간 구독료는 5,000-25,000달러입니다. 니콘의 ‘NIS-Elements AI’는 제약 산업의 베타 검사에서 수동 세포 추적 시간을 85% 단축함으로써 하드웨어를 넘어서는 가치를 입증하고 있습니다. 매주 수백만 장의 이미지를 생성하는 제약 업계의 스크리닝 담당자들은 분석 기능이 통합된 플랫폼을 선호하고 있으며, 이는 광학 현미경 시장 전체에서 지속적인 수익 모델을 강화하고 있습니다. 2024년 FDA 지침에 따라 AI 기반 병리 소프트웨어의 규제 경로가 명확해지면서 검증 프로세스가 가속화되고 있습니다. 통신 환경이 제한적인 지역에서는 도입 현황에 편차가 나타나고 있으나, 전 세계적인 대역폭 확충으로 인해 이러한 격차는 점차 줄어들고 있습니다.
전자 현미경에 대한 해상도 격차
3nm 트랜지스터 검사에서 서브 nm 수준의 요구 사항으로 인해 전자 현미경이 여전히 우위를 점하고 있으며, 광학 벤더들은 직접적인 경쟁보다는 상호 연관된 워크플로우를 추진할 수밖에 없는 상황입니다. 2025년, 아시아에서는 1만 8,000대 이상의 전자현미경 시스템이 도입되었으며, 중국에서만 신규 도입 대수의 42%를 차지했습니다. 광학 플랫폼에서는 현재 SEM을 통한 확대 관찰에 앞서 광범위한 웨이퍼 영역을 신속하게 스크리닝하는 ‘트라이아지’가 중시되고 있으며, 이러한 접근 방식은 자이스의 ‘Shuttle &Find’ 소프트웨어에 구현되어 있습니다.
부문 분석
2025년, 역상 현미경은 광학 현미경 시장 점유율의 36.55%를 차지했습니다. 이는 배양 챔버 및 멀티웰 플레이트와의 호환성이 필요한 세포 배양 및 오가노이드 분석에서 역상 현미경이 중심적인 역할을 하고 있음을 반영합니다. 제약 연구자들은 지속적인 약물 반응 연구에서 환경 제어를 방해하지 않아야 하므로, 인버티드 현미경을 선호합니다. 디지털 및 옵토디지털 모델은 연평균 9.85%의 성장률을 기록하고 있으며, 4K 센서와 자동 초점 기능을 통합함으로써 경험이 부족한 사용자도 신속하게 데이터를 수집할 수 있게 되어 광학 현미경 시장 규모를 확대되고 있습니다.
또한, 디지털 설계는 접안 렌즈의 인체공학적 사용 편의성보다 피사계 심도의 스택 처리가 필요한 전자 기기 및 금속 산업의 품질 관리 기술자에게도 유용합니다. 복합 현미경과 실체 현미경은 교육 현장이나 자원이 제한된 클리닉에서는 여전히 주류를 이루고 있지만, 연결성의 제한으로 인해 첨단 연구실에서의 교체 속도는 둔화되고 있습니다. STED나 SIM과 같은 초해상도형 모델은 출하 대수는 적지만, 프리미엄 수익원이 되고 있습니다. 전반적으로 제품 동향은 ‘바벨 구조’를 보이고 있으며, 하이엔드 연구용 플랫폼과 저비용 교육용 기기가 모두 확대되는 반면, 기존 중급 정립형 시스템은 대체가 진행되고 있습니다.
지역별 분석
2025년, 북미는 전 세계 매출의 38.55%를 차지했으며, 캘리포니아주, 매사추세츠주, 뉴저지주에 밀집된 생명공학 클러스터가 주도적인 역할을 하고 있습니다. 이 지역에서는 AI 모듈 도입이 수명 주기 중반의 업그레이드를 촉진하고 있어, 교체 수요가 광학 현미경 시장의 견조한 성장세를 뒷받침하고 있습니다. 캐나다는 연방 정부의 연구 예산이 삭감되어 완만한 성장에 그치고 있지만, 멕시코는 공립 대학의 현대화에 따른 향후 수요 증가를 기대하고 있습니다.
그 뒤를 이어 유럽이 뒤따르고 있으며, 독일의 이미징 센터 네트워크가 주도적인 역할을 하고 있습니다. 그러나 브렉시트와 관련된 통관 지연으로 인해 영국에서는 총소유비용(TCO)이 상승하여 2025년 출하 대수가 억제되고 있습니다. ‘Horizon Europe’의 자금 지원으로 하락폭은 제한적이지만, 이탈리아와 스페인은 대학의 지출 삭감으로 인해 뒤처지고 있습니다. 시장 포화로 인해 각 벤더들은 물리적 수입 장벽 없이 수익을 확대할 수 있는 클라우드 소프트웨어 구독 서비스에 주력하고 있습니다.
아시아태평양은 연평균 성장률(CAGR) 8.12%로 확대되고 있으며, 2025년에 중국의 반도체 팹이 4,200대 이상의 광학 현미경을 구매한 것이 그 원동력이 되었습니다. 인도에서는 병리 검사 체인의 통합이 디지털화를 촉진하고 있으며, 한국과 호주는 나노기술 및 정밀의료 인프라에 투자하고 있습니다. 일본에서는 생명과학 분야 학생 수가 감소함에 따라 교체 주기가 장기화되고 있지만, 고부가가치 초고해상도 현미경의 수주는 계속해서 견조한 모습을 보이고 있습니다. 또한, 사우디아라비아와 아랍에미리트가 연구 대학을 건설하고 있는 중동 및 아프리카에서도 광학 현미경 시장이 확대되고 있으며, 남미에서는 장비 공유 기금을 통해 브라질을 성장의 중심지로 삼고 있습니다.
기타 혜택
- 엑셀 형식 시장 예측(ME) 시트
- 3개월간의 애널리스트 지원
자주 묻는 질문
목차
제1장 서론
제2장 조사 방법
제3장 주요 요약
제4장 시장 구도
제5장 시장 규모 및 성장 예측
제6장 경쟁 구도
제7장 시장 기회 및 향후 전망
AJY 26.09.11According to Mordor Intelligence, the optical microscopes market size is expected to increase from USD 2.92 billion in 2025 to USD 3.08 billion in 2026 and reach USD 4.05 billion by 2031, growing at a CAGR of 5.62% over 2026-2031.
This report is Segmented by Product (Compound Microscopes, Stereo Microscopes, Digital Microscopes, Inverted Microscopes, and More), End User (Hospitals & Clinics, Academic & Research Institutes, Diagnostic Laboratories, Pharmaceutical & Biotech Companies and More), and Geography (North America, Europe, Asia Pacific, and More). The Market Forecasts are Provided in Terms of Value (USD).
Global Optical Microscopes Market Trends and Insights
Rising Funding for Life-Science R&D
National budgets raise a durable floor under the optical microscopes market. The United States allocated USD 48.6 billion to the National Institutes of Health in 2025, with 12% flowing into shared instrumentation that heavily features advanced imaging suites. Horizon Europe set aside EUR 7.2 billion (USD 7.9 billion) for health research the same year, prioritizing digital pathology networks that integrate whole-slide scanners with fluorescence microscopes. Japan's JPY 1.1 trillion (USD 7.4 billion) life-science budget spotlights super-resolution platforms for neuroscience. Because live-cell and regenerative-medicine projects depend on environmental control and multichannel fluorescence, inverted and confocal systems see the largest purchase orders. Procurement cycles of 18-24 months mean instruments booked in 2025 keep factory lines active through 2027, insulating the optical microscopes market from near-term budget volatility.
Digitization and AI-Enabled Image Analytics
Machine-learning algorithms now shape buying criteria more than optical specifications. Zeiss rolled out the Arivis Cloud in early 2025, allowing users to process terabyte-scale datasets without onsite GPU clusters, and charges annual subscriptions of USD 5,000-25,000. Nikon's NIS-Elements AI cut manual cell-tracking time by 85% during pharmaceutical beta trials, underscoring value beyond hardware. Pharmaceutical screeners that generate millions of images weekly gravitate to platforms that bundle analytics, reinforcing recurring-revenue models across the optical microscopes market. FDA guidance from 2024 clarified the regulatory path for AI-driven pathology software, accelerating validation pipelines. Adoption remains uneven in connectivity-limited regions, yet global bandwidth upgrades are closing this gap.
Resolution Gap versus Electron Microscopy
Sub-nanometer demands in 3-nanometer transistor inspection keep electron microscopes ahead, pushing optical vendors to promote correlative workflows rather than direct competition. Asia installed more than 18,000 electron systems in 2025, and China alone captured 42% of new units. Optical platforms now emphasize triage, screening large wafer areas quickly before SEM zoom-in, an approach embodied in Zeiss Shuttle & Find software.
Other drivers and restraints analyzed in the detailed report include:
- Surge in Nanotechnology-Driven Demand
- Quantum-Dot and Adaptive-Optics Breakthroughs
- Price Erosion from Low-Cost Asian Brands
For complete list of drivers and restraints, kindly check the Table Of Contents.
Segment Analysis
Inverted microscopes captured 36.55% of the optical microscopes market share in 2025, reflecting their central role in cell-culture and organoid assays that require incubation chambers and multi-well plate compatibility. Pharmaceutical researchers prefer inverted formats because continuous drug-response studies demand undisturbed environmental control. Digital and opto-digital models, growing 9.85% annually, push the optical microscopes market size higher by integrating 4K sensors with autofocus routines that allow inexperienced users to collect data fast.
Digital designs also serve quality-control technicians in electronics and metals who need depth-of-field stacking rather than eyepiece ergonomics. Compound and stereo microscopes remain staples in education and low-resource clinics, yet their limited connectivity slows replacement in advanced labs. Super-resolution variants such as STED and SIM add premium revenue though ship in smaller volumes. Collectively, product dynamics reveal a barbell structure where high-end research platforms and low-cost education units both expand, while conventional mid-tier upright systems face substitution.
Complete Report Scope:
- By Product
- Compound Microscopes
- Stereo Microscopes
- Digital / Opto-Digital Microscopes
- Inverted Microscopes
- Fluorescence & Super-Resolution Systems
- Confocal & Multiphoton Microscopes
- By End User
- Hospitals & Clinics
- Academic & Research Institutes
- Diagnostic Laboratories
- Pharmaceutical & Biotechnology Companies
- Other End Users
- By Geography
- North America
- United States
- Canada
- Mexico
- Europe
- Germany
- United Kingdom
- France
- Italy
- Spain
- Rest of Europe
- Asia-Pacific
- China
- India
- Japan
- Australia
- South Korea
- Rest of Asia-Pacific
- Middle East and Africa
- GCC
- South Africa
- Rest of Middle East and Africa
- South America
- Brazil
- Argentina
- Rest of South America
- North America
Geography Analysis
North America accounted for 38.55% of global revenue in 2025, anchored by dense biotech clusters in California, Massachusetts, and New Jersey. The region's replacement sales keep the optical microscopes market robust as AI modules prompt mid-cycle upgrades. Canada grows modestly because federal research budgets tightened, while Mexico eyes future uptake tied to public-university modernization.
Europe follows, led by Germany's imaging-center network, yet Brexit-related customs delays raised total cost of ownership in the United Kingdom, curbing 2025 shipments. Horizon Europe funds limit downside, but Italy and Spain lag due to austerity in university spending. Market saturation pushes vendors to focus on cloud software subscriptions that add revenue without physical import hurdles.
Asia-Pacific advances at an 8.12% CAGR, paced by China's semiconductor fabs purchasing more than 4,200 optical microscopes in 2025. India's pathology-chain consolidation fuels digital adoption, and South Korea and Australia invest in nanotechnology and precision-medicine infrastructure. Japan sees longer replacement cycles as life-science enrollments decline, yet high-value super-resolution orders persist. The optical microscopes market also gains in Middle East and Africa where Saudi Arabia and the United Arab Emirates build research universities, while South America's growth clusters in Brazil through shared-instrument funds.
- Abberior Instruments
- Accu-Scope Inc.
- Agilent Technologies
- AmScope (United Scope)
- Bruker
- Carl Zeiss
- CoolLED Ltd.
- Dino-Lite (AnMo Electronics)
- Hamamatsu Photonics
- Hitachi High-Tech Corp.
- Jenoptik AG
- Keyence Corp.
- Labomed Inc.
- Danaher
- Lumencor Inc.
- Meiji Techno
- Motic Microscope
- Nikon Instruments
- Olympus
- OPTO-Tech
- PicoQuant
- Prior Scientific Instruments
- Thermo Fisher Scientific
- Thorlabs
Additional Benefits:
- The market estimate (ME) sheet in Excel format
- 3 months of analyst support
TABLE OF CONTENTS
1 Introduction
- 1.1 Study Assumptions & Market Definition
- 1.2 Scope of the Study
2 Research Methodology
3 Executive Summary
4 Market Landscape
- 4.1 Market Overview
- 4.2 Market Drivers
- 4.2.1 Rising funding for life-science R&D
- 4.2.2 Digitization & AI-enabled image analytics
- 4.2.3 Surge in nanotechnology-driven demand
- 4.2.4 Quantum-dot & adaptive-optics breakthroughs
- 4.2.5 Open-source hardware & 3-D-printed optics
- 4.2.6 Smartphone-linked field microscopes
- 4.3 Market Restraints
- 4.3.1 Resolution gap vs. electron microscopy
- 4.3.2 Price erosion from low-cost Asian brands
- 4.3.3 Sustainability rules on rare-earth / Hg
- 4.3.4 Precision-glass supply-chain fragility
- 4.4 Supply-Chain Analysis
- 4.5 Regulatory Landscape
- 4.6 Technological Outlook
- 4.7 Porter's Five Forces
- 4.7.1 Threat of New Entrants
- 4.7.2 Bargaining Power of Buyers
- 4.7.3 Bargaining Power of Suppliers
- 4.7.4 Threat of Substitutes
- 4.7.5 Competitive Rivalry
5 Market Size & Growth Forecasts (Value, USD)
- 5.1 By Product
- 5.1.1 Compound Microscopes
- 5.1.2 Stereo Microscopes
- 5.1.3 Digital / Opto-Digital Microscopes
- 5.1.4 Inverted Microscopes
- 5.1.5 Fluorescence & Super-Resolution Systems
- 5.1.6 Confocal & Multiphoton Microscopes
- 5.2 By End User
- 5.2.1 Hospitals & Clinics
- 5.2.2 Academic & Research Institutes
- 5.2.3 Diagnostic Laboratories
- 5.2.4 Pharmaceutical & Biotechnology Companies
- 5.2.5 Other End Users
- 5.3 By Geography
- 5.3.1 North America
- 5.3.1.1 United States
- 5.3.1.2 Canada
- 5.3.1.3 Mexico
- 5.3.2 Europe
- 5.3.2.1 Germany
- 5.3.2.2 United Kingdom
- 5.3.2.3 France
- 5.3.2.4 Italy
- 5.3.2.5 Spain
- 5.3.2.6 Rest of Europe
- 5.3.3 Asia-Pacific
- 5.3.3.1 China
- 5.3.3.2 India
- 5.3.3.3 Japan
- 5.3.3.4 Australia
- 5.3.3.5 South Korea
- 5.3.3.6 Rest of Asia-Pacific
- 5.3.4 Middle East and Africa
- 5.3.4.1 GCC
- 5.3.4.2 South Africa
- 5.3.4.3 Rest of Middle East and Africa
- 5.3.5 South America
- 5.3.5.1 Brazil
- 5.3.5.2 Argentina
- 5.3.5.3 Rest of South America
- 5.3.1 North America
6 Competitive Landscape
- 6.1 Market Concentration
- 6.2 Market Share Analysis
- 6.3 Company Profiles (includes Global level Overview, Market level overview, Core Segments, Financials as available, Strategic Information, Market Rank/Share for key companies, Products & Services, and Recent Developments)
- 6.3.1 Abberior Instruments
- 6.3.2 Accu-Scope Inc.
- 6.3.3 Agilent Technologies
- 6.3.4 AmScope (United Scope)
- 6.3.5 Bruker Corporation
- 6.3.6 Carl Zeiss AG
- 6.3.7 CoolLED Ltd.
- 6.3.8 Dino-Lite (AnMo Electronics)
- 6.3.9 Hamamatsu Photonics
- 6.3.10 Hitachi High-Tech Corp.
- 6.3.11 Jenoptik AG
- 6.3.12 Keyence Corp.
- 6.3.13 Labomed Inc.
- 6.3.14 Leica Microsystems (Danaher)
- 6.3.15 Lumencor Inc.
- 6.3.16 Meiji Techno
- 6.3.17 Motic Microscope
- 6.3.18 Nikon Instruments Inc.
- 6.3.19 Olympus Corporation
- 6.3.20 OPTO-Tech
- 6.3.21 PicoQuant
- 6.3.22 Prior Scientific Instruments
- 6.3.23 Thermo Fisher Scientific
- 6.3.24 Thorlabs
7 Market Opportunities & Future Outlook
- 7.1 White-space & Unmet-Need Assessment


