

|
시장보고서
상품코드
2124035
블록체인 IoT 시장 : 점유율 분석, 업계 동향과 통계, 성장 예측(2026-2031년)Blockchain IoT - Market Share Analysis, Industry Trends & Statistics, Growth Forecasts (2026 - 2031) |
||||||
 Mordor Intelligence
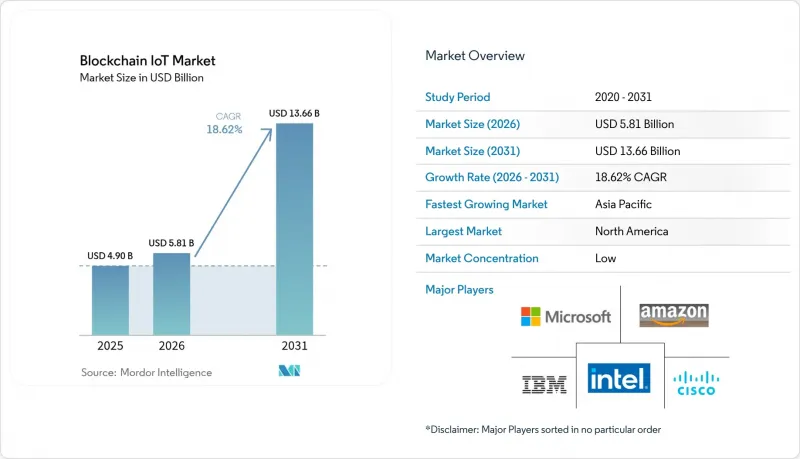
Mordor Intelligence에 의하면, 블록체인 IoT 시장 규모는 2025년에 49억 달러로 평가되었고 2026년 58억 1,000만 달러에서 성장하여 2031년까지 136억 6,000만 달러에 이를 것으로 예측됩니다.
예측 기간(2026-2031년) 동안의 연평균 성장률(CAGR)은 18.62%를 나타낼 전망입니다.
본 보고서는 제공 형태(하드웨어, 소프트웨어, 인프라), 용도(데이터 보안, 스마트 계약 및 자동화, 데이터 통신 및 무결성 등), 최종 사용자(제조, 에너지·유틸리티, 운송 및 물류 등),지역(북미, 유럽, 남미, 아시아태평양, 중동 및 아프리카)별로 분류되어 있습니다. 시장 예측은 금액(달러) 기준으로 제시되어 있습니다.
세계 블록체인 IoT 시장 동향 및 인사이트
IoT를 표적으로 한 사이버 공격이 급증함에 따라, 변조 방지형 원장(블록체인)에 대한 수요가 높아지고 있습니다.
악성코드의 양이 폭발적으로 증가함에 따라, 기업들은 프로토콜 수준에서 보안을 구축할 수밖에 없게 되었습니다. 경량 블록체인 합의 방식은 중앙 집중형 모델에 비해 처리량이 15% 향상되고, 지연 시간이 20% 감소하며, 악성 기기 감지율은 95.2%에 달했습니다. 최고정보보안책임자(CISO)들은 제로 트러스트 아키텍처에서 분산 원장이 필수적이라는 사실을 점점 더 인식하고 있습니다.
공급망 투명성 확보를 위한 규제 가속화
미국의 ‘연방 공급망 현지화 및 제조 개발법’이나 EU의 ‘eIDAS 2.0’ 등의 규제에 따라 검증 가능한 출처 증명이 의무화되고 있습니다. 캘리포니아주 차량관리국(DMV)은 4,200만 건의 자동차 소유권 증서를 블록체인으로 이전하여, 대규모 공공 분야에서의 실용화가 가능함을 입증했습니다.
암호화 처리 워크로드에 대한 디바이스 연산 능력의 한계
마이크로컨트롤러를 이용한 작업 증명(PoW) 테스트에서는 용납할 수 없는 수준의 에너지 소비가 확인되어, 벤더들은 오프로드 또는 하드웨어 가속을 통한 해시 처리로 전환하고 있습니다. FPGA의 SHA-256 코어는 소프트웨어에 비해 동적 전력 소비를 약 1,000분의 1로 줄입니다. 비용 장벽으로 인해 시장은 블록체인 지원 하이엔드 디바이스와 경량 인증 디바이스로 양분되어 있습니다.
부문 분석
2025년, 블록체인 IoT 시장에서 하드웨어는 45.40%의 점유율을 차지했으며, 그 중심에는 디바이스의 키를 보호하는 보안 요소(Secure Element)와 암호화 코프로세서가 있었습니다. 이 부문은 산업용 로봇 및 커넥티드카의 펌웨어 변조로부터 블록체인 IoT 시장 규모를 보호하고 있습니다. 레이어 2 롤업 및 엣지 검증기에 이르는 인프라는 기업이 파일럿 클라우드에서 프로덕션 환경용 네트워크로 전환함에 따라 연평균 성장률(CAGR) 20.90%로 확대될 것으로 예측됩니다. 소프트웨어 플랫폼은 API 게이트웨이를 통해 원장의 복잡성을 숨김으로써 스택을 완성합니다.
이러한 인프라의 급속한 성장은 오케스트레이션, 규정 준수, 모니터링을 통합한 하이퍼스케일러의 ‘블록체인 서비스(BaaS)’ 포트폴리오의 성숙도를 반영합니다. 퍼블릭 체인은 결정론적 지연 시간 임계값을 충족하는 데 어려움을 겪고 있기 때문에 미션 크리티컬 워크로드에서는 프라이빗 또는 컨소시엄형 원장이 주류를 이루고 있습니다. 하이브리드 아키텍처는 On-Premise 엣지 클러스터와 퍼블릭 결제 레이어를 융합하여, 완전한 분산화를 대가로 결정론적인 성능을 실현합니다. 토큰 기반 인센티브 게이트웨이는 대역폭 및 연산 능력 제공에 대해 운영자에게 보상을 제공함으로써, 블록체인 IoT 시장 전망 성장을 뒷받침할 자체 자금 조달형 백본을 육성하고 있습니다.
지역별 분석
북미는 미국의 FSLMDA(연방 단기 대출 시장법) 및 풍부한 벤처 자금 공급에 힘입어 2025년 블록체인 IoT 시장 매출의 35.60%를 차지했습니다. 4,200만 건의 블록체인 인증 자동차 소유권 증서 등 연방 및 주 차원의 시범 사업을 통해 공공 등록부에서 원장 활용이 표준화되고 있습니다. 캐나다의 유틸리티자들은 P2P(Peer-to-Peer) 에너지 마켓플레이스를 구축하고 있는 반면, 멕시코의 수출업체들은 USMCA(미국-멕시코-캐나다 협정)의 추적성 조항을 충족하기 위해 원산지 증명 원장을 도입하고 있습니다.
아시아태평양(APAC)은 2027년까지 36억 건의 셀룰러 IoT 연결을 실현하겠다는 중국의 목표에 힘입어, 2031년까지 연평균 성장률(CAGR)이 19.23%를 나타낼 것으로 전망됩니다. 일본은 블록체인과 IoT의 상호운용성 기준 제정을 주도하고 있으며, 한국은 스마트 시티 그리드에서 5G와 분산 원장을 결합하고, 인도는 농작물 보험 제도에서 블록체인의 시범 운영을 진행하고 있습니다. 호주는 광업의 규정 준수 관리에 검증된 센싱 기술을 적용하고 있습니다.
유럽에서는 ‘암호자산 시장 규제(MiCA)’ 및 ‘eIDAS 2.0’의 혜택을 받아, 국경을 초월한 기기의 식별성에 대한 견고한 법적 프레임워크가 마련되어 있습니다. 독일은 산업 분야에서의 도입을 추진하고, 네덜란드는 항만 화물 추적을 실시하며, 프랑스는 명품공급망을 디지털화하고 있습니다. 유럽 데이터 보호 위원회(EDPB)의 2025년 가이드라인에서는 ‘프라이버시 바이 디자인’에 기반한 원장 아키텍처가 상세하게 규정되어 있습니다.
중동 및 아프리카에서는 블록체인을 활용하여 기존 전력망을 뛰어넘어, 스마트 계량기 도입 및 드론을 이용한 자산 점검의 시범 운영이 진행되고 있습니다. 남미의 일부 광산에서는 수출 가격 프리미엄을 확보하기 위해 ESG 지표를 온체인에 기록하고 있습니다.
기타 혜택:
- 엑셀 형식 시장 예측(ME) 시트
- 3개월간의 애널리스트 지원
자주 묻는 질문
목차
제1장 서론
제2장 조사 방법
제3장 주요 요약
제4장 시장 구도
제5장 시장 규모와 성장 예측
제6장 경쟁 구도
제7장 시장 기회와 향후 전망
JHS 26.09.07According to Mordor Intelligence, the blockchain IoT market size was valued at USD 4.90 billion in 2025 and estimated to grow from USD 5.81 billion in 2026 to reach USD 13.66 billion by 2031, at a CAGR of 18.62% during the forecast period (2026-2031).
This report is Segmented by Offering (Hardware, Software, Infrastructure), Application (Data Security, Smart Contracts and Automation, Data Communication and Integrity, and More), End User (Manufacturing, Energy and Utility, Transportation and Logistics, and More), and Geography (North America, Europe, South America, Asia Pacific, and Middle East and Africa). The Market Forecasts are Provided in Terms of Value (USD).
Global Blockchain IoT Market Trends and Insights
Surge in IoT-centric cyber-attacks elevating demand for tamper-proof ledgers
Exploding malware volumes force enterprises to embed security at the protocol level. A lightweight blockchain consensus achieved 95.2% malicious-device detection with 15% higher throughput and 20% lower latency than centralised models. Chief information security officers increasingly regard distributed ledgers as mandatory for zero-trust architectures.
Acceleration of supply-chain transparency mandates
Regulations such as the US Federal Supply Chain Localisation and Manufacturing Development Act and EU eIDAS 2.0 oblige verifiable provenance. California's DMV moved 42 million car titles on-chain, proving large-scale public deployment viability.
Limited on-device computing power for cryptographic workloads
Proof-of-Work tests on micro-controllers showed untenable energy draw, pushing vendors toward offloaded or hardware-accelerated hashing. FPGA SHA-256 cores cut dynamic power nearly 1,000-fold versus software. Cost barriers split the market between premium blockchain-capable devices and lightweight authenticators.
Other drivers and restraints analyzed in the detailed report include:
- Edge-computing investments with Layer-2 roll-ups
- Standardisation of device identities via DID / VCs
- Rising energy cost for consensus edge nodes
For complete list of drivers and restraints, kindly check the Table Of Contents.
Segment Analysis
Hardware held 45.40% share of the blockchain IoT market in 2025, anchored by secure elements and cryptographic co-processors that safeguard device keys. The segment safeguards the blockchain IoT market size against firmware tampering across industrial robots and connected vehicles. Infrastructure, spanning Layer-2 roll-ups and edge validators, is projected to expand at 20.90% CAGR as enterprises migrate from pilot clouds to production-grade networks. Software platforms complete the stack by masking ledger complexity through API gateways.
The infrastructure boom reflects the maturity of blockchain-as-a-service portfolios from hyperscalers that bundle orchestration, compliance, and monitoring. Public chains struggle to match deterministic latency thresholds, so private or consortium-ledgers dominate mission-critical workloads. Hybrid architectures fuse on-prem edge clusters with public settlement layers, trading full decentralisation for deterministic performance. Token-incentivised gateways reward operators for bandwidth and compute contributions, nurturing a self-financing backbone that underpins future growth of the blockchain IoT market.
Complete Report Scope:
- By Offering
- Hardware
- IoT Sensors and Actuators
- Gateways and Edge Devices
- Connectivity Modules
- Blockchain Chipsets
- Software
- Middleware Platforms
- Smart-Contract Management
- Identity and Access Management
- Analytics and Visualization
- Infrastructure
- Public Chains
- Private/Consortium Chains
- Cloud and Edge Services
- Hardware
- By Application
- Data Security
- Smart Contracts and Automation
- Data Communication and Integrity
- Asset Tracking and Management
- Predictive Maintenance
- Other Niche Applications
- By End User
- Manufacturing
- Energy and Utilities
- Transportation and Logistics
- Building Management and Smart Facilities
- Retail and eCommerce
- Smart Cities and Government
- Healthcare and Life Sciences
- Agriculture
- By Geography
- North America
- United States
- Canada
- Mexico
- South America
- Brazil
- Argentina
- Rest of South America
- Europe
- Germany
- United Kingdom
- France
- Italy
- Spain
- Russia
- Rest of Europe
- Asia-Pacific
- China
- India
- Japan
- South Korea
- Australia and New Zealand
- Rest of Asia-Pacific
- Middle East and Africa
- Middle East
- Saudi Arabia
- United Arab Emirates
- Turkey
- Rest of Middle East
- Africa
- South Africa
- Nigeria
- Rest of Africa
- Middle East
- North America
Geography Analysis
North America retained 35.60% of the blockchain IoT market revenue in 2025, aided by the US FSLMDA and deep venture funding pools. Federal and state pilots-such as 42 million blockchain-verified car titles-canonicalise ledger usage in public registries. Canadian utilities deploy peer-to-peer energy marketplaces, whereas Mexican exporters adopt provenance ledgers to satisfy USMCA traceability clauses.
APAC posts a 19.23% CAGR outlook to 2031, anchored by China's goal of 3.6 billion cellular IoT links by 2027 . Japan spearheads blockchain-IoT interoperability standards, South Korea couples 5G and distributed ledgers in smart-city grids, and India pilots blockchain in crop-insurance schemes. Australia applies verified sensing to mining compliance.
Europe gains from the Markets in Crypto-Assets Regulation and eIDAS 2.0, supplying robust legal scaffolding for cross-border device identity. Germany champions industrial roll-outs, the Netherlands tracks port cargo, and France digitises luxury supply chains. The European Data Protection Board's 2025 guidelines detail privacy-by-design ledger architectures
The Middle East and Africa leverage blockchain to leapfrog legacy grids, piloting smart-meter roll-outs and drone-based asset inspection. Selected South-American mines record ESG metrics on-chain to secure premium export pricing.
- IBM Corporation
- Intel Corporation
- Microsoft Corporation
- Cisco Systems Inc.
- Amazon Web Services Inc.
- Robert Bosch GmbH
- The Linux Foundation (Hyperledger)
- KrypC Technologies Pvt. Ltd.
- IoTeX Foundation
- R3 LLC
- IOTA Foundation
- Waltonchain Technology Co. Ltd.
- VeChain Foundation
- Helium Systems Inc.
- Filament LLC
- Samsung SDS Co. Ltd.
- Hitachi Ltd.
- Huawei Technologies Co. Ltd.
- Chainlink Labs
- Oracle Corporation
- Ericsson AB
- Dragino Technology Co. Ltd.
Additional Benefits:
- The market estimate (ME) sheet in Excel format
- 3 months of analyst support
TABLE OF CONTENTS
1 INTRODUCTION
- 1.1 Study Assumptions and Market Definition
- 1.2 Scope of the Study
2 RESEARCH METHODOLOGY
3 EXECUTIVE SUMMARY
4 MARKET LANDSCAPE
- 4.1 Market Overview
- 4.2 Market Drivers
- 4.2.1 Surge in IoT-centric cyber-attacks elevating demand for tamper-proof ledgers
- 4.2.2 Acceleration of supply-chain transparency mandates (ESG, eIDAS 2.0, US FSLMDA)
- 4.2.3 Edge-computing investments coupled with Layer-2 roll-ups for low-latency consensus
- 4.2.4 Standardization of device identities via DID/Verifiable Credentials frameworks
- 4.2.5 Emergence of DePIN token-incentivized sensor networks
- 4.2.6 Digital-twin monetization through on-chain provenance tokens
- 4.3 Market Restraints
- 4.3.1 Limited on-device computing power for cryptographic workloads
- 4.3.2 Fragmented interoperability across blockchain protocols and IoT standards
- 4.3.3 Rising energy cost for Proof-of-Work/Proof-of-History edge nodes
- 4.3.4 Regulatory ambiguity surrounding tokenized machine data ownership
- 4.4 Industry Value Chain Analysis
- 4.5 Regulatory Landscape
- 4.6 Technological Outlook
- 4.7 Porter's Five Forces
- 4.7.1 Threat of New Entrants
- 4.7.2 Bargaining Power of Buyers
- 4.7.3 Bargaining Power of Suppliers
- 4.7.4 Threat of Substitute Products
- 4.7.5 Intensity of Competitive Rivalry
- 4.8 Assessment of Macroeconomic Factors on the Market
5 MARKET SIZE AND GROWTH FORECASTS (VALUE)
- 5.1 By Offering
- 5.1.1 Hardware
- 5.1.1.1 IoT Sensors and Actuators
- 5.1.1.2 Gateways and Edge Devices
- 5.1.1.3 Connectivity Modules
- 5.1.1.4 Blockchain Chipsets
- 5.1.2 Software
- 5.1.2.1 Middleware Platforms
- 5.1.2.2 Smart-Contract Management
- 5.1.2.3 Identity and Access Management
- 5.1.2.4 Analytics and Visualization
- 5.1.3 Infrastructure
- 5.1.3.1 Public Chains
- 5.1.3.2 Private/Consortium Chains
- 5.1.3.3 Cloud and Edge Services
- 5.1.1 Hardware
- 5.2 By Application
- 5.2.1 Data Security
- 5.2.2 Smart Contracts and Automation
- 5.2.3 Data Communication and Integrity
- 5.2.4 Asset Tracking and Management
- 5.2.5 Predictive Maintenance
- 5.2.6 Other Niche Applications
- 5.3 By End User
- 5.3.1 Manufacturing
- 5.3.2 Energy and Utilities
- 5.3.3 Transportation and Logistics
- 5.3.4 Building Management and Smart Facilities
- 5.3.5 Retail and eCommerce
- 5.3.6 Smart Cities and Government
- 5.3.7 Healthcare and Life Sciences
- 5.3.8 Agriculture
- 5.4 By Geography
- 5.4.1 North America
- 5.4.1.1 United States
- 5.4.1.2 Canada
- 5.4.1.3 Mexico
- 5.4.2 South America
- 5.4.2.1 Brazil
- 5.4.2.2 Argentina
- 5.4.2.3 Rest of South America
- 5.4.3 Europe
- 5.4.3.1 Germany
- 5.4.3.2 United Kingdom
- 5.4.3.3 France
- 5.4.3.4 Italy
- 5.4.3.5 Spain
- 5.4.3.6 Russia
- 5.4.3.7 Rest of Europe
- 5.4.4 Asia-Pacific
- 5.4.4.1 China
- 5.4.4.2 India
- 5.4.4.3 Japan
- 5.4.4.4 South Korea
- 5.4.4.5 Australia and New Zealand
- 5.4.4.6 Rest of Asia-Pacific
- 5.4.5 Middle East and Africa
- 5.4.5.1 Middle East
- 5.4.5.1.1 Saudi Arabia
- 5.4.5.1.2 United Arab Emirates
- 5.4.5.1.3 Turkey
- 5.4.5.1.4 Rest of Middle East
- 5.4.5.2 Africa
- 5.4.5.2.1 South Africa
- 5.4.5.2.2 Nigeria
- 5.4.5.2.3 Rest of Africa
- 5.4.5.1 Middle East
- 5.4.1 North America
6 COMPETITIVE LANDSCAPE
- 6.1 Market Concentration
- 6.2 Strategic Moves
- 6.3 Market Share Analysis
- 6.4 Company Profiles (includes Global level Overview, Market level overview, Core Segments, Financials as available, Strategic Information, Market Rank/Share for key companies, Products and Services, and Recent Developments)
- 6.4.1 IBM Corporation
- 6.4.2 Intel Corporation
- 6.4.3 Microsoft Corporation
- 6.4.4 Cisco Systems Inc.
- 6.4.5 Amazon Web Services Inc.
- 6.4.6 Robert Bosch GmbH
- 6.4.7 The Linux Foundation (Hyperledger)
- 6.4.8 KrypC Technologies Pvt. Ltd.
- 6.4.9 IoTeX Foundation
- 6.4.10 R3 LLC
- 6.4.11 IOTA Foundation
- 6.4.12 Waltonchain Technology Co. Ltd.
- 6.4.13 VeChain Foundation
- 6.4.14 Helium Systems Inc.
- 6.4.15 Filament LLC
- 6.4.16 Samsung SDS Co. Ltd.
- 6.4.17 Hitachi Ltd.
- 6.4.18 Huawei Technologies Co. Ltd.
- 6.4.19 Chainlink Labs
- 6.4.20 Oracle Corporation
- 6.4.21 Ericsson AB
- 6.4.22 Dragino Technology Co. Ltd.
7 MARKET OPPORTUNITIES AND FUTURE OUTLOOK
- 7.1 White-space and Unmet-Need Assessment


