

|
시장보고서
상품코드
2124121
비금속 시장 : 점유율 분석, 업계 동향과 통계, 성장 예측(2026-2031년)Base Metals - Market Share Analysis, Industry Trends & Statistics, Growth Forecasts (2026 - 2031) |
||||||
 Mordor Intelligence
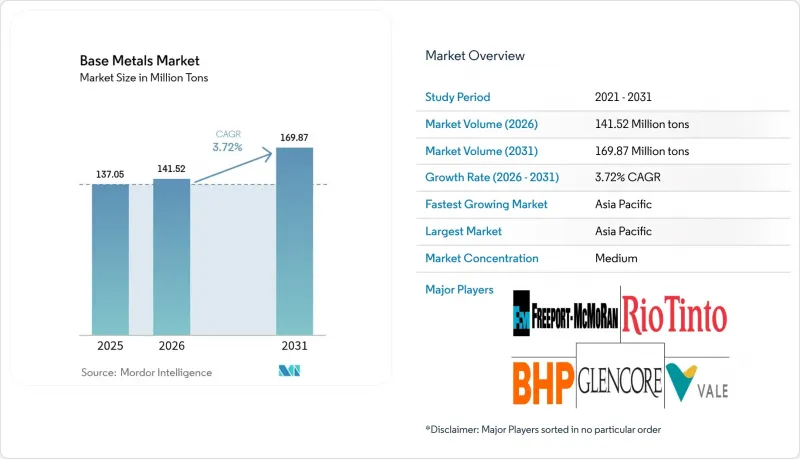
Mordor Intelligence에 의하면, 비금속 시장 규모는 2025년 1억 3,705만 톤, 2026년 1억 4,152만 톤으로부터, 2031년까지 1억 6,987만 톤으로 확대되어 2026년부터 2031년까지 CAGR 3.72%를 나타낼 것으로 예측됩니다.
본 보고서는 조달원(1차 광업 및 2차(재활용) 금속), 금속 유형(구리, 알루미늄 등), 최종 사용자 산업(건설, 자동차 및 운송, 전기 및 전자, 소비재 등), 지역(아시아태평양, 북미, 유럽, 남미, 중동 및 아프리카)별로 분류되어 있습니다. 시장 전망은 수량(톤) 기준으로 제시되어 있습니다.
세계 비금속 시장 동향 및 인사이트
전기차(EV) 배선 및 충전 인프라를 위한 구리 수요 증가
전기차 1대당 83kg의 구리가 필요하며, 이는 내연기관 차량에 필요한 23kg의 약 4배에 해당합니다. 급속 충전기 설치로 인해 1대당 8kg이 추가로 소요되고, 송전망 강화로 인해 충전소 1곳당 15-20kg이 추가되어 수요를 더욱 끌어올리고 있습니다. 2025년, 중국에는 110만 대의 공공 충전기가 설치되었고, 유럽에서도 42만 대가 추가되었습니다. 이에 따라 해당 연도에 총 18만 톤의 구리 수요 증가가 발생했습니다. 변압기의 미결제 수주량은 현재 18-24개월 분량으로, 구리 수요의 일부가 향후 분기로 이월되고 있습니다. 각국의 인프라 계획과 연계된 인도 계약을 통해 생산자는 유리한 조건으로 공급량을 확보할 수 있으며, 변동이 심한 현물 거래 가격 속에서도 이익률을 유지하고 있습니다.
신흥국의 인프라 부양책
인도의 1조 4,000억 달러 규모의 ‘국가 인프라 계획’에서는 그 중 38%가 발전 및 송전에 배정되어 있으며, 2030년까지 280만 톤의 구리와 410만 톤의 알루미늄이 소비될 것으로 예측됩니다. 동남아시아에서는 2025년에 데이터센터의 IT 용량이 620MW 증가할 예정이며, 1메가와트당 12톤의 구리가 필요하기 때문에 이는 새로운 지속적인 수요 요인이 될 것으로 보입니다. 사우디아라비아의 NEOM 프로젝트에서는 2030년까지 26GW의 재생에너지를 도입할 예정이며, 이로 인해 34만 톤의 알루미늄과 8만 5,000톤의 구리가 소비될 것으로 전망됩니다. 과거의 경기 부양책이 철강과 시멘트를 중시했던 반면, 현재의 프로그램은 전기화를 우선시하고 있어, 이로 인해 설비 교체 주기가 연장되고 다각화를 추진하고 있는 광업 기업의 이익률 향상 가능성이 높아지고 있습니다. 급성장하는 신흥 시장에 인접한 중견 기업들은 성장이 둔화되고 있는 지역에 묶여 있는 기존 기업들을 추월하여 시장 점유율을 확대될 전망입니다.
에너지 집약형 제련에 대한 탄소 가격 상승
유럽의 ‘탄소 국경 조정 메커니즘(CBAM)’은 수입 알루미늄에 대해 CO2 1톤당 90유로를 과세함으로써, 중국 및 러시아산 빌렛 비용을 1톤당 400-500달러까지 끌어올리고 있습니다. 노르스크 하이드로는 2025년 전력 가격이 150유로/MWh에 도달했을 때, 고부가가치 제품의 가격 책정에도 불구하고 슬로바르코 제련소의 생산량을 12만 톤 감축했습니다. 중국의 배출권 거래 제도(ETS)는 2025년에 알루미늄과 구리의 적용 대상을 확대하고, 과거 배출 강도보다 낮은 배출권을 할당했기 때문에 제련소는 상쇄권 구매나 재생에너지 도입을 강요받고 있습니다. 전해조의 개조는 기술적으로 가능하지만, 전력망 연계까지 리드타임이 3-5년 걸리기 때문에 탈탄소화가 지연되고 있습니다. 아이슬란드, 퀘벡, 그리고 미국 북서부에 위치한 수력 및 지열 발전을 이용하는 제련소는 현재 석탄을 연료로 사용하는 경쟁사들에 비해 톤당 200-300달러의 이익 프리미엄을 얻고 있습니다.
부문별 분석
2026년부터 2031년까지 2차 금속 시장은 연평균 성장률(CAGR) 4.91%로 확대되어 자동차 제조업체와 전자기기 제조업체가 스코프 3 목표 달성을 위해 장기 스크랩 공급 계약을 체결함에 따라 전체 비금속 시장의 성장률을 상회했습니다. 1차 광업은 2025년 생산량의 74.60%를 차지하며 여전히 지배적인 위치를 차지하고 있지만, 12-15년에 이르는 인허가 취득 주기와 에너지 비용 상승에 직면해 있어 이익률 압박과 신규 생산 지연을 초래하고 있습니다. 2025년 재활용 구리량은 280만 톤에 달했으며, 이는 폐차 및 가전제품 회수량의 38%를 차지했습니다. 국제구리연구그룹(ICSG)은 2030년까지 재활용 원료가 수요의 35%를 충당할 것으로 예측하며, 순환형 공급 루프의 중기적 매력을 뒷받침하고 있습니다.
알루미늄 재활용은 제련에 비해 에너지 소비량이 95% 적으며, 전력 가격이 80달러/MWh를 초과할 경우 톤당 800-1,000달러의 비용 헤지 효과를 가져옵니다. 글렌코어(Glencore)사의 이탈리아 배터리 재활용 거점은 연간 2만 5,000톤의 배터리 팩을 처리하며, 2028년까지 해당 회사의 정제 니켈 생산량의 15%를 공급할 전망으로, 폐쇄형 순환 니켈의 비금속 시장 규모가 앞으로 가속화될 것임을 보여줍니다. 납의 경우 이미 총량의 85%가 폐배터리에서 조달되고 있으며, 구리와 알루미늄도 EU와 캘리포니아주의 보증금 반환 제도를 통해 이 모델을 재현하고 있습니다. 스크랩 공급량이 가장 큰 병목 요인으로 작용하고 있습니다. 전기차 배터리의 수명은 12-15년이므로, 블랙매스공급이 정점에 달하는 시기는 2030년대 초반이 될 전망입니다.
지역별 분석
아시아태평양은 2025년에 전체의 49.81%를 차지하며 5.29%라는 업계 최고 수준의 연평균 성장률(CAGR)을 달성할 전망이지만, 이 지역의 전망은 양극화되어 있습니다. 중국에서는 주택 착공 건수가 18% 감소하고, 지방 자치 단체의 부채가 경기 부양책의 여지를 압박함에 따라 수요가 감소하고 있습니다. 대조적으로, 인도에서는 전력망 확장과 재생에너지 통합을 앞당겨 추진하는 1조 4,000억 달러 규모의 유틸리티 프로그램을 배경으로 수요가 급증했습니다. 아세안(ASEAN) 국가에서는 2025년에 데이터센터 부하가 620MW 증가할 전망이며, 1메가와트당 12톤의 구리가 필요하기 때문에 이 지역은 비금속 시장의 새로운 성장 동력이 되고 있습니다.
북미는 ‘인프라 투자 및 고용법’과 ‘인플레이션 억제법’을 발판으로 성장하고 있습니다. 이 두 법안 모두 송전망 및 전기차(EV) 공급망에 사용되는 금속에 대해 현지 조달을 장려하는 내용입니다. 유럽에서는 전력 가격이 3자리 수에 달하는 가운데, 1차 알루미늄 생산량이 8% 감소하면서 구조적인 압박에 직면하고 있으며, 탄소국경조정세가 부과되고 있음에도 불구하고 구매자들은 탄소 발자국이 큰 빌렛을 수입할 수밖에 없는 상황입니다. 중동 및 아프리카은 사우디아라비아의 NEOM과 이집트의 신수도가 에너지 효율이 높은 건축물 및 전기 교통 수단을 위해 대량의 알루미늄과 구리를 조달하고 있어 지속적인 확장을 이어가고 있습니다.
남미는 브라질과 칠레가 주도하고 있지만, 페루의 정치적 교착 상태로 인해 4개 구리 광산의 확장 계획이 지연되고 있으며, 이러한 걸림돌이 지역 성장을 제한할 가능성이 있습니다. 해운 시장은 이에 적응해 가고 있습니다. 각 광산 기업들은 인도의 얕은 수심 항구에 입항하기 위해 케이프사이즈 선박에서 더 소형인 파나막스 선박으로의 전환을 추진하고 있으며, 이러한 전환으로 톤당 운송 비용은 7-9% 상승하겠지만, 운송 주기는 2주 단축될 전망입니다. 수요의 중심이 인도와 아세안으로 재편되는 가운데, 물류 체계의 재검토가 비금속 시장에서 경쟁적 차별화 요인으로 부상하고 있습니다.
기타 혜택:
- 엑셀 형식 시장 예측(ME) 시트
- 3개월간의 애널리스트 지원
자주 묻는 질문
목차
제1장 서론
제2장 조사 방법
제3장 주요 요약
제4장 시장 구도
제5장 시장 규모와 성장 예측
제6장 경쟁 구도
제7장 시장 기회와 향후 전망
JHS 26.09.11According to Mordor Intelligence, the base metals market size is projected to expand from 137.05 Million tons in 2025 and 141.52 Million tons in 2026 to 169.87 Million tons by 2031, registering a CAGR of 3.72% between 2026 to 2031.
This report is Segmented by Source (Primary Mining and Secondary (Recycled) Metals), Metal Type (Copper, Aluminium, and More), End-User Industry (Construction, Automotive and Transportation, Electrical and Electronics, Consumer Products, and More), and Geography (Asia-Pacific, North America, Europe, South America, and Middle-East and Africa). The Market Forecasts are Provided in Terms of Volume (Tons).
Global Base Metals Market Trends and Insights
Expanding Copper Demand for EV Wiring and Charging Infrastructure
Each battery-electric car needs 83 kg of copper, nearly four times the 23 kg required in internal-combustion models. Rapid charger installations add another 8 kg per unit, and grid reinforcement adds 15-20 kg per charging point, compounding demand. China installed 1.1 million public chargers in 2025, and Europe added 420,000, together creating 180,000 tons of incremental copper pull that year. Transformers now have 18-24-month order backlogs, pushing a slice of copper demand into future quarters. Offtake agreements linked to national infrastructure programs help producers lock in volumes at premium terms, protecting margins amid volatile spot treatment charges.
Infrastructure Stimulus in Emerging Economies
India's USD 1.4 trillion National Infrastructure Pipeline earmarks 38% for power generation and transmission, implying uptake of 2.8 million tons of copper and 4.1 million tons of aluminium by 2030. Southeast Asia added 620 MW of new data-center IT capacity in 2025, with every megawatt requiring 12 tons of copper, underscoring a new, durable demand vector. Saudi Arabia's NEOM will deploy 26 GW of renewables by 2030, soaking up 340,000 tons of aluminium and 85,000 tons of copper. Compared with earlier stimulus cycles that favored steel and cement, today's programs prioritize electrification, extending replacement cycles and boosting margin potential for diversified miners. Mid-tier operators positioned near fast-growing emerging markets stand to gain share at the expense of incumbents locked into decelerating regions.
Rising Carbon Pricing on Energy-Intensive Smelting
Europe's Carbon Border Adjustment Mechanism levies EUR 90 per ton of CO2 on imported aluminium, inflating Chinese and Russian billet costs by USD 400-500 per ton. Norsk Hydro curtailed 120,000 tons at its Slovalco smelter in 2025 when power prices hit EUR 150/MWh, despite premium product pricing. China's ETS expanded to aluminium and copper in 2025, allocating emissions permits below historic intensity, compelling smelters to buy offsets or adopt renewables. Retrofitting cells is technically feasible, but grid-tie lead times of 3-5 years delay decarbonization. Hydro- and geothermal-powered smelters in Iceland, Quebec, and the U.S. Northwest now earn USD 200-300 per ton margin premiums over coal-based rivals.
Other drivers and restraints analyzed in the detailed report include:
- Aluminium Substitution in Automotive Lightweighting
- Strategic Stockpiling for Critical-Mineral Security
- Trade-Policy Volatility and Supply-Chain Disruptions
For complete list of drivers and restraints, kindly check the Table Of Contents.
Segment Analysis
Secondary metals expanded 4.91% CAGR from 2026 to 2031, beating the overall base metals market growth as carmakers and electronics firms sign long-term scrap pacts to hit scope-3 targets. Primary mining still dominated at 74.60% of 2025 volume but is grappling with 12-15-year permitting cycles and rising energy costs, squeezing margins and delaying new output. Recycled copper reached 2.8 million tons in 2025, representing 38% of end-of-life vehicles and appliance collections. The International Copper Study Group forecasts recycled feed will cover 35% of demand by 2030, reinforcing the medium-term appeal of circular supply loops.
Recycling aluminium consumes 95% less energy than smelting, offering a cost hedge of USD 800-1,000 per ton at power prices above USD 80/MWh. Glencore's Italian battery-recycling hub will process 25,000 tons of packs yearly, supplying 15% of its refined nickel output by 2028 and illustrating how the base metals market size for closed-loop nickel is set to accelerate. Lead already sources 85% of tonnage from spent batteries, a blueprint copper and aluminium are replicating through deposit-return schemes in the EU and California. Scrap availability is the main bottleneck; EV batteries last 12-15 years, so a wave of black-mass supply will not crest until the early 2030s.
Complete Report Scope:
- By Source
- Primary Mining
- Secondary (Recycled) Metals
- By Metal Type
- Copper
- Aluminium
- Zinc
- Nickel
- Lead
- Tin
- By End-user Industry
- Construction
- Automotive and Transportation
- Electrical and Electronics
- Consumer Products
- Medical Devices
- Other End-user Industries
- By Geography
- Asia-Pacific
- China
- India
- Japan
- South Korea
- Australia
- ASEAN Countries
- Rest of Asia-Pacific
- North America
- United States
- Canada
- Mexico
- Europe
- Germany
- United Kingdom
- France
- Italy
- Spain
- NORDIC Countries
- Russia
- Rest of Europe
- South America
- Brazil
- Argentina
- Rest of South America
- Middle-East and Africa
- Saudi Arabia
- United Arab Emirates
- Qatar
- South Africa
- Nigeria
- Egypt
- Rest of Middle-East and Africa
- Asia-Pacific
Geography Analysis
Asia-Pacific retained 49.81% of tonnage in 2025 and will deliver a leading 5.29% CAGR, yet the region's outlook is bifurcated. China's demand is declining as residential starts fell 18% and local-government debt eroded stimulus headroom. India, by contrast, surged on the back of a USD 1.4 trillion public-works program that is front-loading power-grid expansion and renewables integration. ASEAN countries added 620 MW of data-center load in 2025, each megawatt calling for 12 tons of copper, turning the region into a fresh growth corridor for the base metals market.
North America is growing on the strength of the Infrastructure Investment and Jobs Act and the Inflation Reduction Act, both of which incentivize local sourcing of metal for grids and EV supply chains. Europe is under structural pressure after primary aluminium output dropped 8% amid triple-digit power prices, forcing buyers to import higher-footprint billet despite carbon-border levies. Middle-East and Africa is expanding as Saudi Arabia's NEOM and Egypt's new capital city procure large volumes of aluminium and copper for energy-efficient buildings and electrified transit.
South America is paced by Brazil and Chile, yet political gridlock in Peru has delayed four copper-mine expansions, a drag that may limit regional growth. Freight markets are adapting: miners are switching from Capesize vessels to smaller Panamax routes to hit India's shallow-draft ports, a shift that could raise per-ton shipping costs by 7-9% but speed cycle times by two weeks. Logistics recalibration is becoming a competitive differentiator in the base metals market as demand centers re-map toward India and ASEAN.
- Alcoa Corporation
- Anglo American PLC
- Aurubis AG
- BHP
- First Quantum Minerals Ltd.
- Freeport-McMoRan
- Glencore
- Grupo Mexico
- Jiangxi Copper Corporation
- Jubilee Metals Group PLC
- Lundin Mining Corporation
- Norilsk Nickel
- Norsk Hydro ASA
- Rio Tinto
- Sumitomo Metal Mining Co., Ltd.
- Vale S.A.
- Vedanta Resources Limited
- Zijin Mining Group Co. Ltd
Additional Benefits:
- The market estimate (ME) sheet in Excel format
- 3 months of analyst support
TABLE OF CONTENTS
1 Introduction
- 1.1 Study Assumptions and Market Definition
- 1.2 Scope of the Study
2 Research Methodology
3 Executive Summary
4 Market Landscape
- 4.1 Market Overview
- 4.2 Market Drivers
- 4.2.1 Expanding copper demand for EV wiring and charging infrastructure
- 4.2.2 Infrastructure stimulus in emerging economies
- 4.2.3 Aluminium substitution in automotive lightweighting
- 4.2.4 Strategic stockpiling for critical-mineral security
- 4.2.5 Improved mining, processing and recycling capabilities
- 4.3 Market Restraints
- 4.3.1 Rising carbon pricing on energy-intensive smelting
- 4.3.2 Trade-policy volatility and supply-chain disruptions
- 4.3.3 Environmental and community-consent pressures
- 4.4 Value Chain Analysis
- 4.5 Porter's Five Forces
- 4.5.1 Bargaining Power of Suppliers
- 4.5.2 Bargaining Power of Buyers
- 4.5.3 Threat of New Entrants
- 4.5.4 Threat of Substitutes
- 4.5.5 Degree of Competition
5 Market Size and Growth Forecasts (Volume)
- 5.1 By Source
- 5.1.1 Primary Mining
- 5.1.2 Secondary (Recycled) Metals
- 5.2 By Metal Type
- 5.2.1 Copper
- 5.2.2 Aluminium
- 5.2.3 Zinc
- 5.2.4 Nickel
- 5.2.5 Lead
- 5.2.6 Tin
- 5.3 By End-user Industry
- 5.3.1 Construction
- 5.3.2 Automotive and Transportation
- 5.3.3 Electrical and Electronics
- 5.3.4 Consumer Products
- 5.3.5 Medical Devices
- 5.3.6 Other End-user Industries
- 5.4 By Geography
- 5.4.1 Asia-Pacific
- 5.4.1.1 China
- 5.4.1.2 India
- 5.4.1.3 Japan
- 5.4.1.4 South Korea
- 5.4.1.5 Australia
- 5.4.1.6 ASEAN Countries
- 5.4.1.7 Rest of Asia-Pacific
- 5.4.2 North America
- 5.4.2.1 United States
- 5.4.2.2 Canada
- 5.4.2.3 Mexico
- 5.4.3 Europe
- 5.4.3.1 Germany
- 5.4.3.2 United Kingdom
- 5.4.3.3 France
- 5.4.3.4 Italy
- 5.4.3.5 Spain
- 5.4.3.6 NORDIC Countries
- 5.4.3.7 Russia
- 5.4.3.8 Rest of Europe
- 5.4.4 South America
- 5.4.4.1 Brazil
- 5.4.4.2 Argentina
- 5.4.4.3 Rest of South America
- 5.4.5 Middle-East and Africa
- 5.4.5.1 Saudi Arabia
- 5.4.5.2 United Arab Emirates
- 5.4.5.3 Qatar
- 5.4.5.4 South Africa
- 5.4.5.5 Nigeria
- 5.4.5.6 Egypt
- 5.4.5.7 Rest of Middle-East and Africa
- 5.4.1 Asia-Pacific
6 Competitive Landscape
- 6.1 Market Concentration
- 6.2 Strategic Moves
- 6.3 Market Share(%)/Ranking Analysis
- 6.4 Company Profiles (includes Global level Overview, Market level overview, Core Segments, Financials as available, Strategic Information, Products and Services, and Recent Developments)
- 6.4.1 Alcoa Corporation
- 6.4.2 Anglo American PLC
- 6.4.3 Aurubis AG
- 6.4.4 BHP
- 6.4.5 First Quantum Minerals Ltd.
- 6.4.6 Freeport-McMoRan
- 6.4.7 Glencore
- 6.4.8 Grupo Mexico
- 6.4.9 Jiangxi Copper Corporation
- 6.4.10 Jubilee Metals Group PLC
- 6.4.11 Lundin Mining Corporation
- 6.4.12 Norilsk Nickel
- 6.4.13 Norsk Hydro ASA
- 6.4.14 Rio Tinto
- 6.4.15 Sumitomo Metal Mining Co., Ltd.
- 6.4.16 Vale S.A.
- 6.4.17 Vedanta Resources Limited
- 6.4.18 Zijin Mining Group Co. Ltd
7 Market Opportunities and Future Outlook
- 7.1 White-space and Unmet-need Assessment
- 7.2 Increased Demand for Clean Energy Technologies


