|
시장보고서
상품코드
2124135
알루미늄 캔 시장 : 점유율 분석, 업계 동향과 통계, 성장 예측(2026-2031년)Aluminum Cans - Market Share Analysis, Industry Trends & Statistics, Growth Forecasts (2026 - 2031) |
||||||
 Mordor Intelligence
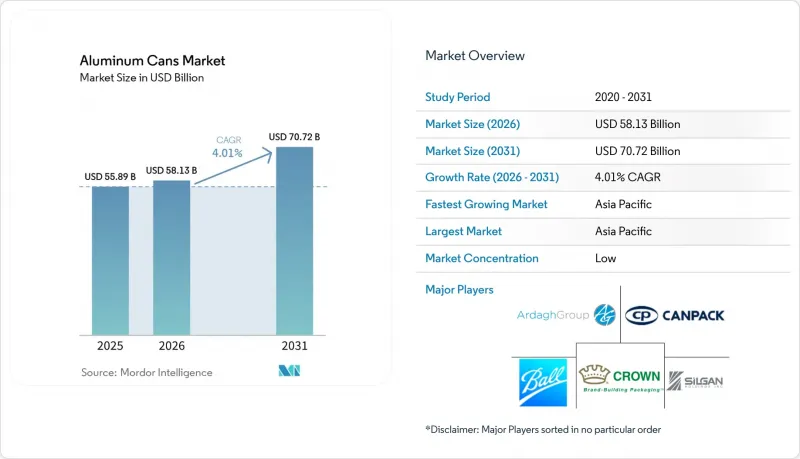
Mordor Intelligence에 의하면, 2026년 세계의 알루미늄 캔 시장 규모는 581억 3,000만 달러로 추정되고 있어 2025년 558억 9,000만 달러에서 확대해, 2031년에는 707억 2,000만 달러에 이를 것으로 예측됩니다.
2026년부터 2031년까지 연평균 성장률(CAGR) 4.01%로 성장할 것으로 전망됩니다.
본 보고서는 유형별(스탠다드, 슬릭, 슬림 등), 최종 사용자 산업별(음료(주류, 무알코올 음료), 식품(통조림, 반려동물사료), 에어로졸 등), 구조(2피스, 3피스), 용량(250ml 이하, 251-500ml, 500ml 초과), 지역(북미, 유럽, 아시아태평양, 기타)별로 분류되어 있습니다. 시장 예측은 금액(달러) 기준으로 제시되어 있습니다.
세계 알루미늄 캔 시장 동향 및 인사이트
높은 재활용성과 폐쇄형 회수 시스템
알루미늄은 그 야금학적 특성을 반영구적으로 유지하기 때문에 플라스틱이나 유리로는 실현할 수 없는 진정한 소재 순환을 가능하게 합니다. 캔 제조업체 협회(Can Manufacturers Institute)에 따르면, 지금까지 생산된 알루미늄의 75%가 현재도 현역으로 사용되고 있으며, 2차 알루미늄의 재용해는 1차 제련에 비해 95% 적은 에너지로 충분합니다. 유럽의 제련업체인 콘스텔리움(Constellium), 엘발(Elval), 노벨리스(Novelis), 스피에라(Speira)는 2024년 4월 합금 사양을 통일하여 재활용 소재 함량 100%까지의 음료 캔 제조를 가능하게 했습니다. 이를 통해 금속 1톤당 2.6톤의 CO2 배출량을 감축하고, 과학에 기반한 기후 목표를 추구하는 충전 업체의 운영 비용을 절감하고 있습니다. 미국의 재활용률은 2023년에 43%까지 떨어졌으나, 업계가 지원하는 투자를 통해 2030년까지 회수율을 70%, 2050년까지 90%로 높여 캔 제조 공장에 대한 장기적인 원료 공급 안정화를 도모하고 있습니다. 유럽, 캐나다 및 미국의 특정 주에서는 연간 400억 개 이상의 용기를 대상으로 한 보증금 환불 제도가 시행되고 있으며, 이로 인해 회수량이 대폭 증가하고 있습니다. 그 결과, 스크랩 프리미엄이 하락하여 일괄 생산을 하는 캔 제조업체의 이익률이 향상되고 있습니다. 이러한 구조적 이점들이 맞물려 예상 연평균 성장률(CAGR)에 1.2퍼센트 포인트를 더하며, 알루미늄이 음료 포장재 분야에서 결정적인 순환형 소재로서의 입지를 확고히 하고 있습니다.
EPR 및 플라스틱세 의무화를 배경으로 한 PET/유리에서 알루미늄으로의 전환
확대 생산자 책임(EPR) 제도는 원자재 비용의 우선순위를 근본적으로 재구성하고 있습니다. 영국의 2025년 EPR 기본 요금은 알루미늄 1톤당 266파운드로 설정되어 있으며, 이는 PET, 다층 파우치 또는 재활용이 어려운 연포장재에 적용되는 부과금보다 훨씬 낮은 수준입니다. 캘리포니아주는 2024년 1월, 용기 반환 가치 프로그램을 와인 및 증류주로 확대하여, 이에 따라 대상 음료 캔 시장 규모가 연간 4억 개분으로 즉시 확대되었습니다. 한편, EU 규정은 2029년까지 일회용 음료 용기의 회수율을 90%로 높일 것을 의무화하고 있으며, 이 기준은 사용 후 스크랩 가치가 높은 알루미늄에 매우 유리한 것입니다. 호주에서는 2040년까지 식품용 알루미늄에 80%의 재활용 소재 함유가 의무화될 예정이며, 이는 태평양 연안 지역 전체 수요 전망을 더욱 견고하게 만들고 있습니다. 이러한 정책들의 시너지 효과로 알루미늄의 매력이 높아지면서, 중기 성장 전망이 1.5% 더 상향 조정되었습니다.
플렉서블 PET 및 종이팩 형태와의 경쟁
다층 카톤 및 경량 PET 병은 가격에 민감한 부문, 특히 자사 브랜드 주스, 유제품 음료, 상온 보관 가능한 생수 시장에서 계속해서 지배적인 위치를 차지하고 있습니다. 이러한 분야에서는 브랜드 소유자가 재활용 가능성보다 단가를 우선시하고 있습니다. 새로운 글리콜 개질 기술로 인해 탄산음료 및 민감한 영양 성분이 함유된 제품에서 PET의 유통 기한이 연장되면서, 알루미늄의 기능적 우위가 축소되고 있습니다. 신흥국 시장에서는 소비자들이 지속가능성을 위해 추가 비용을 지불하려는 의지가 여전히 낮아, 상품화된 카테고리에서의 보급을 억제하고 있습니다. 그러나 EU와 캐나다 전역에서 예정된 재활용 불가능한 플라스틱 용기 금지 조치에 더해, 달성하기 어려운 EPR(확대 생산자 책임) 기준치로 인해 연포장재의 경쟁 우위는 점차 약화될 것입니다. 그 결과, 2025년부터 2027년까지 알루미늄 캔 시장의 연평균 성장률(CAGR)에 일시적으로 0.8%의 부정적 영향이 발생할 것으로 예측됩니다.
부문 분석
표준 330mL 및 355mL 캔은 2025년 매출의 55.38%를 차지했습니다. 이 점유율은 충전 라인과의 호환성, 최고 수준의 라인 속도, 그리고 최적의 팔레트 밀도에 의해 뒷받침되고 있습니다. 또한, 이 부문은 최종 사용자에게 널리 사랑받고 있다는 점도 강점으로 작용하여, 전 세계 보틀러들의 전환 비용을 절감하고 있습니다. 그럼에도 불구하고, 250mL 및 310mL 크기로 대표되는 슬림형 캔은 프리미엄한 비주얼 비율과 혼잡한 소매점 진열대에서 ‘빌보드 효과’가 향상됨에 따라 연평균 성장률(CAGR) 4.06%라는 빠른 속도로 시장 점유율을 확대되고 있습니다. 기능성 음료, 저칼로리 음료, 알코올 기반 즉석 음료 각 부문을 다루는 음료 개발자들은 진열대에서의 존재감과 냉장 진열장 내 가시성을 높이기 위해 가늘고 긴 형태를 높이 평가했습니다. Ball사의 ‘Dynamark’ 가변 그래픽 플랫폼을 통해 마케팅 담당자는 생산 라인을 중단하지 않고도 표준 형태와 슬림 형태 모두에 한정판 아트워크를 디자인할 수 있어, 재고 위험을 줄이고 캠페인의 기동성을 높일 수 있습니다. 인쇄 기술의 발전으로 단가가 하락함에 따라, 슬림 캔은 수익성이 높은 SKU에서 시장 침투를 더욱 확대할 것으로 예측됩니다. 특수한 형태나 촉감을 주는 엠보싱 가공은 아직 발전 단계에 있지만, 소비자 경험을 더욱 풍요롭게 하는 지속적인 혁신을 반영하고 있습니다. 전반적으로 알루미늄 캔 시장에서는 표준적인 대량 생산 형식과 슬림한 프리미엄 변형이 계속해서 공존할 것으로 예상되며, 후자는 생산 능력에 비해 훨씬 더 큰 수익 성장을 가져올 것으로 전망됩니다.
표준 형태의 캔은 여전히 뛰어난 물류 경제성의 이점을 누리고 있습니다. 355mL 캔 24개가 들어 있는 케이스의 무게는 같은 용량의 유리 용기보다 20% 가벼워, 이를 통해 운송 시 배출 가스를 줄이고 소매업체에서 진열대에 진열할 때의 부상 위험을 낮춥니다. 1990년대부터 채택된 두꺼운 판 두께 덕분에, 금속 가격이 급등하는 상황에서도 컨버터는 안정적인 이익을 확보할 수 있습니다. 그러나 브랜드 소유주는 시각적인 참신함과 건강 지향적인 인상이 온스당 가치를 능가하는 ‘라이프스타일’을 겨냥한 슬림 캔에 대해서는 소폭의 비용 상승을 감수할 준비가 되어 있습니다. 2030년까지 슬림 캔 시장 점유율은 두 자릿수에 달할 것으로 예상되며, 기존 생산 라인 설비와의 하위 호환성을 유지하면서 포장 포트폴리오의 폭을 넓힐 것입니다. 이처럼 제품 유형의 다양화는 알루미늄 캔 시장 전체의 회복력을 강화하고, 틈새 음료 하위 카테고리 진출을 고려 중인 보틀러에게 전환 비용을 낮추는 결과로 이어집니다.
2025년에는 음료가 전 세계 매출의 48.35%를 차지하며, 이는 탄산음료와 경량 금속 용기 간의 1세기에 걸친 공생 관계를 반영합니다. 탄산 청량음료, 에너지 드링크, 스포츠용 수분 보충 제품은 여전히 주력 상품이며, 알루미늄 캔용 시트 압연 공장에 규모의 경제를 가져다주고 있습니다. 알코올이 함유된 셀처, CBD가 첨가된 토닉, 니트로 커피 등의 신제품이 두 자릿수 성장률로 지속적으로 시장에 출시됨에 따라 음료 카테고리의 폭은 더욱 넓어졌으며, 주류인 탄산음료의 판매가 비수기에 감소하는 시기에도 캔 생산 라인을 거의 풀가동할 수 있게 되었습니다. 한편, 데오도란트부터 조리용 스프레이에 이르기까지의 에어로졸 충전 제품은 연평균 성장률(CAGR) 5.21%를 나타낼 것으로 예측되며, 알루미늄 캔 시장에서 가장 성장세가 두드러지는 분야입니다. 각 브랜드 소유 기업들은 유분, 추진제 또는 알코올을 함유한 배합에서 알루미늄 캔의 내식성을 높이 평가했습니다. 이러한 성분들은 대체재인 양철 캔을 부식시키는 원인이 되기 때문입니다. 벽면 아이론 가공 공정의 개선을 통해 최대 18바의 내압 성능이 실현되어, 무스, 도료, 휘핑크림과 같은 제품 형태로의 확대도 가능해졌습니다.
반려동물사료 및 인간용 통조림은 시장 점유율은 작지만, 재고 회전 및 비상용 비축 구매 행태에 힘입어 연중 안정적인 수요가 예상됩니다. 실간 홀딩스에서는 2024년에 반려동물사료용 캔의 매출이 두 자릿수 성장을 기록했는데, 이는 고품질 반려동물사료와 금속의 산소 차단 특성이 잘 어울린다는 것을 보여줍니다. 의약품 및 영양보조식품 용도는 소용량 알루미늄 바이알이 지닌 위조 방지 기능과 정밀한 정량 공급 기능을 활용한 새로운 성장 분야로 부상하고 있습니다. 전반적으로, 최종 소비자의 다양화는 단일 카테고리의 부진으로부터 알루미늄 캔 시장을 더욱 보호하는 동시에, 제조 간접비를 흡수하고 자산 회수를 가속화하는 여러 성장 축을 제공합니다.
지역별 분석
아시아태평양은 전 세계 매출의 40.74%를 차지하고 있으며, 이 지역의 알루미늄 캔 시장 규모는 중산층의 가처분 소득 증가, 도시 지역의 편의성을 중시하는 문화, 그리고 중국, 인도,일본에서 일회용 플라스틱에 대한 정부 규제를 배경으로 2031년까지 연평균 5.52%의 성장률을 보일 것으로 예측됩니다. 중국은 국내 압연 능력과 활기찬 국내 음료 부문을 바탕으로 선두 자리를 유지하고 있으며, 이 두 가지를 합치면 수입 의존도를 상회합니다. 힌달코(Hindalco)의 100억 달러 규모 확장 계획은 현지 콜라, 에너지 드링크, 알코올이 함유된 청량음료(알코팝) 제조업체들의 알루미늄 캔 채택을 예상하여 인도의 국내 금속 공급을 확대하기 위한 것입니다. 일본의 성숙한 음료 시장은 프리미엄 차와 수제 커피 캔 분야의 혁신을 촉진하고 있으며, 공급처 전환을 추진하는 아사히 그룹의 탄소 중립 공약이 이를 뒷받침하고 있습니다. 동남아시아 역시 마찬가지로 활기를 띠고 있으며, NS-Siam United Steel사는 양철 생산 능력 강화에 5,850만 달러를 투자하는 동시에 해외 캔용 강판 공급업체와 제휴하고 있어, 철강 및 알루미늄 공급망 양쪽 모두에서 혼합형 개발 경로가 시사되고 있습니다.
북미는 절대 규모로는 2위이지만, 단위 출하량은 정체 상태에 있습니다. 대신, 이 지역에서는 더 높은 이익률을 가져다주는 세련되고 슬림한 디자인이나 특수한 감열성 캔으로의 등급 향상에 주력하고 있습니다. 볼(Ball)사는 2023년에 약 490억 개의 용기를 출하하여 지역 알루미늄 캔 시장 점유율의 36%를 차지했을 뿐만 아니라, 회수 시스템의 확대에 따라 재활용 소재 사용률 면에서도 현저한 진전을 이루었습니다. 미국 각 주에서 용기 보증금 제도가 확대된 데 더해, 캐나다에서 EPR(생산자 책임 회수) 제도가 도입됨에 따라 2차 스크랩 공급이 강화되고 있습니다. 이에 따라 캔 본체용 시트의 재활용 소재 함유율은 사상 최고 수준에 도달했으며, 가공업체의 금속 구매 비용은 감소하고 있습니다.
유럽은 성숙한 시장이지만, PET에서 알루미늄으로의 소재 전환을 가속화하기 위해 규제 조치에 크게 의존하고 있습니다. EU의 90% 회수율 목표가 코앞으로 다가온 가운데, 각 브랜드 소유 기업들은 컨버터의 미결제 수주량을 안정화하기 위해 다년 계약을 통한 알루미늄 캔 공급을 확보하고, 규정 준수를 위한 비용을 선지급하고 있습니다. 영국에서 곧 도입될 보증금 환불 제도를 통해 연간 140억 개의 금속 용기가 폐쇄형 유통 경로에 임베디드되어 원료의 안정적인 공급이 확고해질 것입니다. 독일과 프랑스에서는 맥주 분야의 확고한 기반에 그치지 않고, 와인 캔에 대한 시범 사업을 적극적으로 추진하고 있습니다. 이러한 요인들로 인해 유럽의 제조업체들은 새로운 생산 능력을 도입하는 동시에 생산 라인의 가동 속도를 높이고, 현장에서 재생에너지 도입을 추진할 수 있게 되었으며, EU 내 알루미늄 캔 시장은 수량이 완만하게 증가하는 데 그치더라도 시장 가치의 확대가 확실시되고 있습니다.
기타 혜택:
- 엑셀 형식 시장 예측(ME) 시트
- 3개월간의 애널리스트 지원
자주 묻는 질문
목차
제1장 서론
제2장 조사 방법
제3장 주요 요약
제4장 시장 구도
제5장 시장 규모와 성장 예측
제6장 경쟁 구도
제7장 시장 기회와 향후 전망
JHS 26.09.11According to Mordor Intelligence, the global aluminum cans market size in 2026 is estimated at USD 58.13 billion, growing from 2025 value of USD 55.89 billion with 2031 projections showing USD 70.72 billion, growing at 4.01% CAGR over 2026-2031.
This report is Segmented by Type (Standard, Sleek, Slim, and More), End-User Industry (Beverage [Alcoholic Beverages, and Non-Alcoholic Beverages], Food [Canned Food, and Pet Food], Aerosol, and More), Structure (2-Piece, and 3-Piece), Capacity (Up To 250 Ml, 251-500 Ml, and Above 500 Ml), and Geography (North America, Europe, Asia Pacific, and More). The Market Forecasts are Provided in Terms of Value (USD).
Global Aluminum Cans Market Trends and Insights
High Recyclability and Closed-Loop Recovery Systems
Aluminum retains its metallurgical properties indefinitely, enabling genuine material circularity that plastic and glass cannot match. The Can Manufacturers Institute notes that 75% of all aluminum ever produced remains in active use today, and remelting secondary aluminum consumes 95% less energy than primary smelting. European smelters Constellium, Elval, Novelis, and Speira harmonized alloy specifications in April 2024 to allow beverage cans with up to 100% recycled content, cutting carbon emissions by 2.6 tons of CO2 per ton of metal and lowering operating costs for fillers committed to science-based climate targets. U.S. recycling rates slipped to 43% in 2023, but industry-backed investments aim to lift recovery to 70% by 2030 and 90% by 2050, ensuring long-term feedstock security for can plants. Deposit return programs covering more than 40 billion containers annually in Europe, Canada, and select U.S. states materially raise collection volumes, translating into lower scrap premiums and stronger margins for integrated can makers. These structural advantages collectively add 1.2 percentage points to forecast CAGR, cementing aluminum's reputation as the definitive circular beverage package.
Shift from PET/Glass to Aluminum Amid EPR and Plastics-Tax Mandates
Extended Producer Responsibility schemes fundamentally reshape material cost hierarchies. The United Kingdom's 2025 base EPR fee is set at GBP 266 per tonne for aluminum, far below levies applied to PET, multilayer pouches, or difficult-to-recycle flexibles. California expanded its Container Redemption Value program to wine and spirits in January 2024, immediately widening the addressable beverage can universe by 400 million units a year. Meanwhile, EU rules compel 90% collection of single-use beverage containers by 2029, a benchmark that heavily favors aluminum due to its high post-consumer scrap value. Australia will require 80% recycled content in food-grade aluminum by 2040, again reinforcing demand visibility along the entire Pacific Rim. These converging policies collectively boost aluminum's attractiveness and inject an additional 1.5 percentage point lift into medium-term growth forecasts.
Competition from Flexible PET and Carton Formats
Multilayer cartons and lightweight PET bottles continue to dominate price-sensitive segments, especially for private-label juices, dairy drinks, and shelf-stable water, where brand owners prioritize unit cost over recyclability. New glycol-modification techniques have extended PET shelf life for carbonation and sensitive nutrient blends, narrowing aluminum's functional advantage. In developing economies, consumer willingness to pay sustainability premiums remains low, restraining penetration in commoditized categories. However, upcoming bans on non-recyclable plastic formats across the EU and Canada, alongside hard-to-reach EPR thresholds, will gradually erode the competitive edge of flexibles. Net effect is a temporary 0.8% drag on the aluminum cans market CAGR from 2025-2027.
Other drivers and restraints analyzed in the detailed report include:
- Boom in RTD, Craft, and Functional Beverages
- Rapid Growth of Can-Friendly Wine and Spirits Packaging
- Price and Supply Volatility of Primary Aluminum
For complete list of drivers and restraints, kindly check the Table Of Contents.
Segment Analysis
Standard 330-mL and 355-mL bodies retained 55.38% of 2025 revenue, a share underpinned by filling-line compatibility, the highest line speeds, and optimal pallet density. The segment also capitalizes on broad end-user familiarity, which reduces changeover costs for global bottlers. Nevertheless, sleek cans, typified by 250-mL and 310-mL footprints, are advancing swiftly at a 4.06% CAGR thanks to their premium visual ratio and enhanced billboard effect in crowded retail aisles. Beverage formulators serving functional, low-calorie, and alcohol-ready-to-drink segments prize the elongated profile for differentiated shelf blocking and cold-box visibility. Ball's Dynamark variable-graphics platform lets marketers design limited-run art across both standard and sleek formats without line-stopovers, trimming inventory risk and fostering campaign agility. As printing technology lowers per-unit cost, sleek cans should secure incremental penetration in higher-margin SKUs. Specialty shapes and tactile embossing remain nascent but reflect ongoing innovation that further enriches consumer experience. Altogether, the aluminum cans market expects continued coexistence of standard mass-volume formats and sleek premium variants, with the latter responsible for outsized revenue gains relative to capacity installed.
Standard bodies still benefit from superior logistics economics: a 24-count case of 355-mL cans weighs 20% less than an equivalent glass pack, cutting freight emissions and reducing shelf-stack injuries for retailers. Their thicker gauge, tooled since the 1990s, affords converters a stable margin capture even at high metal premiums. Yet brand owners are willing to absorb a slight cost uplift for sleek cans targeting lifestyle positioning where visual disruption and perceived health cues trump per-ounce value. By 2030, sleek units are likely to reach double-digit market share, adding breadth to packaging portfolios while maintaining backward compatibility with legacy line equipment. As such, type diversification reinforces the broader aluminum cans market's resilience and keeps switching costs low for bottlers contemplating entry into niche beverage sub-categories.
Beverages claimed 48.35% of global revenues in 2025, mirroring a century-long symbiosis between carbonated drinks and lightweight metal containers. Carbonated soft drinks, energy shots, and sports hydration products remain workhorse volumes that secure economies of scale for can-sheet rolling mills. Sustained double-digit launches of spiked seltzers, CBD-infused tonics, and nitro-coffee further widen beverage category breadth, allowing can lines to run at near-full utilization even during off-season contractions for mainstream sodas. Meanwhile, aerosol fillings from deodorants to cooking sprays are forecast to post a 5.21% CAGR, marking them the fastest mover within the aluminum cans market. Brand owners appreciate aluminum's corrosion resistance for formulations containing oils, propellants, or alcohols that degrade tinplate alternatives. Enhanced wall ironing processes enable pressure ratings up to 18 bar, paving the way for mousse, paint, and whipped-cream formats as well.
Pet food and human canned foods hold a smaller slice but deliver stable year-round demand anchored in inventory rotation and emergency-stock purchasing behaviors. Silgan Holdings witnessed double-digit pet food can revenue growth in 2024, illustrating premium pet nutrition's alignment with metal's oxygen-barrier features. Pharmaceutical and nutraceutical applications occupy an emerging frontier, leveraging tamper-evidence and precise metering features of small-volume aluminum vials. Collectively, end-user diversification further insulates the aluminum cans market against single-category downturns while providing multiple growth vectors that absorb manufacturing overhead and accelerate asset payback.
Complete Report Scope:
- By Type
- Standard
- Sleek
- Slim
- Other Types
- By End-user Industry
- Beverage
- Alcoholic Beverages
- Non-alcoholic Beverages
- Food
- Canned Food
- Pet Food (Wet and Treats)
- Aerosol
- Other End-user Industries
- Beverage
- By Structure
- 2-piece
- 3-piece
- By Capacity
- Up to 250 ml
- 251 - 500 ml
- More than 500 ml
- By Geography
- North America
- United States
- Canada
- Mexico
- South America
- Brazil
- Argentina
- Chile
- Rest of South America
- Europe
- United Kingdom
- Germany
- France
- Italy
- Spain
- Russia
- Rest of Europe
- Asia Pacific
- China
- India
- Japan
- South Korea
- Australia
- Malaysia
- Rest of Asia Pacific
- Middle East and Africa
- Middle East
- Saudi Arabia
- United Arab Emirates
- Turkey
- Rest of Middle East
- Africa
- South Africa
- Nigeria
- Rest of Africa
- Middle East
- North America
Geography Analysis
Asia Pacific contributes 40.74% of global sales, and its aluminum cans market size is projected to advance 5.52% annually to 2031, underwritten by rising middle-class disposable incomes, urban convenience culture, and authoritative restrictions on single-use plastics in China, India, and Japan. China retains pole position with in-house rolling capacity and a vibrant domestic beverage sector that collectively eclipses import dependence. Hindalco's USD 10 billion expansion amplifies India's domestic metal supply in anticipation of can adoption by local cola, energy drink, and alcopop producers. Japan's mature beverage environment spurs innovation in premium tea and craft coffee cans, aided by Asahi Group's net-zero pledges driving procurement switch-overs. Southeast Asia is equally dynamic; NS-Siam United Steel allocated USD 58.5 million to bolster tinplate output, yet concurrently partners with foreign can-sheet suppliers, signaling blended development paths for both ferrous and aluminum supply chains.
North America ranks second in absolute size, though its unit volumes plateau. Instead, the region focuses on trading up to sleek, slim, and specialty thermochromic cans that fetch higher margins. Ball shipped roughly 49 billion containers in 2023, representing 36% regional aluminum cans market share and delivering significant recycled content progress as reclamation systems scale. U.S. state-level container deposit expansions plus Canada's EPR rollouts strengthen secondary scrap supply, raising recycled content in can body sheet to record highs and lowering metal purchase costs for converters.
Europe, while mature, leans heavily on regulatory levers to accelerate modal shift from PET to aluminum. With the EU's 90% collection target looming, brand owners pre-pay for compliance by booking multi-year aluminum can supply contracts that stabilize converter order books. The United Kingdom's upcoming deposit return program will funnel 14 billion metal containers into closed-loop paths yearly, solidifying feedstock security. Germany and France aggressively promote wine-in-can pilots, expanding beyond beer's established foothold. These factors allow European producers to deploy new capacity while raising line speeds and integrating on-site renewable energy, ensuring that the aluminum cans market in the bloc grows in value even where volumes edge upward modestly.
- Ball Corporation
- Crown Holdings Inc.
- Ardagh Group S.A.
- Silgan Holdings Inc.
- CAN-PACK S.A.
- Novelis Inc.
- ORG Technology Co. Ltd.
- Toyo Seikan Group Holdings Ltd.
- CPMC Holdings Limited
- Baosteel Packaging Co. Ltd.
- Envases Universales
- Tecnocap Group
- CCL Container Inc.
- Massilly Holding S.A.S
- Nampak Ltd.
- Saudi Arabia Packaging Industry (SAPIN)
- Can-One Berhad
- Alltub Deutschland GmbH
- Baofeng Group Co. Ltd.
- Trivium Packaging B.V.
Additional Benefits:
- The market estimate (ME) sheet in Excel format
- 3 months of analyst support
TABLE OF CONTENTS
1 INTRODUCTION
- 1.1 Study Assumptions and Market Definition
- 1.2 Scope of the Study
2 RESEARCH METHODOLOGY
3 EXECUTIVE SUMMARY
4 MARKET LANDSCAPE
- 4.1 Market Overview
- 4.2 Market Drivers
- 4.2.1 High recyclability and closed-loop recovery systems
- 4.2.2 Shift from PET/glass to aluminum amid EPR and plastics-tax mandates
- 4.2.3 Boom in RTD, craft and functional beverages
- 4.2.4 Rapid growth of can-friendly wine and spirits packaging (under-reported)
- 4.2.5 E-commerce's need for dent-resistant primary packaging (under-reported)
- 4.3 Market Restraints
- 4.3.1 Competition from flexible PET and carton formats
- 4.3.2 Price and supply volatility of primary aluminum
- 4.3.3 Regional can-making capacity bottlenecks (under-reported)
- 4.3.4 Rising Scope-3 decarbonization compliance costs (under-reported)
- 4.4 Industry Supply Chain Analysis
- 4.5 Regulatory Landscape
- 4.6 Technological Outlook
- 4.7 Porter's Five Forces Analysis
- 4.7.1 Bargaining Power of Suppliers
- 4.7.2 Bargaining Power of Buyers
- 4.7.3 Threat of New Entrants
- 4.7.4 Threat of Substitutes
- 4.7.5 Intensity of Competitive Rivalry
5 MARKET SIZE AND GROWTH FORECASTS (VALUE)
- 5.1 By Type
- 5.1.1 Standard
- 5.1.2 Sleek
- 5.1.3 Slim
- 5.1.4 Other Types
- 5.2 By End-user Industry
- 5.2.1 Beverage
- 5.2.1.1 Alcoholic Beverages
- 5.2.1.2 Non-alcoholic Beverages
- 5.2.2 Food
- 5.2.2.1 Canned Food
- 5.2.2.2 Pet Food (Wet and Treats)
- 5.2.3 Aerosol
- 5.2.4 Other End-user Industries
- 5.2.1 Beverage
- 5.3 By Structure
- 5.3.1 2-piece
- 5.3.2 3-piece
- 5.4 By Capacity
- 5.4.1 Up to 250 ml
- 5.4.2 251 - 500 ml
- 5.4.3 More than 500 ml
- 5.5 By Geography
- 5.5.1 North America
- 5.5.1.1 United States
- 5.5.1.2 Canada
- 5.5.1.3 Mexico
- 5.5.2 South America
- 5.5.2.1 Brazil
- 5.5.2.2 Argentina
- 5.5.2.3 Chile
- 5.5.2.4 Rest of South America
- 5.5.3 Europe
- 5.5.3.1 United Kingdom
- 5.5.3.2 Germany
- 5.5.3.3 France
- 5.5.3.4 Italy
- 5.5.3.5 Spain
- 5.5.3.6 Russia
- 5.5.3.7 Rest of Europe
- 5.5.4 Asia Pacific
- 5.5.4.1 China
- 5.5.4.2 India
- 5.5.4.3 Japan
- 5.5.4.4 South Korea
- 5.5.4.5 Australia
- 5.5.4.6 Malaysia
- 5.5.4.7 Rest of Asia Pacific
- 5.5.5 Middle East and Africa
- 5.5.5.1 Middle East
- 5.5.5.1.1 Saudi Arabia
- 5.5.5.1.2 United Arab Emirates
- 5.5.5.1.3 Turkey
- 5.5.5.1.4 Rest of Middle East
- 5.5.5.2 Africa
- 5.5.5.2.1 South Africa
- 5.5.5.2.2 Nigeria
- 5.5.5.2.3 Rest of Africa
- 5.5.5.1 Middle East
- 5.5.1 North America
6 COMPETITIVE LANDSCAPE
- 6.1 Market Concentration
- 6.2 Strategic Moves
- 6.3 Market Share Analysis
- 6.4 Company Profiles (includes Global level Overview, Market level overview, Core Segments, Financials as available, Strategic Information, Market Rank/Share for key companies, Products and Services, and Recent Developments)
- 6.4.1 Ball Corporation
- 6.4.2 Crown Holdings Inc.
- 6.4.3 Ardagh Group S.A.
- 6.4.4 Silgan Holdings Inc.
- 6.4.5 CAN-PACK S.A.
- 6.4.6 Novelis Inc.
- 6.4.7 ORG Technology Co. Ltd.
- 6.4.8 Toyo Seikan Group Holdings Ltd.
- 6.4.9 CPMC Holdings Limited
- 6.4.10 Baosteel Packaging Co. Ltd.
- 6.4.11 Envases Universales
- 6.4.12 Tecnocap Group
- 6.4.13 CCL Container Inc.
- 6.4.14 Massilly Holding S.A.S
- 6.4.15 Nampak Ltd.
- 6.4.16 Saudi Arabia Packaging Industry (SAPIN)
- 6.4.17 Can-One Berhad
- 6.4.18 Alltub Deutschland GmbH
- 6.4.19 Baofeng Group Co. Ltd.
- 6.4.20 Trivium Packaging B.V.
7 MARKET OPPORTUNITIES AND FUTURE OUTLOOK
- 7.1 White-space and Unmet-Need Assessment