|
시장보고서
상품코드
2124173
협대역 IoT(NB-IoT) 시장 : 점유율 분석, 업계 동향과 통계, 성장 예측(2026-2031년)Narrowband IoT - Market Share Analysis, Industry Trends & Statistics, Growth Forecasts (2026 - 2031) |
||||||
 Mordor Intelligence
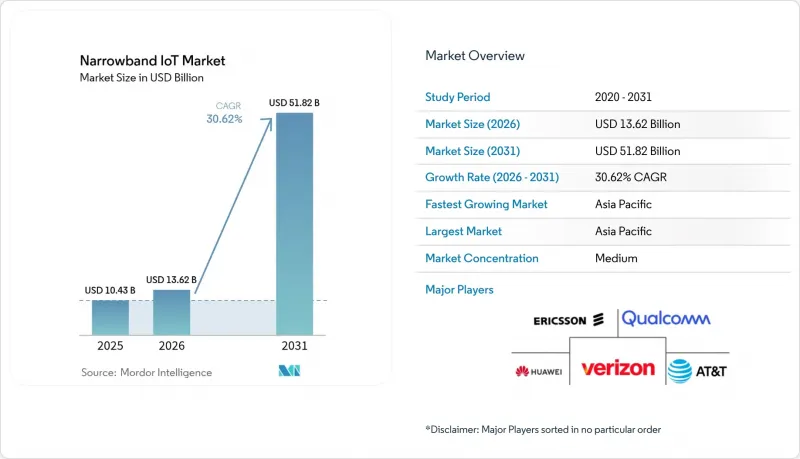
Mordor Intelligence에 의하면, 2026년 협대역 IoT 시장 규모는 136억 2,000만 달러로 추정되고 있어 2025년 104억 3,000만 달러에서 확대해, 2031년에는 518억 2,000만 달러에 이를 것으로 예측됩니다.
2026년부터 2031년까지 연평균 성장률(CAGR)은 30.62%에 달할 전망입니다.
본 보고서는 구성 요소(네트워크, 모듈), 도입 형태(스탠드얼론, 인밴드, 가드밴드), 기기 유형(웨어러블, 트래커,스마트 계량기, 스마트 조명, 경보·감지기, 기타), 용도(스마트 시티, 운송 및 물류, 에너지·유틸리티, 소매, 기타), 지역별로 분류되어 있습니다.
전 세계 협대역 IoT 시장 동향 및 인사이트
초저전력 소비로 배터리 수명이 연장됩니다.
eDRX, PSM 및 조기 데이터 전송을 활용함으로써 에너지 소비와 지연을 종합적으로 줄여, 단일 배터리로 최대 10년간 기기를 작동시킬 수 있습니다. 실지 시험에 따르면, 사전 설정된 업링크 리소스를 통해 트래픽이 집중되는 상황에서도 에너지 소비를 2.5배 줄이고 배터리 수명을 1.6배 연장할 수 있는 것으로 나타났습니다. 배터리 교체 비용이 하드웨어 비용을 초과하는 경우가 많기 때문에 이러한 전력 특성은 유틸리티 사업의 경제성을 완전히 바꿔놓을 것입니다. 셀당 5만 대의 기기를 지원함으로써 내구성을 저해하지 않고 규모를 확대하여, 원격 계측 분야에서의 NB-IoT 시장 보급을 뒷받침하고 있습니다.
NB-IoT 모듈의 평균 판매 가격(ASP)이 3달러 미만으로 하락하며 보급이 가속화
제조 규모 확대와 통합 칩셋 채택으로 모듈의 평균 가격은 3달러 미만으로 떨어졌으며, 환경 센싱 및 자산 추적 등 비용에 민감한 분야로의 진출이 가능해졌습니다. 또한월이용료도 0.50달러까지 낮아져, NB-IoT 시장 제안은 면허가 필요 없는 LPWAN 대체 기술과 동등한 경쟁력을 확보하고 있습니다. 월드 모드 모뎀은 현재 전 세계의 주파수 대역을 지원하며, OEM 제조업체는 한 번의 인증으로 전 세계에 출하할 수 있게 되어 신흥 지역에서의 기기 출하량 확대를 가속화하고 있습니다.
LTE-M 및 비면허 LPWAN(LoRa, Sigfox)과의 경쟁
AT&T의 NB-IoT 단계적 폐지 및 LTE-M으로의 전환은 이동 자산에 대한 서비스 제공에 있어 통신 사업자가 더 높은 데이터 전송 속도와 뛰어난 이동성을 중시하고 있음을 여실히 보여줍니다. 2030년까지 LoRa 연결 수가 13억 건에 달할 것이라는 예측은 완벽한 제어가 필요한 기업들에게 사설 네트워크의 매력이 두드러지고 있음을 보여줍니다. 이러한 두 가지 경쟁 요인으로 인해, 처리량 향상이 실현되지 않는 한 NB-IoT 시장의 초점은 고정형이며 광범위한 커버리지가 필요한 이용 사례로 한정될 것입니다.
부문 분석
통신 사업자들이 막대한 기기 밀도에 대응하기 위해 코어 네트워크와 무선 장비를 업그레이드한 결과, 2025년 매출의 62.35%를 네트워크 인프라가 차지했습니다. 이러한 지출은 커버리지와 용량 확충이 기기 대수를 상회하는 NB-IoT 시장의 초기 단계를 반영하고 있습니다. 한편, 모듈 시장은 평균 판매 가격(ASP) 하락으로 인해 가치가 하류 OEM 제조업체로 이동함에 따라 2031년까지 연평균 성장률(CAGR) 32.55%로 확대될 것으로 예측됩니다. 통합형 SoC는 부품 원가를 절감하고 인증 절차를 간소화함으로써 3달러 미만의 가격 책정이 가능해져 대량 도입을 촉진할 것입니다. 클라우드 파트너십을 통한 종량제 5G 코어 서비스를 통해 통신 사업자는 자본 지출(CAPEX)을 연기할 수 있게 되어, 예측 기간 동안 지출 구성이 모듈 및 백엔드 분석으로 이동하게 될 것입니다.
점차 성숙해 가는 공급망에서는 현재 칩셋 레퍼런스 디자인과 턴키 방식의 안테나 패키지가 제공되고 있어 신규 진입 장벽이 낮아지고 있습니다. 따라서 NB-IoT 업계는 용량 확대에서 용도 상용화로 초점을 옮기고 있으며, 수익이 인프라에서 디바이스 및 데이터 서비스로 서서히 이동하고 있음이 부각되고 있습니다.
2025년에는 유틸리티 및 산업 사용자들이 전용 주파수 대역에서 예측 가능한 성능을 선호함에 따라, 독립형 방식의 도입이 매출의 46.65%를 차지했습니다. 중국의 전국적인 스마트 계량기 도입 캠페인이 이러한 추세를 뒷받침하며, 독립 통신 사업자들에 의한 NB-IoT 시장의 초기 성장을 공고히 했습니다. 통신 사업자가 미사용 LTE 버퍼를 재사용함에 따라 가드밴드 전략은 연평균 성장률(CAGR) 34.10%로 가속화되고 있으며, 이는 스펙트럼 효율을 우선시하는 유럽의 정책과 일치합니다. 가드밴드가 부족한 지역에서는 인밴드 방식이 중간적인 해결책으로 기능하며, 커버리지와 레거시 트래픽 간의 공존 균형을 맞추고 있습니다.
통신 사업자들은 예상되는 단말 밀도를 바탕으로 주파수 대역의 가치를 평가하는 경향이 강해지고 있으며, 중규모 시장에서 가드밴드 채택을 추진하고 있습니다. 한편, 미션 크리티컬 용도에서는 격리 효과의 이점 덕분에 독립형 설계가 유지되고 있습니다. 이러한 양면성은 앞으로도 지속되어, 성능과 자산 활용을 모두 극대화하는 지역별 도입 형태를 형성해 나갈 것입니다.
지역별 분석
2025년에는 아시아태평양이 매출의 51.75%를 차지했습니다. 이는 차이나모바일이 8억 9,000만 건의 연결을 관리하고 있으며, 2023년까지 5G 보급률이 90%에 도달했기 때문입니다. 산업 정책과 대규모 공공 부문 입찰을 통해 예측 가능한 수요 파이프라인이 형성되어 공급업체의 규모 확대가 촉진되고 있습니다. 인도와 일본은 현재 전국 규모의 스마트 계량기 프로젝트를 시범 운영 중이며, 이 프로젝트들이 해당 지역에서 두 번째 성장 동력으로서의 입지를 확립해 가고 있습니다. 스탠드얼론(SA) 방식의 도입이 성숙해짐에 따라, 통신 사업자들은 새로운 주파수 경매를 실시하지 않고도 급증하는 단말기 수에 대응하기 위해 가드밴드 최적화로 초점을 옮기고 있습니다.
북미에서는 AT&T의 NB-IoT 철수를 계기로 전략적 재편이 진행되고 있지만, T-Mobile과 Verizon은 계속해서 전국 규모의 확장을 지원하고 있어, 그 결과 경쟁 구도는 제각각입니다. 수도·가스 계량기 교체에 대한 정부의 인프라 보조금은 업계 재편의 위험을 부분적으로 상쇄하고 있습니다. 새롭게 도입된 RedCap 시범 운영은 미래를 내다보는 비전을 제시하고 있으며, 중기적으로 통신 사업자들의 노력을 안정화시킬 가능성이 있습니다.
유럽에서는 에너지 효율 및 환경 모니터링에 관한 규제 요건을 기반으로 꾸준한 성장을 유지하고 있습니다. 통신 사업자들은 주파수 대역이 세분화되어 있음에도 불구하고 NB-IoT를 국경을 초월한 로밍 계약에 포함시키고 있으며, 가드밴드 도입을 통해 희소한 1GHz 미만 주파수 대역을 최대한 활용하고 있습니다. 보다폰의 멸종 위기종 추적과 같은 환경 보전 분야의 민관 협력 프로젝트는 도입을 지속시키는 데 사회적 영향력을 미치는 이용 사례를 보여주고 있습니다.
기타 혜택:
- 엑셀 형식 시장 예측(ME) 시트
- 3개월간의 애널리스트 지원
자주 묻는 질문
목차
제1장 서론
제2장 조사 방법
제3장 주요 요약
제4장 시장 구도
제5장 시장 규모와 성장 예측
제6장 경쟁 구도
제7장 시장 기회와 향후 전망
JHS 26.09.11According to Mordor Intelligence, narrowband IoT market size in 2026 is estimated at USD 13.62 billion, growing from 2025 value of USD 10.43 billion with 2031 projections showing USD 51.82 billion, growing at 30.62% CAGR over 2026-2031.
This report is Segmented by Component (Network, Module), Deployment (Standalone, In-Band, Guard-Band), Device Type (Wearables, Tracker, Smart Meter, Smart Lighting, Alarm and Detector, Others), Application (Smart Cities, Transportation & Logistics, Energy and Utilities, Retail, and More), and Geography.
Global Narrowband IoT Market Trends and Insights
Ultra-low power consumption extends battery life
Devices can operate for up to 10 years on a single battery by leveraging eDRX, PSM, and Early Data Transmission that collectively cut energy draw and latency. Field tests show Pre-Configured Uplink Resources lower energy use 2.5 times and lengthen battery life 1.6 times under dense traffic. This power profile reshapes utility economics because battery replacement often exceeds hardware cost. Support for 50,000 devices per cell adds scale without compromising endurance, validating NB-IoT market adoption across remote metering.
Falling NB-IoT module ASPs below USD 3, enabling mass adoption
Manufacturing scale and integrated chipsets pulled average module prices beneath USD 3.00, unlocking cost-sensitive sectors such as environmental sensing and asset tracking. Subscription fees have also fallen to USD 0.50 per month, giving NB-IoT market propositions parity with unlicensed LPWAN alternatives. World-mode modems now deliver global band support, letting OEMs certify once and ship worldwide, accelerating device volumes in emerging regions.
Competition from LTE-M and unlicensed LPWAN (LoRa, Sigfox)
AT&T's sunset of NB-IoT and migration to LTE-M highlights operator preference for higher data rates and better mobility when serving moving assets. LoRa's forecast of 1.3 billion connections by 2030 underscores the private-network attraction for enterprises that need full control. This dual competitive front narrows the NB-IoT market focus to stationary, deep-coverage use cases unless throughput improvements materialise.
Other drivers and restraints analyzed in the detailed report include:
- Government-mandated LPWAN roll-outs for smart metering
- Government incentives for smart agriculture and rural digitisation
- Limited downlink throughput is hindering OTA firmware updates
For complete list of drivers and restraints, kindly check the Table Of Contents.
Segment Analysis
Network infrastructure generated 62.35% of 2025 revenue as operators upgraded cores and radios to support massive device density. This spending reflects the early phase of the NB-IoT market when coverage and capacity build outweigh device volumes. Modules, however, are projected to compound at 32.55% annually through 2031 as falling ASPs shift value downstream to OEMs. Integrated SoCs reduce bill-of-materials and simplify certification, enabling sub-USD 3.00 price points that catalyse high-volume roll-outs. Consumption-based 5G core services from cloud partnerships let carriers defer capex, altering the spending mix toward modules and backend analytics during the forecast window.
A maturing supply chain now offers chipset reference designs and turnkey antenna packages, lowering barriers for new entrants. The NB-IoT industry thus pivots from capacity expansion to application enablement, underscoring a gradual revenue transition from infrastructure to devices and data services.
Stand-alone deployments held 46.65% revenue in 2025 because utilities and industrial users favour predictable performance in dedicated spectrum. China's national smart-meter campaign reinforced this preference, anchoring early NB-IoT market growth on independent carriers. Guard-band strategies are accelerating at 34.10% CAGR as operators reclaim unused LTE buffers, aligning with European policy that prioritises spectral efficiency. In-band options act as midway solutions where guard bands are scarce, balancing coverage with legacy traffic coexistence.
Operators increasingly model spectrum value against expected device density, pushing guard-band adoption in markets with moderate scale. Conversely, mission-critical applications retain stand-alone designs due to isolation benefits. This duality will persist, shaping region-specific deployment blends that maximise both performance and asset utilisation.
Complete Report Scope:
- By Component
- Network
- Core Network
- Radio Access Network (RAN)
- Module
- Baseband Chipsets
- Integrated SoCs
- Network
- By Deployment
- Stand-alone
- In-band
- Guard-band
- By Device Type
- Wearables
- Healthcare Wearables
- Consumer Wearables
- Trackers
- Logistics Trackers
- Smart Meters
- Electricity Meters
- Gas and Water Meters
- Smart Lighting
- Alarms and Detectors
- Smoke Detectors
- Intrusion Alarms
- Wearables
- By Application
- Smart Cities
- Transportation and Logistics
- Energy and Utilities
- Retail and Vending
- Agriculture and Livestock
- Industrial Automation
- By Geography
- North America
- United States
- Canada
- Mexico
- South America
- Brazil
- Argentina
- Rest of South America
- Europe
- Germany
- United Kingdom
- France
- Italy
- Spain
- Rest of Europe
- Asia-Pacific
- China
- India
- Japan
- South Korea
- Rest of Asia-Pacific
- Middle East and Africa
- Middle East
- United Arab Emirates
- Saudi Arabia
- Turkey
- Rest of Middle East
- Africa
- South Africa
- Nigeria
- Kenya
- Rest of Africa
- Middle East
- North America
Geography Analysis
Asia Pacific accounted for 51.75% revenue in 2025, owing to China Mobile's 890 million managed connections and a 90% 5G penetration rate achieved by 2023. Industrial policy and massive public-sector tenders create predictable demand pipelines that foster supplier scale. India and Japan now pilot nationwide smart-meter projects, positioning them as secondary growth engines within the region. As stand-alone deployments mature, carriers pivot to guard-band optimisation to accommodate surging device counts without fresh spectrum auctions.
North America faces strategic realignment after AT&T's NB-IoT exit, yet T-Mobile and Verizon continue to support nationwide footprints, resulting in a mixed competitive landscape. Government infrastructure grants for water and gas meter upgrades partially offset consolidation risk. Emerging RedCap trials provide a future-proofing narrative that could stabilise carrier commitments over the medium term.
Europe maintains steady growth anchored in regulatory mandates for energy efficiency and environmental monitoring. Operators integrate NB-IoT into cross-border roaming arrangements despite fragmented spectrum, while guard-band deployments maximise scarce sub-1 GHz assets. Public-private projects in conservation, such as Vodafone's endangered species tracking, demonstrate social-impact use cases that sustain adoption.
- Huawei Technologies Co., Ltd
- Ericsson
- Nokia Corporation
- Qualcomm Technologies
- MediaTek Inc.
- Intel Corporation
- Sony Semiconductor (Altair Chipset)
- Sierra Wireless
- Telit IoT Platforms
- Quectel Wireless Solutions
- u-blox AG
- Fibocom Wireless
- China Mobile
- China Telecom
- Vodafone Group Plc
- Deutsche Telekom AG
- ATandT Inc.
- Verizon Communications Inc.
- Telefonica S.A.
- Orange S.A.
- T-Mobile US, Inc.
- Twilio Inc.
Additional Benefits:
- The market estimate (ME) sheet in Excel format
- 3 months of analyst support
TABLE OF CONTENTS
1 INTRODUCTION
- 1.1 Study Assumptions and Market Definition
- 1.2 Scope of the Study
2 RESEARCH METHODOLOGY
3 EXECUTIVE SUMMARY
4 MARKET LANDSCAPE
- 4.1 Market Overview
- 4.2 Market Drivers
- 4.2.1 Ultra-low power consumption extending battery life
- 4.2.2 Falling NB-IoT module ASPs below USD 3, enabling mass adoption
- 4.2.3 Government-mandated LPWAN roll-outs for smart metering
- 4.2.4 Government incentives for smart agriculture and rural digitisation
- 4.2.5 Satellite-augmented NB-IoT for remote asset connectivity
- 4.2.6 5G NR-RedCap roadmap ensuring long-term technology continuity
- 4.3 Market Restraints
- 4.3.1 Competition from LTE-M and unlicensed LPWAN (LoRa, Sigfox)
- 4.3.2 Limited downlink throughput hindering OTA firmware updates
- 4.3.3 Fragmented spectrum allocations complicating global roaming
- 4.3.4 Unproven revenue-sharing models slowing ecosystem monetisation
- 4.4 Value/Supply-Chain Analysis
- 4.5 Regulatory Landscape
- 4.6 Technological Outlook
- 4.7 Porter's Five Forces Analysis
- 4.7.1 Threat of New Entrants
- 4.7.2 Bargaining Power of Buyers/Consumers
- 4.7.3 Bargaining Power of Suppliers
- 4.7.4 Threat of Substitute Products
- 4.7.5 Intensity of Competitive Rivalry
- 4.8 Assessment of COVID-19 Impact
5 MARKET SIZE AND GROWTH FORECASTS (VALUE)
- 5.1 By Component
- 5.1.1 Network
- 5.1.1.1 Core Network
- 5.1.1.2 Radio Access Network (RAN)
- 5.1.2 Module
- 5.1.2.1 Baseband Chipsets
- 5.1.2.2 Integrated SoCs
- 5.1.1 Network
- 5.2 By Deployment
- 5.2.1 Stand-alone
- 5.2.2 In-band
- 5.2.3 Guard-band
- 5.3 By Device Type
- 5.3.1 Wearables
- 5.3.1.1 Healthcare Wearables
- 5.3.1.2 Consumer Wearables
- 5.3.2 Trackers
- 5.3.2.1 Logistics Trackers
- 5.3.3 Smart Meters
- 5.3.3.1 Electricity Meters
- 5.3.3.2 Gas and Water Meters
- 5.3.4 Smart Lighting
- 5.3.5 Alarms and Detectors
- 5.3.5.1 Smoke Detectors
- 5.3.5.2 Intrusion Alarms
- 5.3.1 Wearables
- 5.4 By Application
- 5.4.1 Smart Cities
- 5.4.2 Transportation and Logistics
- 5.4.3 Energy and Utilities
- 5.4.4 Retail and Vending
- 5.4.5 Agriculture and Livestock
- 5.4.6 Industrial Automation
- 5.5 By Geography
- 5.5.1 North America
- 5.5.1.1 United States
- 5.5.1.2 Canada
- 5.5.1.3 Mexico
- 5.5.2 South America
- 5.5.2.1 Brazil
- 5.5.2.2 Argentina
- 5.5.2.3 Rest of South America
- 5.5.3 Europe
- 5.5.3.1 Germany
- 5.5.3.2 United Kingdom
- 5.5.3.3 France
- 5.5.3.4 Italy
- 5.5.3.5 Spain
- 5.5.3.6 Rest of Europe
- 5.5.4 Asia-Pacific
- 5.5.4.1 China
- 5.5.4.2 India
- 5.5.4.3 Japan
- 5.5.4.4 South Korea
- 5.5.4.5 Rest of Asia-Pacific
- 5.5.5 Middle East and Africa
- 5.5.5.1 Middle East
- 5.5.5.1.1 United Arab Emirates
- 5.5.5.1.2 Saudi Arabia
- 5.5.5.1.3 Turkey
- 5.5.5.1.4 Rest of Middle East
- 5.5.5.2 Africa
- 5.5.5.2.1 South Africa
- 5.5.5.2.2 Nigeria
- 5.5.5.2.3 Kenya
- 5.5.5.2.4 Rest of Africa
- 5.5.5.1 Middle East
- 5.5.1 North America
6 COMPETITIVE LANDSCAPE
- 6.1 Market Concentration
- 6.2 Strategic Moves
- 6.3 Market Share Analysis
- 6.4 Company Profiles (includes Global level Overview, Market level overview, Core Segments, Financials as available, Strategic Information, Market Rank/Share, Products and Services, Recent Developments)
- 6.4.1 Huawei Technologies Co., Ltd
- 6.4.2 Ericsson
- 6.4.3 Nokia Corporation
- 6.4.4 Qualcomm Technologies
- 6.4.5 MediaTek Inc.
- 6.4.6 Intel Corporation
- 6.4.7 Sony Semiconductor (Altair Chipset)
- 6.4.8 Sierra Wireless
- 6.4.9 Telit IoT Platforms
- 6.4.10 Quectel Wireless Solutions
- 6.4.11 u-blox AG
- 6.4.12 Fibocom Wireless
- 6.4.13 China Mobile
- 6.4.14 China Telecom
- 6.4.15 Vodafone Group Plc
- 6.4.16 Deutsche Telekom AG
- 6.4.17 ATandT Inc.
- 6.4.18 Verizon Communications Inc.
- 6.4.19 Telefonica S.A.
- 6.4.20 Orange S.A.
- 6.4.21 T-Mobile US, Inc.
- 6.4.22 Twilio Inc.
7 MARKET OPPORTUNITIES AND FUTURE OUTLOOK
- 7.1 White-space and Unmet-Need Assessment