|
시장보고서
상품코드
2124329
고체 전해질 시장 : 시장 점유율 분석, 업계 동향 및 통계, 성장 예측(2026-2031년)Solid Electrolyte - Market Share Analysis, Industry Trends & Statistics, Growth Forecasts (2026 - 2031) |
||||||
 Mordor Intelligence
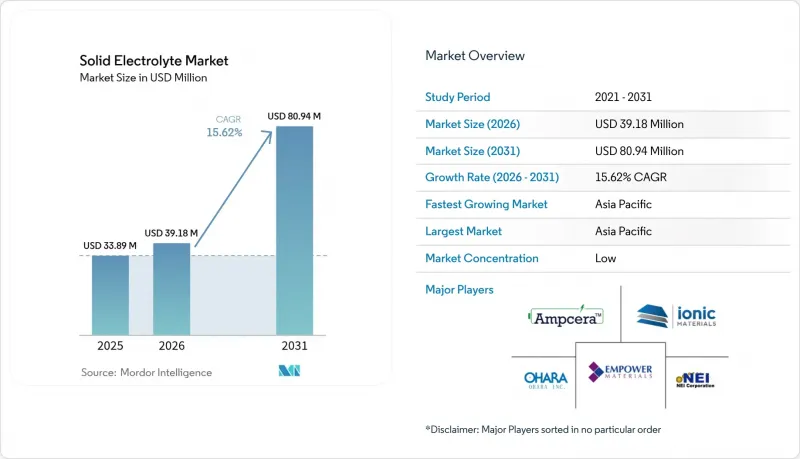
Mordor Intelligence에 의하면, 고체 전해질 시장 규모는 2025년 3,389만 달러로 평가되었고, 2026년에는 3,918만 달러로 추정되고, 2026-2031년 CAGR 15.62%로 성장할 전망이며, 2031년에는 8,094만 달러에 달할 것으로 예측됩니다.
본 보고서는 재료 유형별(황화물 세라믹, 할로겐화물 세라믹 등), 배터리 유형별(EV 구동용 배터리 등), 제조 방법별(테이프 캐스팅/콜드 프레스, 적층 조형/3D 프린팅 등), 두께별(25µm 미만, 25-100µm, 100µm 이상), 최종 이용 산업별(자동차, 의료기기 등), 지역별(북미, 유럽, 아시아태평양 등)로 분류되어 있습니다.
세계의 고체 전해질 시장 동향 및 인사이트
EV 안전 규제가 고체 전해질 기술로 전환
유럽연합(EU)의 새로운 배터리 지침에서는 엄격한 열폭주 방지가 요구되고 있으나, 이 기준은 액체가 충전된 리튬 이온 배터리보다 고체 전해질이 더 쉽게 충족할 수 있습니다. 일본은 2024년 말, 도요타의 고체 배터리 전기차(EV) 프로그램에 대해 안전 승인을 발급하며, 고에너지 용도에서 세라믹 분리막에 대한 규제 당국의 이해를 보여주었습니다. 항공 분야에서는 미국 연방항공청(FAA)이 차세대 항공기용 동력 시스템의 저가연성 목표를 달성하기 위해 고체 전해질 평가를 진행하고 있습니다. 이러한 움직임은 전 세계 규제 당국이 공통된 안전 이념 아래 발을 맞추고 있음을 보여주며, 이에 따라 향후 플랫폼 설계에서 고체 전해질 기술의 위상이 ‘선택 사항’에서 ‘필수 사항’으로 높아지고 있습니다. 따라서 자동차 제조업체들은 성능 향상을 위해서뿐만 아니라, 향후 각 시장에서 형식 승인을 획득하기 위해서도 고체 전해질을 채택하고 있습니다.
OEM의 연구 개발 : 500 Wh/kg을 넘는 배터리를 둘러싼 경쟁
2024년 CATL이 발표한 응축 상태의 셀 시제품이 보여준 약 500 Wh/kg이라는 획기적인 에너지 밀도는 고체 전해질이 초경량 차량용 배터리 팩을 실현하는 기반임을 입증하고 있습니다. 그 후, 711 Wh/kg을 향해 계속 상승하고 있는 실험실 내 실증 결과는 이론적 상한선이 급속히 확대되고 있음을 강조하고 있습니다. 이 노력에는 15분 미만의 충전 속도 목표도 포함되어 있으며, 이를 위해서는 세라믹 및 할로겐화물 전해질이 제공하는 내열성이 요구됩니다. 경쟁 OEM 업체들은 현재 이 화학 성분을 2027년부터 2030년까지의 제품 주기의 핵심으로 삼고 있으며, 황화물, 할로겐화물, 산화물 소재의 조달을 강화하는 동시에 수십억 달러 규모공급 계약을 추진하고 있습니다.
소결 및 증착 공정에 필요한 고액의 설비 투자
기존의 황화물 및 산화물 세라믹의 경우, 900°C를 초과하는 소성 사이클이 필요한 경우가 많아, 중규모 생산 라인에서도 설비 투자가 5,000만 달러를 초과할 가능성이 있습니다. 펜실베이니아 주립대학교의 저온 소결법은 공정 온도를 150°C까지 낮춤으로써 에너지 수요와 소성로 투자 비용을 모두 절감합니다(PSU.EDU). 초기 기술경제성 평가에 따르면, 박형 리튬 금속 음극의 비용은 1제곱미터당 4.3달러로 산출되었으며, 목표인 2.1달러에 비해 여전히 경제적 격차가 존재합니다. 이는 제조업체들이 해소하고자 하는 과제를 보여줍니다. LLZO 형상에 VAT 광중합 기술을 적용함으로써 부품을 니어넷쉐이프(near-net-shape)로 성형할 수 있어, 여러 연마 및 연삭 공정을 생략하고 인프라 요구 사항을 더욱 줄일 수 있습니다.
부문 분석
황화물 세라믹는 Li6PS5Cl의 전도도가 1 mS cm-1을 초과하고 테이프 캐스팅 공법이 충분히 확립되어 있다는 강점을 바탕으로, 2025년에는 고체 전해질 시장에서 42.12%의 점유율을 차지했습니다. 그러나 이 부문은 비용 및 습기에 대한 민감성 등의 과제에 직면해 있으며, 이러한 요인들이 할로겐화물 및 산화물 옵션의 병행 개발을 촉진하고 있습니다. 할로겐화물 세라믹는 2025년 시점에서 시장 점유율이 소규모에 그치고 있지만, 뛰어난 산화 안정성으로 인해 고전압 양극과의 조합이 용이해짐에 따라 2031년까지 연평균 성장률(CAGR) 18.74%라는 가장 높은 성장률을 나타낼 것으로 예측됩니다. 연구 개발(R&D) 분야에서는 흡습에 의한 열화 없이 높은 전도성을 유지할 수 있는 Cl-, Br-, F-를 풍부하게 함유한 골격 구조에 초점이 맞추어져 있습니다.
각 제조업체는 특정 최종 용도에 맞는 화학 조성을 선정할 때, 내산화성, 원자재의 입수 가능성, 그리고 가공 수율을 종합적으로 검토하고 있습니다. Ta가 도핑된 LLZO 등의 산화물 가넷은 소결 온도가 높다는 특징이 있어, 습기 침투 위험이 높은 분야에서는 여전히 중요한 역할을 하고 있습니다. 폴리머 및 유리 세라믹 하이브리드는 틈새 시장인 플렉서블 전자 분야에서 활용되고 있지만, 판매량의 주요 견인력으로는 여전히 부차적인 위치에 머물러 있습니다. 이러한 요인들이 복합적으로 작용하여, 고체 전해질 시장 전체는 적어도 4가지 주요 화학 조성으로 분산되어 있으며, 공급의 탄력성을 확보하는 동시에 지적 재산권을 둘러싼 경쟁을 촉진하고 있습니다.
2025년에는 전기차용 트랙션 팩이 고체 전해질 시장 규모의 52.40%를 차지한 것으로 평가되었으며, 전 세계 자동차 제조업체들이 2020년대 후반 출시를 목표로 고체 배터리 탑재 모델 계획을 수립하고 있어 연평균 성장률(CAGR) 18.52%로 확대될 것으로 전망됩니다. 60-100kWh 차량용 팩에 필요한 규모 요건으로 인해 공급업체들은 기가와트시(GWh) 규모의 생산 능력을 갖춘 공장을 목표로 할 수밖에 없으며, 그 결과 비용 절감 효과가 다른 소규모 부문으로도 파급될 것입니다. 소비자용 전자기기는 계속해서 안정적인 점유율을 유지하고 있으며, 스마트폰, 노트북, AR 기기가 폼 팩터의 장점과 휴대용 배터리에 대한 엄격한 안전 기준에 힘입어 그 선두 역할을 하고 있습니다.
나머지 분야는 고정형 에너지 저장, 항공우주, 의료용 임플란트, 산업용 IoT가 차지하고 있으며, 각각 사이클 수명, 내열성, 생체 적합성, 소형화 등 특정 특성을 중시하고 있습니다. 자동차 분야의 연구개발에서 파생된 기술의 확산으로 인해 이러한 2차 분야의 성능 향상이 가속화되고 있으며, 더 광범위한 고체 전해질 시장 전체의 소재 공급 및 기기 규격을 결정하는 데 있어 전기차(EV) 프로그램이 수행하는 주도적인 역할이 더욱 강화되고 있습니다.
지역별 분석
아시아태평양은 2025년에 매출의 57.75%를 차지했으며, 연평균 성장률(CAGR) 17.65%를 달성할 것으로 예측됩니다. 이는 중국, 일본, 한국에 집중되어 있으며, 리튬 원료 정제, 세라믹 분말 합성, 셀 조립, 모듈 통합을 아우르는 수직 통합형 공급망에 의해 주도되고 있습니다. CATL, 파나소닉, LG 에너지 솔루션 및 일련의 소재 제조업체들이 투자 계획을 조정하고 있으며, 이로 인해 지역 전체의 비용 하한선이 낮게 유지되고 있습니다. 한국의 350억 달러 규모 배터리 이니셔티브와 같은 정부 프로그램도 이 지역의 성장 궤도를 뒷받침하고 있습니다.
북미에서는 미국의 ‘인플레이션 감축법’과 에너지부의 보조금을 배경으로, 세액 공제 대상인 세라믹 분리막 및 황화물 분말 공장 건설이 촉진되면서 시장이 가속화되고 있습니다. 자동차 제조업체와 대학의 스핀오프 기업을 연결하는 파트너십은 제조 수율 격차 해소와 국내 원자재 공급원 확보에 주력하고 있습니다. 2030년까지 이 지역에서는 여러 기가와트 규모의 고체 전해질 생산 라인이 가동될 것이며, 세계 공급에서 차지하는 비중이 현재의 한 자릿수에서 20%대 초반으로 상승할 가능성이 있습니다.
유럽은 ‘유럽 배터리 규정’ 및 각국 정부가 지원하는 합작 공장을 통해 전략적 자립을 추구하고 있습니다. 폭스바겐의 배터리 부문인 PowerCo는 고체 전해질의 지적 재산권을 라이선싱하고, 연간 생산 능력 40GWh 규모의 독일 및 스웨덴 공장 건설 계획을 추진하고 있습니다. 지속가능성, 순환형 경제, 그리고 지역 공급망을 중시하는 정책에 힘입어, 수명이 길고 재활용성이 향상된 고체 배터리 기술이 주목받고 있습니다. 이러한 움직임을 종합해 보면, 아시아가 우위를 유지하면서도 대서양을 사이에 둔 유력한 경쟁자들이 부상하는 등, 세력도의 재균형이 시사되고 있습니다.
기타 혜택 :
- 엑셀 형식 시장 예측(ME) 시트
- 3개월간의 애널리스트 지원
자주 묻는 질문
목차
제1장 서론
제2장 조사 방법
제3장 주요 요약
제4장 시장 구도
제5장 시장 규모 및 성장 예측
제6장 경쟁 구도
제7장 시장 기회 및 향후 전망
AJY 26.09.09According to Mordor Intelligence, the solid electrolyte market size is expected to grow from USD 33.89 million in 2025 to USD 39.18 million in 2026 and is forecast to reach USD 80.94 million by 2031 at 15.62% CAGR over 2026-2031.
This report is Segmented by Material Type (Sulfide Ceramics, Halide Ceramics, and More), Battery Type (EV Traction Batteries, and More), Manufacturing Method (Tape Casting/Cold Pressing, Additive Manufacturing/3-D Printing, and More), Thickness (Below 25µm, 25 To 100µm, and Above 100µm), End-Use Industry (Automotive, Medical Devices, and More), and Geography (North America, Europe, Asia-Pacific, and More).
Global Solid Electrolyte Market Trends and Insights
EV Safety Regulations Shifting Toward Solid-State Chemistry
New battery directives in the European Union require stringent thermal runaway prevention, a criterion that is met more readily by solid electrolytes than by liquid-filled lithium-ion cells. Japan issued safety approvals for Toyota's solid-state EV program in late 2024, signalling regulatory comfort with ceramic separators in high-energy applications. In aviation, the Federal Aviation Administration is evaluating solid electrolytes to meet low-flammability targets for next-gen aircraft power systems.These actions align global regulators behind a common safety rationale that elevates solid-state chemistry from optional to essential in upcoming platform designs. Automakers therefore integrate solid electrolytes not only for performance but also to secure future type approval across markets.
OEM R&D Race for >500 Wh/kg Batteries
Breakthrough energy densities around 500 Wh/kg, showcased by CATL's condensed-state cell prototypes in 2024, validate solid electrolytes as the enabling architecture for ultra-light vehicle packs. Subsequent lab demonstrations, climbing toward 711 Wh/kg, underscore a rapidly expanding theoretical ceiling. The pursuit encompasses charge-rate targets of sub-15 minutes, which demand high-temperature tolerance that ceramic or halide electrolytes provide. Competing OEMs now view the chemistry as central to their 2027-2030 product cycles, intensifying procurement of sulfide, halide, and oxide materials and stimulating multibillion-dollar supply contracts.
High Sintering & Deposition CAPEX
Conventional sulfide and oxide ceramics often require furnace cycles above 900 °C, driving equipment outlays that can exceed USD 50 million for a mid-scale line. Penn State's cold-sinter method lowers process temperature to 150 °C, cutting both energy demand and kiln investment [PSU.EDU]. Early techno-economic assessments place the thin lithium-metal anode cost at USD 4.3 m2 against a USD 2.1 m2 target, illustrating the economic gap manufacturers seek to bridge. The adoption of VAT photopolymerisation for LLZO geometries further reduces infrastructure needs by printing parts near-net shape, thereby bypassing multiple grinding and polishing steps.
Other drivers and restraints analyzed in the detailed report include:
- Venture-Capital Inflows & Pilot-Line Scale-Ups
- Consumer Micro-Devices Needing Ultra-Thin Cells
- Ceramic Processing Yield Losses
For complete list of drivers and restraints, kindly check the Table Of Contents.
Segment Analysis
Sulfide ceramics delivered 42.12% solid electrolyte market share in 2025 on the strength of Li6PS5Cl conductivities surpassing 1 mS cm-1 and well-understood tape-casting routes. The segment nevertheless faces cost and moisture sensitivity challenges that encourage the parallel development of halide and oxide options. Halide ceramics, although holding a modest base in 2025, are expected to register the fastest 18.74% CAGR through 2031, as their superior oxidative stability simplifies high-voltage cathode pairing. R&D focuses on Cl-, Br-, and F-rich frameworks that maintain high conductivity without hygroscopic degradation.
Manufacturers weigh oxidative tolerance, raw-material availability, and processing yield when selecting chemistries for specific end uses. Oxide garnets, such as Ta-doped LLZO, retain relevance where the risk of moisture ingress is high, despite their higher sintering temperatures. Polymer and glass-ceramic hybrids serve niche flexible electronics but remain secondary volume drivers. The cumulative effect keeps the overall solid electrolyte market size diversified across at least four main chemistries, ensuring supply resilience while fuelling intellectual-property competition.
EV traction packs captured 52.40% of the solid electrolyte market size in 2025 and are expected to expand at an 18.52% CAGR as global automakers schedule solid-state models for late-decade launch windows. The scale requirements of 60-100 kWh vehicle packs compel suppliers to target gigawatt-hour factories, which in turn subsidise cost learning, benefiting smaller segments. Consumer electronics continue to hold a steady share, with smartphones, laptops, and AR devices leading the way, aided by form-factor advantages and stringent safety standards for passenger-carried batteries.
Stationary energy storage, aerospace, medical implants, and industrial IoT collectively compose the remainder, each valuing specific attributes-cycle life, temperature resilience, biocompatibility, or miniaturisation. Technology spill-over from automotive R&D thus accelerates performance gains in these secondary arenas, reinforcing the dominant role of EV programmes in dictating material supply and equipment standards throughout the broader solid electrolyte market.
Complete Report Scope:
- By Material Type
- Oxide Ceramics (LLZO, LIPON, Perovskite, LISICON)
- Sulfide Ceramics (Argyrodite, LGPS family, Thio-LISICON)
- Phosphate Ceramics (NASICON, LISICON-P)
- Halide Ceramics
- Polymer Electrolytes (PEO, PAN, PVDF, PBI, etc.)
- Composite/Biphasic Electrolytes
- Glass and Glass-Ceramics (LIPON, LiPON-Si)
- Others
- By Battery Type
- Consumer Electronics Batteries
- EV Traction Batteries
- Energy-Storage System Batteries
- Aerospace and Defence Batteries
- Medical Implant Batteries
- Industrial and IoT Sensor Batteries
- By Manufacturing Method
- Tape Casting/Cold Pressing
- Hot Pressing and Sinter-HIP
- Atomic/Molecular Layer Deposition
- Solvent/Doctor-Blade Casting
- Additive Manufacturing/3-D Printing
- By Thickness
- Below 25 µm
- 25 to 100 µm
- Above 100 µm
- By End-use Industry
- Automotive
- Consumer Electronics
- Stationary Energy Storage
- Aerospace and Defence
- Medical Devices
- Industrial Equipment
- By Geography
- North America
- United States
- Canada
- Mexico
- Europe
- Germany
- United Kingdom
- France
- Italy
- NORDIC Countries
- Russia
- Rest of Europe
- Asia-Pacific
- China
- India
- Japan
- South Korea
- ASEAN Countries
- Rest of Asia-Pacific
- South America
- Brazil
- Argentina
- Rest of South America
- Middle East and Africa
- Saudi Arabia
- United Arab Emirates
- South Africa
- Egypt
- Rest of Middle East and Africa
- North America
Geography Analysis
The Asia-Pacific region controlled 57.75% of the revenue in 2025 and is forecast to realize an 17.65% CAGR, driven by vertically integrated supply chains, encompassing raw lithium refining, ceramic powder synthesis, cell assembly, and module integration, co-located within China, Japan, and South Korea. CATL, Panasonic, LG Energy Solution, and a suite of material makers coordinate investment pipelines that keep regional cost floors low. Government programmes such as South Korea's USD 35 billion battery initiative reinforce the region's trajectory.
North America is accelerating on the back of the U.S. Inflation Reduction Act and Department of Energy grants, promoting the construction of ceramic separator and sulfide powder plants that are eligible for tax credits. Partnerships uniting automakers with university spin-offs focus on closing process-yield gaps and qualifying domestic raw material streams. By 2030, the region could host multiple multi-gigawatt solid electrolyte lines, raising its contribution to global supply from the current single digits toward the low-20% range.
Europe pursues strategic autonomy through the European Battery Regulation and joint-venture factories underwritten by national governments. Volkswagen's battery arm, PowerCo, licenses solid electrolyte intellectual property to anchor planned German and Swedish plants capable of 40 GWh annual output. The policy emphasis on sustainability, circular economy, and local supply chains makes solid-state chemistry attractive due to its longer service life and improved recyclability. Combined, these moves indicate a rebalancing in which Asia retains primacy but faces credible trans-Atlantic challengers.
- Toyota Motor Corp (Solid-State Program)
- QuantumScape Corp
- Solid Power Inc.
- ProLogium Technology Co. Ltd
- CATL (Contemporary Amperex Technology Co.)
- Samsung SDI
- LG Energy Solution
- Panasonic Energy
- Ilika plc
- NEI Corporation
- Ohara Inc.
- Ampcera Corp
- Ionic Materials Inc.
- Empower Materials
- Tosoh Corporation
- Murata Manufacturing Co.
- GS Yuasa Corp
- Hitachi Zosen Corporation
- BYD Co. Ltd
- SK On Co. Ltd
- Mitsubishi Chemical Group
- Toshima Manufacturing Co. Ltd
Additional Benefits:
- The market estimate (ME) sheet in Excel format
- 3 months of analyst support
TABLE OF CONTENTS
1 Introduction
- 1.1 Study Assumptions & Market Definition
- 1.2 Scope of the Study
2 Research Methodology
3 Executive Summary
4 Market Landscape
- 4.1 Market Overview
- 4.2 Market Drivers
- 4.2.1 EV safety regulations shifting toward solid-state chemistry
- 4.2.2 OEM R&D race for >500 Wh/kg batteries
- 4.2.3 Venture-capital inflows & pilot-line scale-ups
- 4.2.4 Consumer micro-devices needing ultra-thin cells
- 4.2.5 Sodium solid electrolytes for grid-scale storage
- 4.2.6 Defence requirement for -50 °C to +150 °C power packs
- 4.3 Market Restraints
- 4.3.1 High sintering & deposition CAPEX
- 4.3.2 Ceramic processing yield losses
- 4.3.3 Li-metal dendrite breach in sulfide matrices
- 4.3.4 Scarce Li2S & high-purity P2S5 supply chain
- 4.4 Supply-Chain Analysis
- 4.5 Regulatory Landscape
- 4.6 Technological Outlook
- 4.7 Porter's Five Forces
- 4.7.1 Bargaining Power of Suppliers
- 4.7.2 Bargaining Power of Consumers
- 4.7.3 Threat of New Entrants
- 4.7.4 Threat of Substitutes
- 4.7.5 Intensity of Competitive Rivalry
5 Market Size & Growth Forecasts
- 5.1 By Material Type
- 5.1.1 Oxide Ceramics (LLZO, LIPON, Perovskite, LISICON)
- 5.1.2 Sulfide Ceramics (Argyrodite, LGPS family, Thio-LISICON)
- 5.1.3 Phosphate Ceramics (NASICON, LISICON-P)
- 5.1.4 Halide Ceramics
- 5.1.5 Polymer Electrolytes (PEO, PAN, PVDF, PBI, etc.)
- 5.1.6 Composite/Biphasic Electrolytes
- 5.1.7 Glass and Glass-Ceramics (LIPON, LiPON-Si)
- 5.1.8 Others
- 5.2 By Battery Type
- 5.2.1 Consumer Electronics Batteries
- 5.2.2 EV Traction Batteries
- 5.2.3 Energy-Storage System Batteries
- 5.2.4 Aerospace and Defence Batteries
- 5.2.5 Medical Implant Batteries
- 5.2.6 Industrial and IoT Sensor Batteries
- 5.3 By Manufacturing Method
- 5.3.1 Tape Casting/Cold Pressing
- 5.3.2 Hot Pressing and Sinter-HIP
- 5.3.3 Atomic/Molecular Layer Deposition
- 5.3.4 Solvent/Doctor-Blade Casting
- 5.3.5 Additive Manufacturing/3-D Printing
- 5.4 By Thickness
- 5.4.1 Below 25 µm
- 5.4.2 25 to 100 µm
- 5.4.3 Above 100 µm
- 5.5 By End-use Industry
- 5.5.1 Automotive
- 5.5.2 Consumer Electronics
- 5.5.3 Stationary Energy Storage
- 5.5.4 Aerospace and Defence
- 5.5.5 Medical Devices
- 5.5.6 Industrial Equipment
- 5.6 By Geography
- 5.6.1 North America
- 5.6.1.1 United States
- 5.6.1.2 Canada
- 5.6.1.3 Mexico
- 5.6.2 Europe
- 5.6.2.1 Germany
- 5.6.2.2 United Kingdom
- 5.6.2.3 France
- 5.6.2.4 Italy
- 5.6.2.5 NORDIC Countries
- 5.6.2.6 Russia
- 5.6.2.7 Rest of Europe
- 5.6.3 Asia-Pacific
- 5.6.3.1 China
- 5.6.3.2 India
- 5.6.3.3 Japan
- 5.6.3.4 South Korea
- 5.6.3.5 ASEAN Countries
- 5.6.3.6 Rest of Asia-Pacific
- 5.6.4 South America
- 5.6.4.1 Brazil
- 5.6.4.2 Argentina
- 5.6.4.3 Rest of South America
- 5.6.5 Middle East and Africa
- 5.6.5.1 Saudi Arabia
- 5.6.5.2 United Arab Emirates
- 5.6.5.3 South Africa
- 5.6.5.4 Egypt
- 5.6.5.5 Rest of Middle East and Africa
- 5.6.1 North America
6 Competitive Landscape
- 6.1 Market Concentration
- 6.2 Strategic Moves (M&A, Partnerships, PPAs)
- 6.3 Market Share Analysis (Market Rank/Share for key companies)
- 6.4 Company Profiles (includes Global level Overview, Market level overview, Core Segments, Financials as available, Strategic Information, Products & Services, and Recent Developments)
- 6.4.1 Toyota Motor Corp (Solid-State Program)
- 6.4.2 QuantumScape Corp
- 6.4.3 Solid Power Inc.
- 6.4.4 ProLogium Technology Co. Ltd
- 6.4.5 CATL (Contemporary Amperex Technology Co.)
- 6.4.6 Samsung SDI
- 6.4.7 LG Energy Solution
- 6.4.8 Panasonic Energy
- 6.4.9 Ilika plc
- 6.4.10 NEI Corporation
- 6.4.11 Ohara Inc.
- 6.4.12 Ampcera Corp
- 6.4.13 Ionic Materials Inc.
- 6.4.14 Empower Materials
- 6.4.15 Tosoh Corporation
- 6.4.16 Murata Manufacturing Co.
- 6.4.17 GS Yuasa Corp
- 6.4.18 Hitachi Zosen Corporation
- 6.4.19 BYD Co. Ltd
- 6.4.20 SK On Co. Ltd
- 6.4.21 Mitsubishi Chemical Group
- 6.4.22 Toshima Manufacturing Co. Ltd
7 Market Opportunities & Future Outlook
- 7.1 White-Space & Unmet-Need Assessment