
|
시장보고서
상품코드
2124333
경로 최적화 소프트웨어 시장 : 시장 점유율 분석, 업계 동향 및 통계, 성장 예측(2026-2031년)Route Optimization Software - Market Share Analysis, Industry Trends & Statistics, Growth Forecasts (2026 - 2031) |
||||||
 Mordor Intelligence
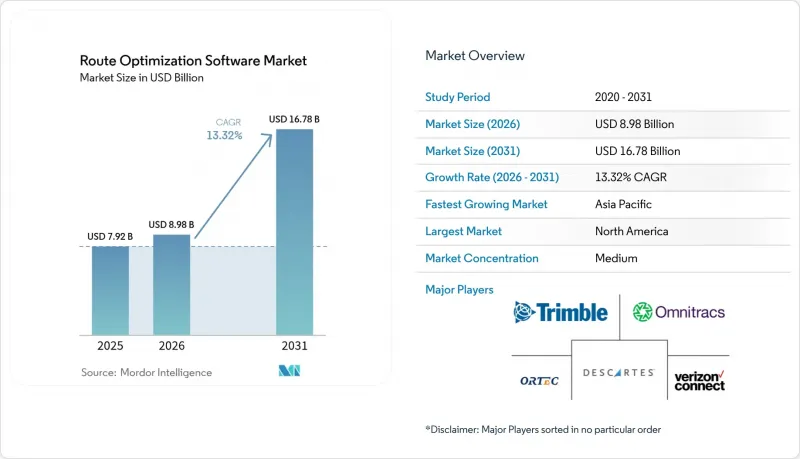
Mordor Intelligence에 의하면, 경로 최적화 소프트웨어 시장 규모는 2025년에 79억 2,000만 달러로 평가되었고, 2026년 89억 8,000만 달러에서 2031년까지 167억 8,000만 달러에 이를 것으로 예측되며, 예측 기간(2026-2031년) CAGR은 13.32%를 기록할 전망입니다.
본 보고서는 솔루션 구성 요소별(소프트웨어 플랫폼 및 서비스), 최종 사용자 산업 분야별(주문형 음식 배달, 소매·FMCG 등), 조직 규모별(중소기업 및 대기업), 도입 형태별(클라우드 및 온프레미스), 그리고 지역별로 분류되어 있습니다. 시장 예측은 금액(달러) 기준으로 제시되어 있습니다.
세계의 경로 최적화 소프트웨어 시장 동향 및 인사이트
전자상거래 소포 처리량의 폭발적인 증가
전자상거래 소포 처리량은 연간 수십억 개 규모로 급증하여 기존의 허브 앤 스포크(hub-and-spoke) 모델을 무너뜨렸으며, 소프트웨어 제공업체들은 제한된 시간 내에 수백만 개의 동적인 배송지를 처리해야 하는 상황에 처해 있습니다. 아마존만 해도 2024년에 50억 개 이상의 소포를 처리하고 있어, 재고 근접성, 마이크로 풀필먼트 센터의 입지, 그리고 실시간 교통 예측을 능숙하게 조정하는 알고리즘의 필요성이 부각되고 있습니다. 고밀도 도시 지역에서의 배송에는 과거 수요, 기상, 운전자의 행동 데이터를 바탕으로 경로를 사전에 최적화할 수 있는 머신러닝 엔진이 필수적입니다. 소매업체들이 옴니채널 서비스와 당일 배송 약속을 확대함에 따라, 밀리초 단위로 재계산할 수 없는 플랫폼은 그 존재 의의를 잃어가고 있습니다.
긱 경제의 배송 차량 군단을 위한 5G 기반 실시간 최적화
5G와 멀티액세스 엣지 컴퓨팅(MAEC)을 통한 밀리초 단위의 저지연 덕분에, 일괄 처리 방식의 스케줄링이 지속적인 최적화로 변화하고 있습니다. 음식 배달 플랫폼은 주문이 급증하거나 교통 체증이 발생할 때, 로컬 네트워크의 엣지를 활용하여 즉시 경로를 재계산합니다. 엣지 노드를 통해 왕복 계산 시간이 1-10밀리초로 단축되므로, 운전자는 다음 신호등에 도달하기 전에 업데이트된 배달 순서를 받을 수 있습니다. 서비스 범위는 여전히 도심에 국한되어 있기 때문에 전국적인 확대가 성숙해지기 전까지는 지방의 차량 군은 그 혜택을 충분히 누릴 수 없습니다.
크라우드소싱형 운전 데이터셋의 복잡한 데이터 권리
GDPR(EU 개인정보보호규정) 및 유사한 법규로 인해 머신러닝 파이프라인에서 활용할 수 있는 행동 데이터의 양과 상세도가 제한되고 있습니다. 소프트웨어 벤더는 동의 관리, 데이터 계보 추적, 선택적 삭제 워크플로를 통합해야 하며, 이로 인해 규정 준수 관련 오버헤드가 증가하고 있습니다. 전담 법무팀을 보유하지 않은 중소 벤더들은 국경을 넘어 사업을 확장하는 데 장벽에 직면하고 있으며, 자금력이 풍부한 업체들이 규정 준수 비용을 흡수함에 따라 시장의 집중화가 진행되고 있습니다.
부문 분석
소프트웨어 플랫폼은 2025년 경로 최적화 소프트웨어 시장에서 62.15%의 점유율을 유지했으며, 이는 자동 배차 시스템의 기반으로서의 역할을 반영합니다. 컨설팅 및 통합 서비스는 절대적인 규모는 작지만, 기업들이 다중 벤더 IT 환경 및 변경 관리 과제에 직면함에 따라 연평균 성장률(CAGR) 14.08%로 성장하고 있습니다. 도입 기업들은 소프트웨어가 약속하는 비용 절감 효과를 실현하기 위해 창고 워크플로우, 운송 관리 시스템 인터페이스 및 CRM 알림을 재설계하고 있습니다. 벤더들은 프로세스 재설계가 수반되지 않는 플랫폼 도입만으로는 배송 비용을 두 자릿수 수준으로 절감하는 경우가 드물다는 점을 인식하고, 자문 서비스를 패키지로 제공하는 사례를 늘리고 있습니다.
또한 기업들은 시범 지역을 넘어 배송 차량이 확대됨에 따라 중요해지는 지속적인 모델 조정, 벤치마킹, 그리고 예외 사례 처리에 대해서도 서비스 팀에 의존하고 있습니다. 그 결과, 지속적인 ‘서비스형 최적화(Optimization-as-a-Service)’ 계약이 영구 라이선스 수요를 잠식하고 있어, 공급업체의 수익원을 안정화시키고 있습니다. 경로 최적화 소프트웨어 시장 중 전문 서비스에 할당되는 시장 규모는 2031년까지 47억 2,000만 달러를 넘어설 것으로 예상되며, 이는 성과 기반의 협업 모델로의 전환을 시사합니다.
소매 및 FMCG(일용소비재) 공급업체가 수익의 대부분을 차지했으나, 30분 이내 배송을 약속하는 것이 경쟁의 기준이 됨에 따라 온디맨드 식품 배달 시장이 연평균 성장률(CAGR) 15.03%로 확대되고 있습니다. 식사 배달 차량과 관련된 경로 최적화 소프트웨어 시장 규모는 동적인 배달원 풀과 실시간 재계산이 필요한 신선 식품 적재량에 힘입어 2031년까지 23억 2,000만 달러를 넘어설 전망입니다. 알고리즘은 몇 분마다 경로를 재최적화하여 열 손실 제약과 주방의 처리 능력 간의 균형을 맞추어야 합니다.
현장 서비스, 헬스케어, 차량 라이드 셰어링 분야에서는 각각 특화된 제약 조건 라이브러리, 의약품 온도 모니터링, 기술자의 기술 매칭, 또는 운전자의 재배치 모델 등이 요구됩니다. 이러한 수직 통합의 진전에 따라, 벤더들은 ‘범용형’ 엔진이 아닌 플러그인 출시를 요구받고 있으며, 플랫폼 시장 구조는 세분화되는 한편, 전문적인 틈새 시장의 총 잠재 가치(TAV)는 향상되고 있습니다.
지역별 분석
북미는 2025년 매출의 38.05%를 차지했으며, 전자상거래의 성숙과 심각한 운전기사 부족에 힘입어 알고리즘을 통한 주행 거리 단축이 매우 중요해지고 있습니다. 아마존의 독자적인 시스템은 경쟁사들에게 파급 효과를 미치는 벤치마크를 확립하고 있으며, 캐나다는 국경을 넘는 모듈을 활용하여 NAFTA 회랑의 동기화를 도모하고 있습니다. 멕시코 제조업의 회복은 산업 클러스터 전체의 공회전 거리를 최소화하는 입출고 균형 조정 알고리즘을 촉진하고 있습니다. 데이터 공유에 대한 지역의 규제 태도는 비교적 관대한 상태를 유지하고 있으며, 이로 인해 운전자의 운전 행동에 대한 교육과 연료 절약 대시보드의 신속한 도입이 가능해졌습니다.
아시아태평양은 가장 빠르게 성장하는 시장으로, 대도시의 교통 체증과 정부 주도의 디지털 물류 계획에 힘입어 연평균 성장률(CAGR) 14.82%로 성장을 지속하고 있습니다. 인도의 ULIP는 500개 이상의 운송업체 간에 표준화된 데이터 파이프라인을 구축하여, 소규모 운송업체도 자체 시스템 통합 없이 공유된 최적화 엔진을 활용할 수 있도록 하고 있습니다. 중국의 5G가 전면적으로 구축된 대도시권에서는 식료품 및 소포 배송 차량 군에 대해 1초 미만의 경로 재계산이 가능해졌으며, 한편 일본의 ‘2024년 문제’로 인한 초과근무 상한 규제로 운전자의 근로 시간이 제한되는 상황에서도 화물 유통을 유지하기 위해 생산성의 획기적인 향상이 요구되고 있습니다. 동남아시아의 성장은 스마트폰을 주축으로 한 상거래, 클라우드의 보급, 그리고 항만 물류의 연계가 필요한 수출 지향형 제조업 지대의 부상에 의해 뒷받침되고 있습니다.
유럽에서는 환경 규제를 배경으로 꾸준한 보급이 진행되고 있습니다. 250개 이상의 도시에 걸쳐 있는 저배출 구역에서는 시간대 및 적재량 제한이 부과되고 있으며, 이를 경제적으로 충족시킬 수 있는 방법은 AI를 활용한 경로 최적화뿐입니다. EU 디지털 운송 및 물류 포럼은 국경을 넘는 화물 운송의 규정 준수 비용을 절감하는 표준화된 API를 공개하고 있습니다. 그러나 GDPR(EU 개인정보보호규정)의 엄격한 동의 규칙으로 인해 크라우드소싱을 통한 텔레메트리 활용이 제한되고 있어, 각 벤더사는 페더레이티드 최적화나 차분 마스킹과 같은 개인정보 보호를 위한 학습 기술의 선구적인 개발을 서둘러야 하는 상황입니다.
기타 혜택 :
- 엑셀 형식 시장 예측(ME) 시트
- 3개월간의 애널리스트 지원
자주 묻는 질문
목차
제1장 서론
제2장 조사 방법
제3장 주요 요약
제4장 시장 구도
제5장 시장 규모 및 성장 예측
제6장 경쟁 구도
제7장 시장 기회 및 향후 전망
AJY 26.09.09According to Mordor Intelligence, the route optimization software market size was valued at USD 7.92 billion in 2025 and estimated to grow from USD 8.98 billion in 2026 to reach USD 16.78 billion by 2031, at a CAGR of 13.32% during the forecast period (2026-2031).
This report is Segmented by Solution Component (Software Platforms and Services), End-User Vertical (On-Demand Food Delivery, Retail and FMCG, and More), Size of Organization (Small and Medium Enterprises and Large Enterprises), Deployment Mode (Cloud and On-Premise), and Geography. The Market Forecasts are Provided in Terms of Value (USD).
Global Route Optimization Software Market Trends and Insights
Explosive Growth in E-commerce Parcel Volume
E-commerce parcels soared to multibillion annual counts, collapsing legacy hub-and-spoke models and forcing software providers to handle millions of dynamic delivery points within tight windows. Amazon alone processed over five billion packages in 2024, underscoring the need for algorithms that juggle inventory proximity, micro-fulfillment center locations, and real-time traffic predictions. High-density urban drops now require machine-learning engines able to pre-optimize routes from historical demand, weather, and driver behavior data. Platforms unable to deliver millisecond-level recalculations lose relevance as retailers scale omnichannel services and same-day promises.
5G-enabled Real-time Optimization for Gig-Economy Fleets
Millisecond latency from 5G and Multi-Access Edge Computing turns batch scheduling into continuous optimization. Food-delivery platforms leverage local network edges to recompute routes instantly when orders surge or traffic bottlenecks emerge. Edge nodes cut round-trip computation times to 1-10 milliseconds, meaning a driver can receive an updated drop sequence before the next traffic light. Coverage is still city-centric, so rural fleets experience fewer gains until national roll-outs mature.
Complex Data Rights in Crowdsourced Driving Datasets
GDPR and similar statutes curtail the volume and granularity of behavioral data available for machine-learning pipelines. Software vendors must embed consent management, data lineage tracking, and selective deletion workflows that inflate compliance overhead. Smaller vendors lacking dedicated legal teams face barriers to cross-border expansion, nudging market concentration upward as well-capitalized players absorb compliance costs.
Other drivers and restraints analyzed in the detailed report include:
- Convergence of Telematics and AI-powered Route Engines
- Dynamic Pricing Models Lowering TCO for SMB Adopters
- Driver Push-back Against Hyper-dense Delivery Schedules
For complete list of drivers and restraints, kindly check the Table Of Contents.
Segment Analysis
Software platforms retained a 62.15% stake in the Route Optimization Software market share during 2025, reflecting their role as the backbone of automated dispatch systems. Consulting and integration services, though smaller in absolute value, are growing at 14.08% CAGR as enterprises grapple with multi-vendor IT landscapes and change-management hurdles. Implementers re-engineer warehouse workflows, transportation management system interfaces, and CRM notifications to unlock software-promised savings. Vendors increasingly bundle advisory engagements, recognizing that platform deployments without process redesign rarely achieve double-digit delivery-cost reductions.
Enterprises also lean on services teams for ongoing model-tuning, benchmarking, and edge-case exception handling, which are critical once fleets scale beyond pilot districts. As a result, recurring optimization-as-a-service contracts are cannibalizing perpetual licenses, smoothing revenue streams for providers. The Route Optimization Software market size allocated to professional services is expected to cross USD 4.72 billion by 2031, signaling a shift toward outcome-based collaboration models.
Retail and FMCG suppliers dominated revenue, yet on-demand food delivery is accelerating with a 15.03% CAGR as 30-minute promise windows become a competitive baseline. The Route Optimization Software market size tied to meal-delivery fleets will exceed USD 2.32 billion by 2031, fueled by dynamic rider pools and perishable payloads that demand real-time recalculations. Algorithms must re-optimize routes every few minutes, balancing heat-loss constraints and kitchen throughput.
Field services, healthcare, and ride-hailing each require tailored constraint libraries, temperature monitoring for pharmaceuticals, technician skill matching, or driver re-positioning models. Such verticalization spurs vendors to release plug-ins rather than one-size-fits-all engines, fragmenting the platform landscape but lifting total addressable value across specialized niches.
Complete Report Scope:
- By Solution Component
- Software Platforms
- Services
- By End-user Vertical
- On-Demand Food Delivery
- Retail and FMCG
- Field Services
- Ride Hailing and Taxi Services
- Healthcare and Pharmaceuticals
- Other End-user Verticals
- By Size of the Organization
- Small and Medium Enterprises
- Large Enterprises
- By Deployment Mode
- Cloud
- On-Premise
- By Geography
- North America
- United States
- Canada
- Mexico
- South America
- Brazil
- Argentina
- Rest of South America
- Europe
- Germany
- United Kingdom
- France
- Italy
- Spain
- Rest of Europe
- Asia-Pacific
- China
- Japan
- South Korea
- India
- Singapore
- Australia
- Rest of Asia-Pacific
- Middle East and Africa
- Middle East
- Saudi Arabia
- United Arab Emirates
- Turkey
- Rest of Middle East
- Africa
- South Africa
- Nigeria
- Egypt
- Rest of Africa
- Middle East
- North America
Geography Analysis
North America commanded 38.05% of 2025 revenue, buoyed by e-commerce maturity and acute driver shortages that make algorithmic mileage savings mission-critical. Amazon's proprietary systems set benchmarks that ripple through competitors, while Canada leverages cross-border modules to synchronize NAFTA corridors. Mexico's manufacturing upswing drives inbound-outbound balancing algorithms that minimize empty miles across industrial clusters. Regional regulatory stances toward data sharing remain comparatively lenient, enabling rapid roll-out of driver-behavior training and fuel-savings dashboards.
Asia-Pacific is the fastest-expanding theatre, clocking a 14.82% CAGR on the back of megacity congestion and state-sponsored digital logistics schemes. India's ULIP ushers standardized data pipes among 500-plus carriers, allowing small fleets to tap shared optimization engines without bespoke integrations. China's 5G-blanketed metros support sub-second recalculations for grocery and parcel delivery swarms, while Japan's "2024 Problem" overtime cap mandates productivity jumps to keep freight flowing despite constrained driver hours. Southeast Asian growth rides on smartphone-first commerce, cloud penetration, and rising export-oriented manufacturing zones requiring synchronized port logistics.
Europe exhibits steady uptake driven by environmental regulation. Low-emission zones across more than 250 cities impose time-window and payload constraints that only AI-enhanced routing can satisfy economically. The EU's Digital Transport and Logistics Forum releases harmonized APIs that trim compliance costs for cross-border consignments. Yet GDPR's stringent consent rules restrain crowdsourced telemetry usage, nudging vendors to pioneer privacy-preserving learning techniques such as federated optimization and differential masking.
- Trimble Inc.
- Verizon Connect Solutions Inc.
- The Descartes Systems Group Inc.
- Omnitracs LLC
- ORTEC B.V.
- ESRI Global Inc.
- Caliper Corporation
- PTV Planung Transport Verkehr GmbH
- Paragon Software Systems PLC
- Microlise Group PLC
- Route4Me LLC
- Routific Solutions Inc.
- InsightGeeks Solutions Pvt. Ltd (TrackoBit)
- WorkWave LLC
- Wise Systems Inc.
- Bringg Delivery Technologies Ltd.
- FarEye Technologies Pvt. Ltd.
- Locus.sh (Marble Automation Pvt. Ltd.)
- OptimoRoute Inc.
- Mapbox Inc.
Additional Benefits:
- The market estimate (ME) sheet in Excel format
- 3 months of analyst support
TABLE OF CONTENTS
1 INTRODUCTION
- 1.1 Study Assumptions and Market Definition
- 1.2 Scope of the Study
2 RESEARCH METHODOLOGY
3 EXECUTIVE SUMMARY
4 MARKET LANDSCAPE
- 4.1 Market Overview
- 4.2 Market Drivers
- 4.2.1 Explosive growth in e-commerce parcel volume
- 4.2.2 Driver-assistance mandates from urban low-emission zones
- 4.2.3 5G-enabled real-time optimization for gig economy fleets
- 4.2.4 Convergence of telematics and AI-powered route engines
- 4.2.5 Dynamic pricing models lowering TCO for SMB adopters
- 4.2.6 National smart-logistics programs (e.g., EU DTLF, India ULIP)
- 4.3 Market Restraints
- 4.3.1 Complex data rights in crowdsourced driving datasets
- 4.3.2 Driver push-back against hyper-dense delivery schedules
- 4.3.3 Limited map accuracy in emerging markets rural networks
- 4.3.4 Fragmented last-mile regulations raising compliance cost
- 4.4 Industry Value Chain Analysis
- 4.5 Impact of Macroeconomic Factors
- 4.6 Regulatory Landscape
- 4.7 Technological Outlook
- 4.8 Porter's Five Forces Analysis
- 4.8.1 Bargaining Power of Suppliers
- 4.8.2 Bargaining Power of Buyers
- 4.8.3 Threat of New Entrants
- 4.8.4 Threat of Substitutes
- 4.8.5 Degree of Competition
5 MARKET SIZE AND GROWTH FORECASTS (VALUES)
- 5.1 By Solution Component
- 5.1.1 Software Platforms
- 5.1.2 Services
- 5.2 By End-user Vertical
- 5.2.1 On-Demand Food Delivery
- 5.2.2 Retail and FMCG
- 5.2.3 Field Services
- 5.2.4 Ride Hailing and Taxi Services
- 5.2.5 Healthcare and Pharmaceuticals
- 5.2.6 Other End-user Verticals
- 5.3 By Size of the Organization
- 5.3.1 Small and Medium Enterprises
- 5.3.2 Large Enterprises
- 5.4 By Deployment Mode
- 5.4.1 Cloud
- 5.4.2 On-Premise
- 5.5 By Geography
- 5.5.1 North America
- 5.5.1.1 United States
- 5.5.1.2 Canada
- 5.5.1.3 Mexico
- 5.5.2 South America
- 5.5.2.1 Brazil
- 5.5.2.2 Argentina
- 5.5.2.3 Rest of South America
- 5.5.3 Europe
- 5.5.3.1 Germany
- 5.5.3.2 United Kingdom
- 5.5.3.3 France
- 5.5.3.4 Italy
- 5.5.3.5 Spain
- 5.5.3.6 Rest of Europe
- 5.5.4 Asia-Pacific
- 5.5.4.1 China
- 5.5.4.2 Japan
- 5.5.4.3 South Korea
- 5.5.4.4 India
- 5.5.4.5 Singapore
- 5.5.4.6 Australia
- 5.5.4.7 Rest of Asia-Pacific
- 5.5.5 Middle East and Africa
- 5.5.5.1 Middle East
- 5.5.5.1.1 Saudi Arabia
- 5.5.5.1.2 United Arab Emirates
- 5.5.5.1.3 Turkey
- 5.5.5.1.4 Rest of Middle East
- 5.5.5.2 Africa
- 5.5.5.2.1 South Africa
- 5.5.5.2.2 Nigeria
- 5.5.5.2.3 Egypt
- 5.5.5.2.4 Rest of Africa
- 5.5.5.1 Middle East
- 5.5.1 North America
6 COMPETITIVE LANDSCAPE
- 6.1 Market Concentration
- 6.2 Strategic Moves
- 6.3 Market Share Analysis
- 6.4 Company Profiles (includes Global level Overview, Market level overview, Core Segments, Financials as available, Strategic Information, Market Rank/Share for key companies, Products and Services, and Recent Developments)
- 6.4.1 Trimble Inc.
- 6.4.2 Verizon Connect Solutions Inc.
- 6.4.3 The Descartes Systems Group Inc.
- 6.4.4 Omnitracs LLC
- 6.4.5 ORTEC B.V.
- 6.4.6 ESRI Global Inc.
- 6.4.7 Caliper Corporation
- 6.4.8 PTV Planung Transport Verkehr GmbH
- 6.4.9 Paragon Software Systems PLC
- 6.4.10 Microlise Group PLC
- 6.4.11 Route4Me LLC
- 6.4.12 Routific Solutions Inc.
- 6.4.13 InsightGeeks Solutions Pvt. Ltd (TrackoBit)
- 6.4.14 WorkWave LLC
- 6.4.15 Wise Systems Inc.
- 6.4.16 Bringg Delivery Technologies Ltd.
- 6.4.17 FarEye Technologies Pvt. Ltd.
- 6.4.18 Locus.sh (Marble Automation Pvt. Ltd.)
- 6.4.19 OptimoRoute Inc.
- 6.4.20 Mapbox Inc.
7 MARKET OPPORTUNITIES AND FUTURE OUTLOOK
- 7.1 White-space and Unmet-need assessment