

|
시장보고서
상품코드
2124349
전력 시장 : 점유율 분석, 업계 동향과 통계, 성장 예측(2026-2031년)Power - Market Share Analysis, Industry Trends & Statistics, Growth Forecasts (2026 - 2031) |
||||||
 Mordor Intelligence
Mordor Intelligence에 의하면, 전력 시장 규모는 2025년에 1만 290 GW로 평가되어 2026년 1만 1,170 GW에서 2031년까지 1만 6,830 GW에 이를 것으로 예측되며, 예측 기간(2026-2031년) CAGR은 8.55%를 나타낼 전망입니다.
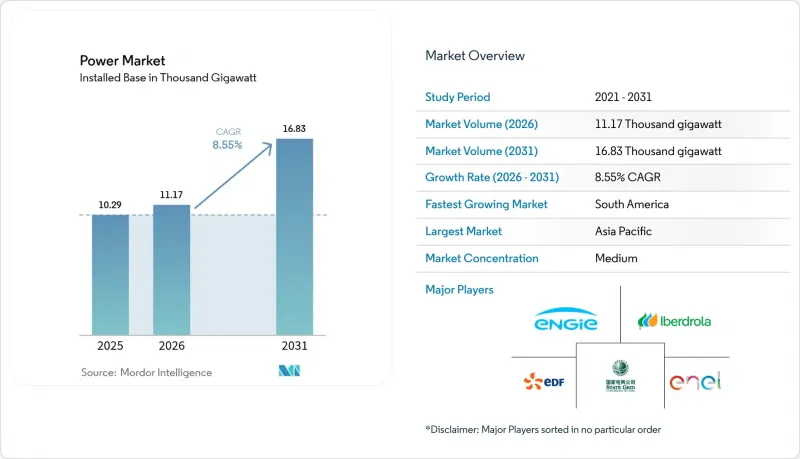
본 보고서는 발전원별(화력, 원자력, 재생에너지), 최종 사용자별(유틸리티, 상업 및 산업용, 주택), 지역별(북미, 유럽, 아시아태평양, 남미, 중동 및 아프리카)로 분류되어 있습니다. 시장 규모와 전망은 설비 용량(GW) 단위로 표시되어 있습니다.
세계 전력 시장 동향 및 인사이트
데이터센터의 전력 수요가 폭발적으로 급증
2024년, 데이터센터의 전력 소비량은 460TWh에 달할 것으로 예상되며, 이는 아르헨티나의 연간 총 부하에 해당하고 전 세계 전력 소비량의 2%를 차지합니다. 현재 평균적인 하이퍼스케일 캠퍼스는 100-200MW의 연속 전력을 소비하고 있어, 전력 회사들은 계통 연계 규정의 재협상 및 변전소 업그레이드를 서둘러 진행해야 하는 상황에 처해 있습니다. 2024년에는 주요 기술 기업들이 기존 전력 공급 모델을 피하고 24시간 365일 가동되는 재생에너지를 확보한 결과, 기업 구매자들은 23.7GW의 청정 에너지를 계약했습니다. 버지니아주의 ‘데이터센터 앨리’는 이미 주 전체 발전량의 25%를 소비하고 있어, 규제 당국은 용량 시장 참여 규정을 재검토해야 하는 상황에 직면해 있습니다(PJM.com). 이러한 집중된 부하는 전압 안정성 위험을 높이고, 용량 계약의 프리미엄 가격을 끌어올리며, 이는 소매 요금으로 전가되고 있습니다. 그 결과, 전 세계 전력 시장은 10년 전만 해도 드물었던 지역적 베이스로드의 급증에 맞추어 재조정되고 있습니다.
산업용 열 및 운송의 전기화
2024년에는 전기 아크로가 신규 철강 생산 능력의 73%를 차지했으며, 유럽 산업용 난방 설비 개조 프로젝트의 40%에서 히트 펌프가 천연가스를 대체했습니다. 모빌리티 부문에서는 1,410만 대의 전기차(EV)가 85TWh의 순 수요를 증가시켰지만, 한편으로는 280GWh의 V2G(Vehicle-to-Grid) 전력 저장을 제공하여 저녁 시간대 피크 수요 억제에 기여했습니다. 북유럽의 송전망은 이러한 융합을 여실히 보여주고 있습니다. 전기차 충전과 산업용 히트펌프의 작동 주기가 동기화되면서 시간대별로 묶인 소비의 급증 현상이 발생하지만, 세밀한 요금 신호와 AI 기반 계통 운영을 통해 균형이 유지되고 있습니다. 알루미늄 제련소와 화학 단지는 저렴하고 안정적인 공급이 가능한 재생에너지를 활용하기 위해 이미 풍력 자원이 풍부한 지역으로 이전을 추진 중이며, 15-20년에 걸친 전력 구매 계약을 체결함으로써 지역 송전망 확장을 뒷받침하고 있습니다. 이와 유사한 추세가 전 세계적으로 확산됨에 따라, 세계 전력 시장에서는 산업용 전력 소비량이 15-20% 지속적으로 증가할 것으로 예상되며, 이에 대응하기 위해서는 연간 450억 달러 규모의 배전망 강화 투자가 필요한 것으로 나타났습니다.
송전망의 병목 현상과 인허가 지연
송전망의 제약으로 인해 2024년에는 착공 준비가 완료된 127GW 규모의 재생에너지 프로젝트가 보류되어 3,400억 달러의 투자 지연으로 이어졌습니다. 미국의 계통 연계 대기 용량은 2,600GW로 급증했는데, 이는 현재 송전망 용량의 5배에 해당하며, 평균 심사 기간은 5.2년에 달할 전망입니다. 유럽의 국경을 넘는 송전선은 바람이 강한 시간대에 가동률이 95%에 달하고,, 특히 스페인과 독일에서 47TWh의 출력 억제를 피할 수 없었습니다. 이에 대해 정책 입안자들은 EU의 ‘넷제로 산업법’에 근거해 사전 구획이 완료된 프로젝트에 대해 심사 기간을 12개월 이내로 제한하는 조치를 취했으나, 지역 주민들의 반대로 인해 고전압 직류 송전(HVDC) 건설 프로젝트 4건 중 1건은 여전히 지연되고 있습니다. 이러한 병목 현상이 해소되지 않으면 자본 투입이 미뤄지거나 투자자의 신뢰가 떨어질 수 있으며, 이는 세계 전력 시장의 탈탄소화 과정을 저해할 우려가 있습니다.
부문별 분석
재생에너지는 2025년 설비 용량의 47.95%를 차지하며, 2031년까지 연평균 성장률(CAGR) 13.70%로 확대되고 있습니다. 이는 같은 해 기록적인 346GW의 태양광 발전과 116GW의 풍력 발전이 신설된 데 힘입은 것입니다. 대부분의 지역에서 한계 가스 가격보다 저렴한 태양광 발전은 주간 공급을 주도하며, 피크 시간대의 가격 차이를 줄이고 있습니다. 풍력 발전은 저녁 시간대에 보완적인 역할을 하고 있지만, 15개국에서 변동 발전량이 국내 전력 공급 구성의 30%를 초과함에 따라 계통 연계와 관련된 과제가 대두되고 있습니다. 연평균 성장률(CAGR) 23.10%로 성장하고 있는 해상 풍력 발전은 부유식 기초를 이용해 심해역 입지를 확보하고 있으며, 일본, 한국, 캘리포니아주에서 도입이 가속화되고 있습니다. 동시에, 원자력 발전소의 재가동과 소형 모듈형 원자로의 시험 운영은 산업용 열공급 계약의 기반이 될 수 있는 확실하고 저탄소적인 발전에 활용되는 아직 초기 단계이긴 하지만 전략적인 방향을 제시하고 있습니다. 석탄 화력 및 석유 화력 발전소는 계속해서 폐지 또는 개보수가 진행되고 있으며, 2024년에는 47GW 규모의 석탄 화력 발전 용량을 수소 혼소 방식으로 전환하겠다고 발표되었으나, 상업적 실현 가능성은 여전히 톤당 80달러를 초과하는 탄소 가격에 달려 있습니다.
재생에너지의 높은 보급률은 계획의 중점을 유연성 자산으로 전환시키고 있습니다. 전 세계의 전력계통 운영 사업자들은 2026년부터 2031년까지 배터리 저장 시스템, 양수 발전, 수요 반응, 계통 연계선 확장에 누적 2조 8,000억 달러의 투자가 필요할 것으로 전망됩니다. 배터리 저장 시스템의 도입으로 주간 태양광 발전으로 인한 공급 과잉이 완화되는 한편, 국경을 넘는 고전압 직류(HVDC) 송전선을 통해 잉여 풍력 발전 전력을 전력 수요 지역으로 송전합니다. 이러한 시책이 확대됨에 따라 세계 전력 시장은 단일 연료가 지배적이 되는 것이 아니라, 다양한 발전원 구성을 통해 회복탄력성을 갖추게 될 것입니다. 따라서 재생에너지의 급속한 성장은 전 세계 전력 시스템 전반에 걸쳐 자본 배분, 규제 체계, 시장 가격 형성을 재정의하게 될 것입니다.
지역별 분석
2025년, 아시아태평양은 세계 전력 시장을 주도하며 발전 용량 점유율의 44.20%를 차지했습니다. 이는 중국의 1,411GW 설비와 인도의 425GW에 힘입은 결과입니다. 중국은 같은 해 216GW 규모의 신규 재생에너지 설비를 가동했는데, 이는 독일의 총 설치 용량을 능가하는 규모인 반면, 송전망의 관성 특성을 확보하기 위해 47GW 규모의 석탄 화력 발전 설비도 추가했습니다. 대조적으로, 인도는 태양광 발전 확대 목표와 2026년까지 50GWh의 축전 용량을 목표로 하는 지역별 배터리 입찰 간의 균형을 맞추고 있습니다. 일본과 한국은 수입 연료에 대한 의존도를 낮추기 위해 해상 풍력 발전과 첨단 원자력 발전에 의존하고 있습니다. 일본은 2040년까지 해상 풍력 발전 용량을 45GW로 확대할 계획이며, 한국은 12GW 규모의 부유식 태양광 발전 실증 실험을 진행하고 있습니다. 이 지역의 계통 통합에 대한 부담은 여전히 높으며, 송전 능력의 제약으로 인해 중국 북서부에서는 재생에너지 출력 억제율이 8.2%를 초과하고 있어, 성 간 고전압 직류 송전(HVDC) 선로 구축이 시급하다는 점이 부각되고 있습니다.
남미는 칠레의 그린 수소 허브와 아르헨티나 및 브라질의 리튬 기반 계통 축전 수요에 힘입어 연평균 성장률(CAGR) 15.10%를 기록하며 세계 전력 시장에서 가장 빠르게 성장하는 지역으로 부상했습니다. 브라질은 195GW의 설비 용량을 자랑하며, 저비용 풍력 및 수력을 활용하여 광업 및 농업의 탈탄소화를 추진하고 있습니다. 칠레 아타카마 지역의 태양광 발전 급속 확장은 광업의 전력 수요와 수소 수출 터미널 양쪽 모두에 전력을 공급하며, 균등화 비용을 1MWh당 30달러 미만으로 억제하고 있습니다. 재생에너지 외에도, 아르헨티나의 바카 무에르타 셰일 가스는 변동성이 심화되는 발전 설비군을 안정화시키는 견실한 설비 확충을 뒷받침하고 있습니다. 안데스-퍼시픽 고전압 직류 송전선을 포함한 국경을 넘는 연계선은 우기와 건기 사이에 수력 발전을 최적화하는 지역 간 거래를 가능하게 하고 있습니다.
유럽은 2025년 전 세계 발전 용량의 22.80%를 차지했으며, 2022년 가스 위기를 계기로 유연성과 에너지 안보 강화에 주력했습니다. 독일은 17GW의 재생에너지 설비를 도입한 한편, 주파수 조절의 균형을 맞추기 위해 북유럽의 수력 발전 및 프랑스의 원자력 발전으로부터의 수입에 의존했습니다. 영국은 3.2GW의 해상 풍력 발전 설비를 추가하여 부유식 기초 부문에서의 리더십을 공고히 했습니다. 그러나 성숙한 송전망은 포화 상태가 진행되고 있으며, 음가(음의 가격)가 발생하는 시간대가 증가하고, 전력 저장 기술의 경제성이 향상됨에 따라 도매 시장에서는 정산 주기를 5분 단위로 재설정하기 위해 분주히 움직이고 있습니다. 북미와 중동 및 아프리카는 점유율 면에서는 뒤처져 있지만, 유망한 성장이 예상됩니다. 미국에서는 IRA(인플레이션 억제법)의 세액 공제 혜택에 힘입어 2024년에 32GW의 재생에너지를 도입했습니다. 또한 아랍에미리트(UAE)는 2071년 넷제로 로드맵에 5.6GW 규모의 태양광 발전 설비를 포함시켰습니다. 이처럼 지역적 다각화를 통해 세계 전력 시장은 특정 지역에서 발생하는 정책이나 자원 충격에 대한 완충재 역할을 하고 있습니다.
기타 혜택
- 엑셀 형식 시장 예측(ME) 시트
- 3개월간의 애널리스트 지원
자주 묻는 질문
목차
제1장 서론
제2장 조사 방법
제3장 주요 요약
제4장 시장 구도
제5장 시장 규모와 성장 예측
제6장 경쟁 구도
제7장 시장 기회와 향후 전망
JHS 26.09.11According to Mordor Intelligence, the power market size was valued at 10.29 Thousand gigawatt in 2025 and estimated to grow from 11.17 Thousand gigawatt in 2026 to reach 16.83 Thousand gigawatt by 2031, at a CAGR of 8.55% during the forecast period (2026-2031).
This report is Segmented by Power Source (Thermal, Nuclear, and Renewables) and End-User (Utilities, Commercial and Industrial, and Residential), and Geography (North America, Europe, Asia-Pacific, South America, and Middle East and Africa). The Market Sizes and Forecasts are Provided in Terms of Installed Capacity (GW).
Global Power Market Trends and Insights
Explosive Data-Center Electricity Demand Surge
Data centers consumed 460 TWh in 2024, equaling Argentina's entire annual load and representing 2% of world electricity. Average hyperscale campuses now draw 100-200 MW of continuous power, forcing utilities to renegotiate interconnection rules and fast-track substation upgrades. Corporate buyers contracted 23.7 GW of clean energy in 2024 as tech giants sidestepped traditional utility supply models to secure 24/7 renewables. Virginia's "data-center alley" already absorbs 25% of statewide generation, prompting regulators to revise capacity-market participation rules [PJM.com]. These concentrated loads heighten voltage-stability risk and drive premium capacity-contract pricing that flows through to retail tariffs. The global power market is therefore recalibrating around localized baseload spikes that were uncommon a decade ago.
Electrification of Industrial Heat & Transport
Electric arc furnaces captured 73% of new steel capacity in 2024, and heat pumps displaced natural gas in 40% of European industrial heating retrofits. On the mobility side, 14.1 million EVs added 85 TWh of net demand yet supplied 280 GWh of vehicle-to-grid storage that helped shave evening peaks. Nordic grids illustrate the convergence: synchronized EV charging and industrial heat-pump cycles create time-bundled consumption spikes that are balanced through granular tariff signals and AI-based dispatch. Aluminum smelters and chemical complexes are already relocating to wind-rich zones to capture cheap, firmed renewable power, locking in 15-20-year offtakes that underpin local transmission expansion. As similar patterns echo worldwide, the global power market anticipates sustained 15-20% rises in industrial consumption that call for USD 45 billion of annual distribution hardening.
Grid Bottlenecks & Permitting Delays
Transmission constraints sidelined 127 GW of shovel-ready renewables in 2024, translating into a USD 340 billion investment backlog. U.S. interconnection queues ballooned to 2,600 GW, five times the present grid capacity, with average study cycles extending 5.2 years. European cross-border lines ran at 95% utilization during windy hours, forcing 47 TWh of curtailment, particularly in Spain and Germany. Policymakers reacted by capping review periods to 12 months for pre-zoned projects under the EU Net-Zero Industry Act, yet community opposition still delays one in four HVDC builds. If unaddressed, these chokepoints could undercut the global power market's decarbonization pathway by deferring capital and eroding investor confidence.
Other drivers and restraints analyzed in the detailed report include:
- Government Clean-Energy Subsidy Waves
- Rapid Cost Decline in Utility-Scale Battery Storage
- Critical-Mineral Supply-Chain Volatility
For complete list of drivers and restraints, kindly check the Table Of Contents.
Segment Analysis
Renewables commanded 47.95% of 2025 installed capacity and are scaling at 13.70% CAGR through 2031, underpinned by a record 346 GW of new solar and 116 GW of wind commissioned during the year. Solar photovoltaics, cheaper than marginal gas in most regions, dominate daytime supply and compress peak-price spreads. Wind plays the complementary role during evening hours, though integration challenges rise as variable output surpasses 30% of national mixes in 15 countries. Offshore wind, growing at a 23.10% CAGR, captures deep-water sites through floating foundations, accelerating uptake in Japan, South Korea, and California. Simultaneously, nuclear restarts and small modular reactor pilots add a nascent but strategic avenue for firm, low-carbon generation that can anchor industrial heat contracts. Coal and oil plants continue to retire or retrofit; 47 GW of coal capacity announced hydrogen co-firing conversions in 2024, though commercial viability remains tied to carbon prices above USD 80 per ton.
High renewable penetration tilts planning toward flexibility assets. Grid operators worldwide will require USD 2.8 trillion in cumulative investment for batteries, pumped-hydro, demand response, and expanded interconnectors over 2026-2031. Battery storage integration softens solar midday oversupply, while cross-border HVDC links move surplus wind to load centers. As these levers scale, the global power market embeds resilience through diversified resource stacks rather than single-fuel dominance. The renewables boom, therefore, redefines capital allocation, regulatory frameworks, and merchant-price formation across global electricity systems.
Complete Report Scope:
- By Power-Generation Source
- Thermal (Coal, Natural Gas, Oil and Diesel)
- Nuclear
- Renewables (Solar, Wind, Hydro, Geothermal, Biomass & Waste, Tidal)
- By End-User
- Utilities
- Commercial and Industrial
- Residential
- By T&D Voltage Level (Qualitative Analysis only)
- High-Voltage Transmission (Above 230 kV)
- Sub-Transmission (69 to 161 kV)
- Medium-Voltage Distribution (13.2 to 34.5 kV)
- Low-Voltage Distribution (Up to 1 kV)
- By Geography
- North America
- United States
- Canada
- Mexico
- Europe
- United Kingdom
- Germany
- France
- Spain
- Nordic Countries
- Russia
- Rest of Europe
- Asia-Pacific
- China
- India
- Japan
- South Korea
- Malaysia
- Thailand
- Indonesia
- Vietnam
- Australia
- Rest of Asia-Pacific
- South America
- Brazil
- Argentina
- Colombia
- Rest of South America
- Middle East and Africa
- United Arab Emirates
- Saudi Arabia
- South Africa
- Egypt
- Rest of Middle East and Africa
- North America
Geography Analysis
Asia-Pacific led the global power market with 44.20% capacity share in 2025, anchored by China's 1,411 GW fleet and India's 425 GW. China commissioned 216 GW of new renewables during the year, more than Germany's installed base, yet also added 47 GW of coal to safeguard grid inertia. India, by contrast, balances solar ambition with regional battery tenders that target 50 GWh of storage by 2026. Japan and South Korea lean on offshore wind and advanced nuclear to curb imported-fuel dependence; Japan intends to reach 45 GW of offshore turbines by 2040, while South Korea experiments with 12 GW of floating solar. The region's integration strain remains high, with renewable curtailment surpassing 8.2% in northwest China due to limited transmission, underscoring the urgency of interprovincial HVDC lines.
South America emerged as the fastest-expanding slice of the global power market at 15.10% CAGR, propelled by green-hydrogen hubs in Chile and lithium-driven grid storage demand in Argentina and Brazil. Brazil boasts 195 GW of installed capacity, leveraging low-cost wind and hydro to decarbonize mining and agriculture. Chile's Atacama solar boom supplies both mining loads and hydrogen export terminals, achieving sub-USD 30/MWh levelized costs. Beyond renewables, Argentina's Vaca Muerta shale gas underpins firm capacity additions that stabilize an increasingly variable generation fleet. Cross-border interconnectors, including the Andes-Pacific HVDC, unlock regional trade that optimizes hydropower between wet and dry seasons.
Europe sustained 22.80% of global capacity in 2025, concentrating on flexibility and energy-security upgrades after the 2022 gas crisis. Germany installed 17 GW of renewables while leaning on Nordic hydro and French nuclear imports to balance frequency. The United Kingdom added 3.2 GW of offshore wind, cementing its leadership in floating foundations. Yet mature grids confront rising saturation; negative-price hours proliferate, storage economics improve, and wholesale markets scramble to reconfigure settlement periods to five minutes. North America and the Middle East & Africa lag in share but represent promising growth. The United States installed 32 GW of renewables in 2024, buoyed by IRA tax credits, and the UAE put 5.6 GW of solar into its 2071 net-zero roadmap. Regional diversification, therefore, buffers the global power market against policy or resource shocks in any single geography.
- State Grid Corporation of China
- Engie SA
- Enel SpA
- Tokyo Electric Power Co. Holdings
- NTPC Ltd
- Dominion Energy
- China Huaneng Group
- Duke Energy
- E.ON SE
- Siemens Energy
- Hitachi Energy
- Electricite de France (EDF)
- Iberdrola SA
- Korea Electric Power Corp. (KEPCO)
- NextEra Energy
- Southern Company
- Exelon Corporation
- China Three Gorges Corp.
- Orsted A/S
- RWE AG
- General Electric Vernova
- Mitsubishi Electric
Additional Benefits:
- The market estimate (ME) sheet in Excel format
- 3 months of analyst support
TABLE OF CONTENTS
1 Introduction
- 1.1 Study Assumptions & Market Definition
- 1.2 Scope of the Study
2 Research Methodology
3 Executive Summary
4 Market Landscape
- 4.1 Market Overview
- 4.2 Market Drivers
- 4.2.1 Explosive data-center electricity demand surge
- 4.2.2 Electrification of industrial heat & transport
- 4.2.3 Government clean-energy subsidy waves (IRA, REPowerEU, etc.)
- 4.2.4 Rapid cost decline in utility-scale battery storage
- 4.2.5 Cross-border HVDC super-grid build-outs
- 4.2.6 Green-hydrogen electrolyzer build-outs raising baseload demand
- 4.3 Market Restraints
- 4.3.1 Grid bottlenecks & permitting delays
- 4.3.2 Critical-mineral supply-chain volatility
- 4.3.3 Rising renewable curtailment in saturated grids
- 4.3.4 Climate-induced hydropower variability
- 4.4 Supply-Chain Analysis
- 4.5 Regulatory Landscape
- 4.6 Technological Outlook (Smart Grids, BESS, AI-enabled Dispatch)
- 4.7 Renewable Energy Mix Snapshot (2024)
- 4.8 Installed Power-Generation Capacity Outlook (GW)
- 4.9 Electricity Generation Outlook (TWh)
- 4.10 Primary Energy Consumption Trend (Mtoe)
- 4.11 Porter's Five Forces
- 4.11.1 Bargaining Power of Suppliers
- 4.11.2 Bargaining Power of Consumers
- 4.11.3 Threat of New Entrants
- 4.11.4 Threat of Substitutes
- 4.11.5 Intensity of Competitive Rivalry
5 Market Size & Growth Forecasts
- 5.1 By Power-Generation Source
- 5.1.1 Thermal (Coal, Natural Gas, Oil and Diesel)
- 5.1.2 Nuclear
- 5.1.3 Renewables (Solar, Wind, Hydro, Geothermal, Biomass & Waste, Tidal)
- 5.2 By End-User
- 5.2.1 Utilities
- 5.2.2 Commercial and Industrial
- 5.2.3 Residential
- 5.3 By T&D Voltage Level (Qualitative Analysis only)
- 5.3.1 High-Voltage Transmission (Above 230 kV)
- 5.3.2 Sub-Transmission (69 to 161 kV)
- 5.3.3 Medium-Voltage Distribution (13.2 to 34.5 kV)
- 5.3.4 Low-Voltage Distribution (Up to 1 kV)
- 5.4 By Geography
- 5.4.1 North America
- 5.4.1.1 United States
- 5.4.1.2 Canada
- 5.4.1.3 Mexico
- 5.4.2 Europe
- 5.4.2.1 United Kingdom
- 5.4.2.2 Germany
- 5.4.2.3 France
- 5.4.2.4 Spain
- 5.4.2.5 Nordic Countries
- 5.4.2.6 Russia
- 5.4.2.7 Rest of Europe
- 5.4.3 Asia-Pacific
- 5.4.3.1 China
- 5.4.3.2 India
- 5.4.3.3 Japan
- 5.4.3.4 South Korea
- 5.4.3.5 Malaysia
- 5.4.3.6 Thailand
- 5.4.3.7 Indonesia
- 5.4.3.8 Vietnam
- 5.4.3.9 Australia
- 5.4.3.10 Rest of Asia-Pacific
- 5.4.4 South America
- 5.4.4.1 Brazil
- 5.4.4.2 Argentina
- 5.4.4.3 Colombia
- 5.4.4.4 Rest of South America
- 5.4.5 Middle East and Africa
- 5.4.5.1 United Arab Emirates
- 5.4.5.2 Saudi Arabia
- 5.4.5.3 South Africa
- 5.4.5.4 Egypt
- 5.4.5.5 Rest of Middle East and Africa
- 5.4.1 North America
6 Competitive Landscape
- 6.1 Market Concentration
- 6.2 Strategic Moves (M&A, JVs, Funding, PPAs)
- 6.3 Market Share Analysis (Market Rank/Share for key companies)
- 6.4 Company Profiles (includes Global-level Overview, Market-level Overview, Core Segments, Financials, Strategic Information, Products & Services, Recent Developments)
- 6.4.1 State Grid Corporation of China
- 6.4.2 Engie SA
- 6.4.3 Enel SpA
- 6.4.4 Tokyo Electric Power Co. Holdings
- 6.4.5 NTPC Ltd
- 6.4.6 Dominion Energy
- 6.4.7 China Huaneng Group
- 6.4.8 Duke Energy
- 6.4.9 E.ON SE
- 6.4.10 Siemens Energy
- 6.4.11 Hitachi Energy
- 6.4.12 Electricite de France (EDF)
- 6.4.13 Iberdrola SA
- 6.4.14 Korea Electric Power Corp. (KEPCO)
- 6.4.15 NextEra Energy
- 6.4.16 Southern Company
- 6.4.17 Exelon Corporation
- 6.4.18 China Three Gorges Corp.
- 6.4.19 Orsted A/S
- 6.4.20 RWE AG
- 6.4.21 General Electric Vernova
- 6.4.22 Mitsubishi Electric
7 Market Opportunities & Future Outlook
- 7.1 White-Space & Unmet-Need Assessment


