

|
시장보고서
상품코드
2124441
유럽의 전력 시장 시장 : 점유율 분석, 업계 동향과 통계, 성장 예측(2026-2031년)Europe Power - Market Share Analysis, Industry Trends & Statistics, Growth Forecasts (2026 - 2031) |
||||||
 Mordor Intelligence
Mordor Intelligence에 의하면, 유럽 전력 시장 규모(설치용량 기반)는 2026년 1.95 테라왓트에서 2031년까지 2.49 테라왓트로 확대되어 예측 기간(2026-2031년) CAGR은 5.06%가 된다고 전망되고 있습니다.
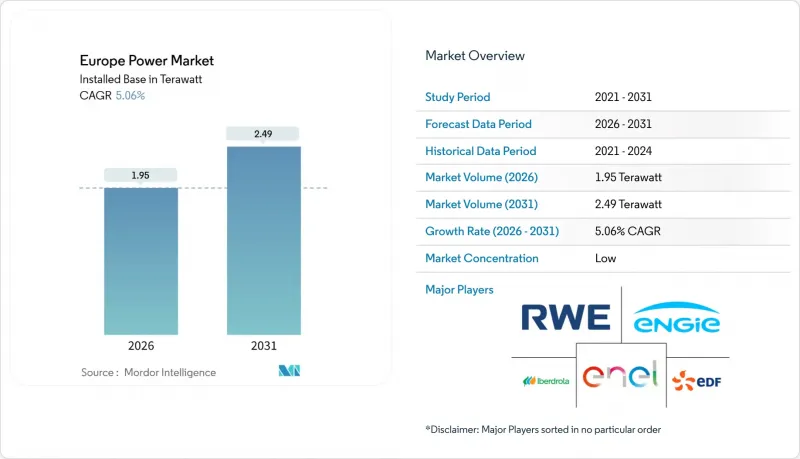
본 보고서는 동력원(화력, 원자력, 재생에너지), 최종 사용자별(유틸리티, 상업 및 산업, 주거), 지역별(영국, 독일, 프랑스, 스페인, 노르웨이, 덴마크, 스웨덴, 폴란드, 러시아, 기타 유럽)로 분류되어 있습니다. 시장 규모 및 전망은 설치 용량(GW) 단위로 표시되어 있습니다.
유럽 전력 시장 동향과 인사이트
EU의 ‘Fit-for-55’ 및 ‘REPowerEU’에 따른 탈탄소화 의무
2030년까지 재생에너지 비중을 42.5%로 높이고, 2050년까지 순배출 제로를 달성해야 한다는 의무화로 인해, 유럽 전력 시장에서 개발 사업자들에게 장기적인 수익 전망이 확고해졌으며, 독일의 태양광 발전 연간 신규 도입량은 15GW,육상 풍력은 10GW에 달하여, 2020년부터 2023년까지의 연간 평균 도입량의 3배에 이르렀습니다. 우선 지역 내 승인 기간을 12개월로 제한하는 허가 절차의 합리화를 통해, 과거 5년에 달하던 도입 지연이 해소되고 있습니다. 한편, 3,000억 유로 규모의 REPowerEU 자금을 통해 경제 회복을 위한 지출이 송전망 강화 및 배터리 설치로 전환되고 있습니다. 전력 회사의 투자 포트폴리오도 이에 발맞추어 변화하고 있으며, 2026년도 예산의 50% 이상을 재생에너지 및 디지털 네트워크에 배정하고 있습니다. 송전망 규정에서는 현재 반응 속도가 빠른 배터리 저장 설비에 우대 조치를 적용하고 있어, 2024년에는 10GWh 규모의 증설이 예상됩니다. 택소노미(분류 기준) 체계 역시 마찬가지로 큰 영향력을 행사하고 있습니다. ‘현저한 해를 끼치지 않는다’는 규칙에 따라 재활용 및 순환 경제 계획을 갖춘 프로젝트가 우선시되므로, 터빈 제조업체들은 프랑스와 스페인에 블레이드 재활용 라인 설치를 발표하고 있습니다.
육상 풍력·대규모 태양광 발전의 LCOE가 사상 최저치를 기록
육상 풍력의 LCOE는 1MWh당 35유로, 대규모 태양광 발전은 1MWh당 40유로로, 2024년 석탄·가스 발전의 벤치마크 가격보다 50% 이상 낮아져, 유럽 전력 시장에서 재생에너지가 기본적인 전력 공급 선택지로 자리 잡고 있습니다. 효율 향상은 현저합니다. 6MW 육상 풍력 터빈은 2020년형 기종에 비해 발전량이 30% 증가했으며, 양면 수광형 패널은 태양광 발전 출력을 최대 15% 향상시켰습니다. 스페인의 2024년 입찰은 1MWh당 28유로에 성사된 반면, 영국의 최신 차액결제계약(CfD) 라운드에서는 해상 풍력이 1MWh당 44파운드(56달러)에 조달되었습니다. 다만, LCOE의 하락에는 ‘가격의 역설’이 수반됩니다. 덴마크에서는 태양광 발전의 높은 보급률로 인해 2024년에 42일간 정오 도매 가격이 마이너스를 기록했습니다. 이로 인해 ‘Power-to-X’용 전해 장치 도입이 가속화되어, 같은 해 도입 용량은 2GW에 달했습니다. 현재 프로젝트의 경제성에는 부대 서비스 수익이 반영되어 있으며, 이는 투자자들에게 새로운 평가 지표가 되고 있습니다.
장기화되는 송전망 허가 절차와 NIMBY(인근 주민의 반대)
송전망 건설 기간은 평균 7-10년이지만, 지역별 과제로 인해 2-3년이 추가로 소요됩니다. 이는 2028년 첫 발전 시점에 건설 시작부터 13년이 경과하게 되는 독일의 700km에 달하는 ‘SuedLink’ 프로젝트에서도 뚜렷이 나타나며, 유럽 전력 시장이 안고 있는 중요한 과제를 여실히 드러내고 있습니다. 프랑스 송전계통운영자(TSO)의 보고에 따르면, 프로젝트의 40%가 소송에 직면해 있으며, 특히 해상 풍력 발전의 육상 연결 지점 부근에서 이러한 경향이 두드러집니다. 영국에서는 739GW에 달하는 연결 대기 프로젝트가 있으며, 일부 프로젝트의 대기 시간이 15년에 달하기 때문에 ‘준비가 완료된 순서대로 연결한다’는 새로운 규정이 도입되었습니다. 스페인에서는 지정 구역 내 승인 기간을 18개월로 단축했으나, 카탈루냐주와 안달루시아주에서는 시행이 지연되면서 불확실성이 여전히 높은 수준을 유지하고 있습니다. 이러한 지연으로 인해 2022년부터 2024년까지 독일의 풍력 및 태양광 발전 프로젝트 제안 12GW가 무산되었으며, 이는 150억 유로에 달하는 자본의 정체로 이어졌습니다.
부문별 분석
2025년, 재생에너지는 유럽 전력 시장의 59.40%를 차지하며, 그 도입량은 2031년까지 연평균 성장률(CAGR) 8.51%로 확대되고 있습니다. 해상 풍력이 주도적인 역할을 하고 있으며, 2024년에는 5GW가 도입되었고, 덴마크의 3.5GW 규모 ‘혼시 3’ 및 북해의 여러 클러스터를 필두로 25GW 규모의 건설 대기 프로젝트가 대기 중입니다. 육상 풍력은 2024년에 12GW가 증가했으며, 주요 도입국은 스페인, 독일, 스웨덴이었습니다. 한편, 대규모 태양광 발전은 18GW 증가했는데, 이는 스페인이 사상 최대인 6GW를 기여한 것을 반영한 것입니다. 수력 발전은 약 200GW로 안정세를 보이고 있지만, 2024년 오스트리아에서 1GW 규모의 양수 발전소가 가동을 시작한 것은 장시간 전력 저장에 대한 관심이 다시 높아지고 있음을 보여줍니다. 바이오매스, 폐기물 발전, 지열, 조력 발전을 합쳐도 총 발전 용량의 5% 미만에 그치고 있지만, 틈새 시장인 순환형 경제나 도서 지역 수요를 충족시키고 있습니다. 변동 비용이 낮은 재생에너지의 유입으로 발전 순서가 변화하고 있으며, 화력 발전소는 피크 대응 역할로 밀려나면서 설비 가동률은 2015년 60%에서 30%-40%로 하락했습니다.
기존 방식의 발전은 여전히 전력계의 안정성을 뒷받침하고 있습니다. 천연가스 터빈은 약 200GW의 유연한 백업 전력을 제공하고 있으며, 잔류 탄소 배출을 줄이기 위한 수소 대응 모델도 등장하고 있습니다. 독일의 탈원전 정책에도 불구하고, 프랑스와 영국에서는 원자력 발전이 지역 전체적으로 120GW를 차지하며 여전히 중요한 위치를 점하고 있습니다. 석탄 화력 발전소의 폐지로 인해 배출 감축 여지가 생기지만, 충분한 저장 설비가 가동되기 전까지는 공급 부족이 발생할 것입니다. 따라서 유럽 전력 시장에서 유연한 백업 기술의 규모는 투자자들의 주목을 받고 있으며, 2031년까지 양수 발전, 배터리 팜, 수소 대응형 가스 발전이 신규 건설 투자의 15% 이상을 차지할 것으로 예측됩니다.
기타 혜택:
- 엑셀 형식 시장 예측(ME) 시트
- 3개월간의 애널리스트 지원
자주 묻는 질문
목차
제1장 서론
제2장 조사 방법
제3장 주요 요약
제4장 시장 구도
제5장 시장 규모와 성장 예측
제6장 경쟁 구도
제7장 시장 기회와 향후 전망
JHS 26.09.11According to Mordor Intelligence, the Europe power market size in terms of installed base is expected to grow from 1.95 Terawatt in 2026 to 2.49 Terawatt by 2031, at a CAGR of 5.06% during the forecast period (2026-2031).
This report is Segmented by Power Source (Thermal, Nuclear, and Renewables), End User (Utilities, Commercial and Industrial, and Residential), and Geography (United Kingdom, Germany, France, Spain, Norway, Denmark, Sweden, Poland, Russia, and Rest of Europe). The Market Sizes and Forecasts are Provided in Terms of Installed Capacity (GW).
Europe Power Market Trends and Insights
EU Fit-for-55 & REPowerEU Decarbonization Mandates
Mandated renewable shares of 42.5% by 2030 and net-zero by 2050 have anchored long-term revenue visibility in the european power market for developers, pushing annual solar additions in Germany to 15 GW and onshore wind to 10 GW, triple the 2020-2023 run-rate. Streamlined permitting that caps approvals at 12 months in priority zones is easing deployment backlogs that once stretched five years, while EUR 300 billion of REPowerEU funds redirects recovery spending toward grid reinforcement and battery co-location. Utility investment portfolios are shifting in tandem, allocating more than 50% of 2026 budgets to renewables and digital networks. Grid codes now reward fast-acting battery storage, spurring 10 GWh of additions in 2024. The taxonomy framework is equally influential because "do-no-significant-harm" rules favor projects with recycling or circular-economy plans, leading turbine makers to announce blade-recycling lines in France and Spain.
Record-Low LCOE of Onshore Wind & Utility-Scale Solar
Onshore wind at EUR 35 per MWh and utility solar at EUR 40 per MWh undercut 2024 coal and gas benchmarks by more than 50%, turning renewables into the default capacity choice in the european power market. Efficiency gains are material: 6 MW onshore turbines yield 30% more output than 2020 machines, and bifacial panels raise solar yields by up to 15%. Spain's 2024 tender cleared at EUR 28 per MWh, while the United Kingdom's latest Contracts-for-Difference round delivered offshore wind at GBP 44 per MWh (USD 56). LCOE deflation has a price-paradox, though; high solar penetration in Denmark triggered midday negative wholesale prices on 42 days in 2024, accelerating power-to-X electrolyzer uptake that reached 2 GW that year. Project economics now embed ancillary-service revenue, adding new valuation levers for investors.
Lengthy Grid Permitting & NIMBY Opposition
Grid build-times average 7-10 years, with local challenges adding two to three years, evident in Germany's 700 km SuedLink that will be 13 years old by first power in 2028, highlighting a key challenge for the european power market. France's TSO reports that 40% of projects face lawsuits, especially near coastal landing points for offshore wind connections. In the United Kingdom, a connection queue of 739 GW stretches out to 15 years for some projects, prompting new "first ready, first connected" rules. Spain cut approval windows to 18 months in designated zones, yet implementation lags in Catalonia and Andalusia, keeping uncertainty high. The delays stranded 12 GW of German wind and solar proposals between 2022 and 2024, equal to EUR 15 billion of stalled capital.
Other drivers and restraints analyzed in the detailed report include:
- Accelerated Coal & Nuclear Phase-Outs Post-2025
- Digitalisation of Grids (AI-Enabled Predictive O&M)
- Congested Cross-Border Interconnector Capacity
For complete list of drivers and restraints, kindly check the Table Of Contents.
Segment Analysis
Renewables contributed 59.40% of the European power market in 2025, and their installed base is advancing at an 8.51% CAGR through 2031. Offshore wind is taking the lead, with 5 GW installed in 2024 and a 25 GW construction queue led by Denmark's 3.5 GW Hornsea Three and several North Sea clusters. Onshore wind added 12 GW in 2024, mainly in Spain, Germany, and Sweden, while utility solar added 18 GW, reflecting Spain's record 6 GW contribution. Hydro remains steady at roughly 200 GW, though Austria's 1 GW pumped-storage commissioning in 2024 highlighted renewed interest in long-duration storage. Biomass, waste-to-energy, geothermal, and tidal together stay below 5% of capacity but meet niche circular-economy and island-mode needs. The influx of low-variable-cost renewables is altering dispatch order, pushing thermal plants into peaker roles with 30%-40% capacity factors versus 60% in 2015.
Conventional generation still anchors system stability. Natural-gas turbines provide about 200 GW of flexible backup, and hydrogen-ready models are emerging to cut residual carbon. Nuclear remains prominent in France and the United Kingdom at 120 GW region-wide, despite Germany's exit. Retiring coal blocks free emissions headroom but leave adequacy gaps until sufficient storage comes online. The Europe power market size for flexible backup technologies is therefore gaining investor attention, with pumped-storage, battery farms, and hydrogen-ready gas expected to command more than 15% of new-build spending by 2031.
Complete Report Scope:
- By Power Source
- Thermal (Coal, Natural Gas, Oil and Diesel)
- Nuclear
- Renewables (Solar, Wind, Hydro, Geothermal, Biomass & Waste, Tidal)
- By End User
- Utilities
- Commercial and Industrial
- Residential
- By T&D Voltage Level (Qualitative Analysis only)
- High-Voltage Transmission (Above 230 kV)
- Sub-Transmission (69 to 161 kV)
- Medium-Voltage Distribution (13.2 to 34.5 kV)
- Low-Voltage Distribution (Up to 1 kV)
- By Geography
- United Kingdom
- Germany
- France
- Spain
- Norway
- Denmark
- Sweden
- Poland
- Russia
- Rest of Europe
List of Companies Covered in this Report:
- EDF
- Enel
- Iberdrola
- RWE
- Engie
- Statkraft
- Orsted
- National Grid
- Vattenfall
- E.ON
- Verbund
- Fortum
- SSE
- CEZ Group
- Terna
- TenneT
- Red Electrica (REE)
- Agder Energi
- Energinet
- REN
Additional Benefits:
- The market estimate (ME) sheet in Excel format
- 3 months of analyst support
TABLE OF CONTENTS
1 Introduction
- 1.1 Study Assumptions & Market Definition
- 1.2 Scope of the Study
2 Research Methodology
3 Executive Summary
4 Market Landscape
- 4.1 Market Overview
- 4.2 Market Drivers
- 4.2.1 EU Fit-for-55 & REPowerEU decarbonization mandates
- 4.2.2 Record-low LCOE of onshore wind & utility-scale solar
- 4.2.3 Accelerated coal & nuclear phase-outs post-2025
- 4.2.4 Digitalisation of grids (AI-enabled predictive O&M)
- 4.2.5 Data-centre electricity demand surge (>20 TWh by 2030)
- 4.2.6 Hydrogen-ready CCGT retrofits unlocking flexible backup
- 4.3 Market Restraints
- 4.3.1 Congested cross-border interconnector capacity
- 4.3.2 Lengthy grid permitting & NIMBY opposition
- 4.3.3 Volatile wholesale prices eroding utility margins
- 4.3.4 Critical-mineral supply-chain exposure for renewables
- 4.4 Supply-Chain Analysis
- 4.5 Regulatory Landscape
- 4.6 Technological Outlook
- 4.7 Porter's Five Forces
- 4.7.1 Bargaining Power of Suppliers
- 4.7.2 Bargaining Power of Consumers
- 4.7.3 Threat of New Entrants
- 4.7.4 Threat of Substitutes
- 4.7.5 Competitive Rivalry
5 Market Size & Growth Forecasts
- 5.1 By Power Source
- 5.1.1 Thermal (Coal, Natural Gas, Oil and Diesel)
- 5.1.2 Nuclear
- 5.1.3 Renewables (Solar, Wind, Hydro, Geothermal, Biomass & Waste, Tidal)
- 5.2 By End User
- 5.2.1 Utilities
- 5.2.2 Commercial and Industrial
- 5.2.3 Residential
- 5.3 By T&D Voltage Level (Qualitative Analysis only)
- 5.3.1 High-Voltage Transmission (Above 230 kV)
- 5.3.2 Sub-Transmission (69 to 161 kV)
- 5.3.3 Medium-Voltage Distribution (13.2 to 34.5 kV)
- 5.3.4 Low-Voltage Distribution (Up to 1 kV)
- 5.4 By Geography
- 5.4.1 United Kingdom
- 5.4.2 Germany
- 5.4.3 France
- 5.4.4 Spain
- 5.4.5 Norway
- 5.4.6 Denmark
- 5.4.7 Sweden
- 5.4.8 Poland
- 5.4.9 Russia
- 5.4.10 Rest of Europe
6 Competitive Landscape
- 6.1 Market Concentration
- 6.2 Strategic Moves (M&A, JVs, Funding, PPAs)
- 6.3 Market Share Analysis (Market Rank/Share for key companies)
- 6.4 Company Profiles (includes Global-level Overview, Market-level Overview, Core Segments, Financials, Strategic Information, Products & Services, Recent Developments)
- 6.4.1 EDF
- 6.4.2 Enel
- 6.4.3 Iberdrola
- 6.4.4 RWE
- 6.4.5 Engie
- 6.4.6 Statkraft
- 6.4.7 Orsted
- 6.4.8 National Grid
- 6.4.9 Vattenfall
- 6.4.10 E.ON
- 6.4.11 Verbund
- 6.4.12 Fortum
- 6.4.13 SSE
- 6.4.14 CEZ Group
- 6.4.15 Terna
- 6.4.16 TenneT
- 6.4.17 Red Electrica (REE)
- 6.4.18 Agder Energi
- 6.4.19 Energinet
- 6.4.20 REN
7 Market Opportunities & Future Outlook
- 7.1 White-space & Unmet-need Assessment


