|
시장보고서
상품코드
2124449
디젤 연료 시장 : 점유율 분석, 업계 동향과 통계, 성장 예측(2026-2031년)Diesel As Fuel - Market Share Analysis, Industry Trends & Statistics, Growth Forecasts (2026 - 2031) |
||||||
 Mordor Intelligence
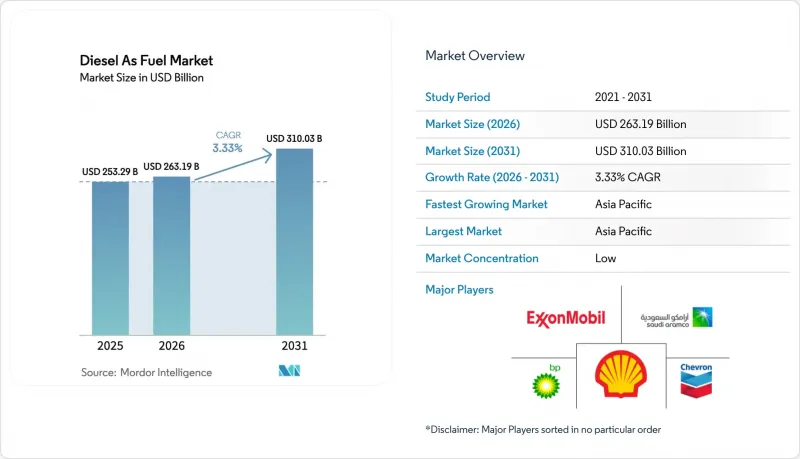
Mordor Intelligence에 의하면, 디젤 연료 시장 규모는 2025년에 2,532억 9,000만 달러로 평가되었고 2026년 2,631억 9,000만 달러에서 2031년까지 3,100억 3,000만 달러에 이를 것으로 예측되며, 예측 기간(2026-2031년) CAGR은 3.33%를 나타낼 전망입니다.
본 보고서는 등급(초저유황 디젤, 저유황 디젤, 고유황 디젤, 바이오디젤 혼합 연료, 합성 디젤), 용도(운송, 선박, 산업·건설, 농업, 발전),지역(북미, 유럽, 아시아태평양, 남미, 중동 및 아프리카)별로 분류되어 있습니다. 시장 규모 및 전망은 금액(달러) 기준으로 제시되어 있습니다.
세계 디젤 연료 시장 동향 및 인사이트
아시아 신흥국의 트럭·버스 차량 수의 급속한 증가
인도, 인도네시아, 베트남의 상용차 등록 대수는 2025년에 11% 증가하여, 전자상거래 및 콜드체인 물류가 대도시권을 넘어 확대됨에 따라 GDP 성장률을 상회했습니다. 인도의 ‘바라트마라’ 고속도로 계획에 따라 4,200km의 고속도로가 정비되면서, 사업자들이 톤킬로미터당 18% 더 많은 연료를 소비하는 대형 트럭의 도입을 촉진했습니다. 아세안(ASEAN) 국가들의 유로 V 배기가스 규제 도입 지연으로 인해 버스 시장에서는 디젤 엔진이 여전히 주류를 이루고 있으며, 적어도 2029년까지는 수요가 견조하게 유지될 전망입니다. 중국의 ‘일대일로’ 회랑을 통해 디젤 연료를 동력으로 하는 화물 운송이 중앙아시아로 유입되고 있으며, 해당 지역에서는 충전 인프라가 미비하여 액화천연가스(LNG)에 비해 30%의 비용 우위가 유지되고 있습니다. 이러한 요인들이 복합적으로 작용하여 지역 전체 수요를 끌어올리고 있으며, 디젤 연료 시장에 구조적인 호재를 가져오고 있습니다.
데이터센터 확장에 따른 비상 전원 수요의 급증
각 하이퍼스케일러 기업들은 2025년에 18기가와트의 데이터센터용량을 가동했으나, 99.999%의 가동률을 보장하기 위해서는 1메가와트당 약 120만 리터의 현장 디젤 저장량이 필요합니다. Amazon Web Services와 Microsoft Azure는 현재 발전기 시험 중 발생하는 미립자 물질 배출을 제한하기 위해 세탄가 50 이상의 ULSD(초저유황 디젤)를 지정하고 있으며, 이로 인해 업계 전체의 조달 기준이 높아지고 있습니다. 인도나 사하라 사막 이남의 아프리카 일부 등 전력망의 신뢰성이 여전히 낮은 지역에서는 발전기가 연속 가동되고 있어, 시설당 연간 사용량이 800만 리터를 초과하고 있습니다. 국제에너지기구(IEA)는 2028년까지 데이터센터 백업용 디젤 수요가 연평균 9.2% 증가할 것으로 예측하고 있으며, 이는 광범위한 탈탄소화 정책에도 불구하고 디젤 연료 시장의 회복력을 뒷받침하고 있습니다.
도시 버스 차량의 급속한 전기화
선전시는 2024년에 1만 6,000대의 버스를 모두 배터리식 전기버스로 전환하여 연간 3억 4,500만 리터의 디젤 연료 사용량을 줄였습니다. 이 노력은 다른 주요 도시에서도 본보기가 되었습니다. 런던시는 2030년까지 디젤 차량을 단계적으로 폐지하는 계획의 일환으로, 2025년에 500대의 전기 2층 버스를 발주했습니다. 2025년 전 세계 도시 지역의 버스 조달 중 전기 버스가 28%를 차지했습니다. 이는 2022년의 12%에서 증가한 수치로, 배터리 비용이 1kWh당 100달러 미만으로 떨어지고 충전 인프라가 확충된 것이 주된 요인입니다. 한편, 장거리 노선이나 지방 노선에서는 주행 거리 제한으로 인해 여전히 디젤 차량에 대한 의존이 지속되고 있으며, 이러한 양극화로 인해 도시 지역 수요는 위축되는 반면, 도시 주변 지역의 성장은 지속되고 있습니다. 이로 인해 디젤 연료 시장에는 복잡한 영향이 미치고 있습니다.
부문 분석
규제 당국이 배출 기준 강화에 합의함에 따라, 황 함량 15ppm 미만의 ULSD가 2025년 수요의 67.5%를 차지했습니다. 15-500 ppm의 저유황 디젤 연료는 정유시설 자산에 대한 투자가 부족한 시장에서 여전히 남아 있지만, 고유황 등급은 2028년까지 3% 미만의 틈새 시장으로 축소될 전망입니다. B5부터 B20에 이르는 바이오디젤 혼합 연료는 브라질의 B15 의무화, EU의 재생에너지 할당제, 미국의 주 세제 혜택 등을 배경으로 연평균 7.5%의 속도로 확대되고 있습니다. 바이오디젤 혼합 연료 시장 규모는 2031년까지 720억 달러에 달할 것으로 예측되며, 기존의 초저유황 디젤(ULSD)과 어깨를 나란히 하며 그 입지를 확대해 나갈 전망입니다. 합성 디젤은 여전히 시범 단계에 머물러 있지만, 2025년에 12억 달러의 벤처 자금이 조달된 것은 상용화로 가는 길을 시사하고 있습니다.
ULSD의 프리미엄 가격 책정으로 인해 배럴당 2-3달러의 수소화 처리 비용이 상쇄되어, 고도의 탈황 능력을 갖춘 정유사에 이익을 가져다주고 있습니다. 지방산 메틸 에스테르의 혼합은 산화 안정성을 유지하는 고세탄가 기유에 대한 수요를 견인하고 있으며, 수소화 분해 설비를 갖춘 공장의 이익률 향상에 기여하고 있습니다. 합성 디젤은 수명 주기 배출량이 85% 낮기 때문에 탄소 강도 상한선이 부과된 차량 함대에 있어 규제 준수의 수단으로 자리 잡고 있지만, 생산 비용이 리터당 1.80달러인 탓에 현재로서는 고부가가치 틈새 시장에서만 채택되고 있습니다. 전반적으로, 연료 등급의 전환은 환경 규제가 디젤 연료 시장 내의 가치 구조를 어떻게 재편하고 있는지를 보여줍니다.
지역별 분석
아시아태평양은 2025년 세계 소비량의 42.1%를 차지하며, 2031년까지 연평균 3.9%의 성장이 예상됩니다. 인도에서는 고속도로 확장 및 ‘전용 화물 회랑(Dedicated Freight Corridor)’ 프로젝트를 통해 디젤 트럭이 서비스가 미치지 않는 지역으로 도입되고 있습니다. 한편, 현지 정유사들은 바라트 스테이지 VI 기준을 준수하기 위해 초저유황 디젤(ULSD) 생산 능력을 12% 확대했습니다. 중국의 1선 도시에서는 전기 버스의 보급에 따라 수요가 감소하는 추세이지만, 충전 인프라가 미비하여 도시 간 화물 운송에서는 여전히 디젤 연료에 대한 의존도가 높은 상황이 지속되고 있습니다. 아세안 국가들, 특히 인도네시아와 베트남에서는 유로 III 규격 엔진이 여전히 합법적이며, 전자상거래로 인한 차량 대수 증가로 인해 성장이 유지되고 있습니다. 호주의 광업 부문은 고세탄가 디젤 연료 수요를 뒷받침하고 있으며, 지역 전체적으로 탈탄소화 압력이 높아지는 상황에서도 소비량을 유지하고 있습니다.
유럽에서는 탄소 가격 제도, 저배출 구역, 차량의 전기화로 인해 승용차 소비량이 감소하여 연간 1.8%의 감소가 예상됩니다. 독일, 프랑스, 영국이 감소세를 주도하고 있지만, 대형 트럭 및 선박용 벙커 연료가 총 수요를 안정시키고 있습니다. EU의 ‘재생에너지 지침 III’에 따라 바이오디젤 및 합성디젤의 도입이 촉진되고 있으며, 독일과 네덜란드가 시범 플랜트의 대부분을 보유하고 있습니다. 북미는 미국·멕시코·캐나다 간 회랑에서의 견조한 화물 운송과 데이터센터의 백업 수요 증가로 인해 2.1%의 성장이 예상됩니다. 2025년에는 동부 해안의 정유시설 폐쇄로 인해 증류유 재고가 부족해져 사상 최대의 수입을 기록하는 한편, 공급망의 취약성이 부각되었습니다.
남미와 중동이 성장의 거점으로 부상하고 있습니다. 브라질에서는 B15 혼합 연료 의무화와 기계화 농업이 수요를 끌어올리고 있으며, 아르헨티나에서는 바카 무에르타 셰일층 붐으로 인해 시추 작업을 위한 디젤 수요가 증가하고 있습니다. 사우디아라비아와 아랍에미리트(UAE)는 원료 비용의 우위를 활용하여 국내 수요를 충족시키는 동시에 아프리카 및 남아시아로의 수출을 확대하기 위해 초저유황 디젤(ULSD) 생산 능력을 증강하고 있습니다. 사하라 이남 아프리카는 여전히 미개척 시장으로, 발전기, 관개, 광업의 동력원으로 디젤 연료가 이용되고 있으나, 인프라 부족이 시장 확대의 걸림돌이 되고 있습니다. 남아프리카공화국에서 유로 V 기준으로의 전환에 따라 품질 기준은 높아졌으나, 주요 도시 이외의 지역에서는 규제 이행 상황에 편차가 있어 완전한 준수에 이르지 못하고 있습니다.
기타 혜택:
- 엑셀 형식 시장 예측(ME) 시트
- 3개월간의 애널리스트 지원
자주 묻는 질문
목차
제1장 서론
제2장 조사 방법
제3장 주요 요약
제4장 시장 구도
제5장 시장 규모와 성장 예측
제6장 경쟁 구도
제7장 시장 기회와 향후 전망
JHS 26.09.11According to Mordor Intelligence, the diesel as fuel market size was valued at USD 253.29 billion in 2025 and is estimated to grow from USD 263.19 billion in 2026 to reach USD 310.03 billion by 2031, at a CAGR of 3.33% during the forecast period (2026-2031).
This report is Segmented by Grade (Ultra-Low Sulfur Diesel, Low-Sulfur Diesel, High-Sulfur Diesel, Biodiesel Blends, and Synthetic Diesel), Application (Transportation, Marine, Industrial and Construction, Agriculture, and Power Generation), and Geography (North America, Europe, Asia-Pacific, South America, and Middle East and Africa). The Market Sizes and Forecasts are Provided in Terms of Value (USD).
Global Diesel As Fuel Market Trends and Insights
Rapid Truck & Bus Fleet Growth in Emerging Asia
Commercial vehicle registrations in India, Indonesia, and Vietnam climbed 11% in 2025, outstripping GDP growth as e-commerce and cold-chain logistics widen beyond metro hubs. India's Bharatmala highway program added 4,200 km of expressways, encouraging operators to deploy heavier trucks that consume 18% more fuel per ton-kilometer. ASEAN delays in adopting Euro-V emission norms keep diesel engines dominant for buses, effectively locking in demand through at least 2029. China's Belt and Road corridors channel diesel-powered freight into Central Asia, where sparse charging infrastructure preserves a 30% cost edge over liquefied natural gas. Together, these factors lift regional demand and provide a structural tailwind for the diesel fuel market.
Surging Demand for Backup Power in Data-Center Buildouts
Hyperscalers commissioned 18 GW of data-center capacity in 2025, and each megawatt requires roughly 1.2 million L of on-site diesel storage to guarantee 99.999% uptime. Amazon Web Services and Microsoft Azure now specify ULSD with cetane above 50 to limit particulate emissions during generator tests, raising procurement standards industry-wide. Where grids remain unreliable, such as in India and parts of sub-Saharan Africa, gensets run continuously, driving per-facility use above 8 million L annually. The International Energy Agency forecasts 9.2% annual diesel demand growth from data-center backup through 2028, reinforcing the diesel fuel market's resilience despite broader decarbonization policies.
Rapid Electrification of City Bus Fleets
Shenzhen converted its 16,000-bus fleet to battery-electric in 2024, displacing 345 million L of diesel annually and setting a standard replicated by other tier-1 cities. London ordered 500 electric double-deckers in 2025 as part of a diesel phase-out by 2030. Electric buses captured 28% of 2025 global urban procurements, up from 12% in 2022, driven by battery costs below USD 100/kWh and dense charging networks. Intercity and rural routes remain diesel-reliant due to range limits, creating a split that compresses urban demand yet sustains growth in peri-urban segments, with mixed implications for the diesel fuel market.
Other drivers and restraints analyzed in the detailed report include:
- Post-Pandemic Rebound in Global Marine Freight Ton-Miles
- Government-Mandated ULSD Adoption
- Stringent Carbon-Pricing Schemes in OECD Economies
For complete list of drivers and restraints, kindly check the Table Of Contents.
Segment Analysis
ULSD below 15 ppm sulfur captured 67.5% of 2025 demand as regulators converged on tighter emission standards. Low-sulfur diesel in the 15-500 ppm tier lingers in markets with under-invested refinery assets, while high-sulfur grades shrink to a sub-3% niche by 2028. Biodiesel blends from B5 to B20 are advancing 7.5% annually on the back of Brazil's B15 mandate, EU renewable quotas, and U.S. state tax incentives. The diesel fuel market size for biodiesel blends is projected to reach USD 72 billion by 2031, expanding its footprint alongside conventional ULSD. Synthetic diesel remains pilot-scale, yet USD 1.2 billion in 2025 venture funding signals a pathway to commercialization.
Premium pricing on ULSD offsets USD 2-3/bbl hydrotreating costs, rewarding refiners with deep desulfurization capacity. Blending of fatty-acid methyl esters drives demand for high-cetane base stocks that maintain oxidative stability, providing a margin uplift for hydrocracking-equipped plants. Synthetic diesel's 85% lower life-cycle emissions position it as a compliance lever for fleets under carbon-intensity caps, though USD 1.80/L production costs presently confine uptake to high-value niches. Collectively, grade shifts illustrate how environmental mandates are reshaping value pools within the diesel fuel market.
Complete Report Scope:
- By Grade
- Ultra-Low Sulfur Diesel (Less than 15 ppm)
- Low-Sulfur Diesel (15 to 500 ppm)
- High-Sulfur Diesel (Over 500 ppm)
- Biodiesel Blends (B5 to B20)
- Synthetic Diesel
- By Application
- Transportation
- Marine
- Industrial and Construction
- Agriculture
- Power Generation
- By Geography
- North America
- United States
- Canada
- Mexico
- Europe
- Germany
- United Kingdom
- France
- Italy
- NORDIC Countries
- Russia
- Rest of Europe
- Asia-Pacific
- China
- India
- Japan
- South Korea
- ASEAN Countries
- Australia and New Zealand
- Rest of Asia-Pacific
- South America
- Brazil
- Argentina
- Colombia
- Rest of South America
- Middle East and Africa
- Saudi Arabia
- United Arab Emirates
- South Africa
- Egypt
- Rest of Middle East and Africa
- North America
Geography Analysis
Asia-Pacific accounted for 42.1% of 2025 global consumption and is set to grow 3.9% annually through 2031. India's highway expansion and Dedicated Freight Corridor projects channel diesel trucks into underserved regions, while local refiners added 12% ULSD capacity to align with Bharat Stage VI norms. China's tier-1 cities watch demand slide as electric buses proliferate, yet intercity freight remains diesel-intensive due to sparse charging infrastructure. ASEAN economies, notably Indonesia and Vietnam, sustain growth because Euro-III engines remain legal, and e-commerce fuels fleet additions. Australia's mining sector anchors high-cetane diesel demand, preserving volume despite broader regional decarbonization pressures.
Europe experiences a 1.8% annual contraction as carbon pricing, low-emission zones, and fleet electrification shrink passenger-vehicle consumption. Germany, France, and the U.K. lead the decline, though heavy-duty trucking and marine bunker fuel stabilize aggregate demand. EU Renewable Energy Directive III boosts biodiesel and synthetic diesel uptake, with Germany and the Netherlands hosting most pilot plants. North America grows 2.1% on robust freight along the U.S.-Mexico-Canada corridor and escalating data-center backup needs. East Coast refinery closures tightened distillate stocks in 2025, prompting record imports and underscoring supply-chain exposure.
South America and the Middle East emerge as growth pockets. Brazil's B15 mandate and mechanized farming push volumes upward, while Argentina's Vaca Muerta shale boom lifts diesel for drilling operations. Saudi Arabia and the UAE increase ULSD capacity to satisfy domestic demand and export to Africa and South Asia, leveraging feedstock cost advantages. Sub-Saharan Africa remains a frontier, with diesel powering generators, irrigation, and mining, yet infrastructure gaps temper expansion. South Africa's transition to Euro-V standards raises quality benchmarks, but uneven enforcement outside major cities limits full compliance.
- Exxon Mobil
- Chevron
- Shell
- BP
- TotalEnergies
- Saudi Aramco
- Sinopec
- PetroChina
- Rosneft
- Lukoil
- ENI
- Petrobras
- Kuwait Petroleum
- QatarEnergy
- Indian Oil Corp
- Bharat Petroleum
- Reliance Industries
- Valero Energy
- Marathon Petroleum
- SK Energy
Additional Benefits:
- The market estimate (ME) sheet in Excel format
- 3 months of analyst support
TABLE OF CONTENTS
1 Introduction
- 1.1 Study Assumptions & Market Definition
- 1.2 Scope of the Study
2 Research Methodology
3 Executive Summary
4 Market Landscape
- 4.1 Market Overview
- 4.2 Market Drivers
- 4.2.1 Rapid truck & bus fleet growth in emerging Asia
- 4.2.2 Surging demand for backup power in data-center buildouts
- 4.2.3 Post-pandemic rebound in global marine freight ton-miles
- 4.2.4 Government-mandated ultra-low-sulfur diesel (ULSD) adoption
- 4.2.5 Rise of synthetic e-diesel pilots in Europe
- 4.2.6 Mining sector's shift from coal to high-cetane diesel blends
- 4.3 Market Restraints
- 4.3.1 Rapid electrification of city bus fleets
- 4.3.2 Stringent carbon-pricing schemes in OECD economies
- 4.3.3 AI-optimised route planning cutting long-haul diesel usage
- 4.3.4 Growing investor divestment from fossil-fuel refining
- 4.4 Supply-Chain Analysis
- 4.5 Regulatory Landscape
- 4.6 Technological Outlook
- 4.7 Porter's Five Forces
- 4.7.1 Bargaining Power of Suppliers
- 4.7.2 Bargaining Power of Buyers
- 4.7.3 Threat of New Entrants
- 4.7.4 Threat of Substitute Products
- 4.7.5 Competitive Rivalry
5 Market Size & Growth Forecasts
- 5.1 By Grade
- 5.1.1 Ultra-Low Sulfur Diesel (Less than 15 ppm)
- 5.1.2 Low-Sulfur Diesel (15 to 500 ppm)
- 5.1.3 High-Sulfur Diesel (Over 500 ppm)
- 5.1.4 Biodiesel Blends (B5 to B20)
- 5.1.5 Synthetic Diesel
- 5.2 By Application
- 5.2.1 Transportation
- 5.2.2 Marine
- 5.2.3 Industrial and Construction
- 5.2.4 Agriculture
- 5.2.5 Power Generation
- 5.3 By Geography
- 5.3.1 North America
- 5.3.1.1 United States
- 5.3.1.2 Canada
- 5.3.1.3 Mexico
- 5.3.2 Europe
- 5.3.2.1 Germany
- 5.3.2.2 United Kingdom
- 5.3.2.3 France
- 5.3.2.4 Italy
- 5.3.2.5 NORDIC Countries
- 5.3.2.6 Russia
- 5.3.2.7 Rest of Europe
- 5.3.3 Asia-Pacific
- 5.3.3.1 China
- 5.3.3.2 India
- 5.3.3.3 Japan
- 5.3.3.4 South Korea
- 5.3.3.5 ASEAN Countries
- 5.3.3.6 Australia and New Zealand
- 5.3.3.7 Rest of Asia-Pacific
- 5.3.4 South America
- 5.3.4.1 Brazil
- 5.3.4.2 Argentina
- 5.3.4.3 Colombia
- 5.3.4.4 Rest of South America
- 5.3.5 Middle East and Africa
- 5.3.5.1 Saudi Arabia
- 5.3.5.2 United Arab Emirates
- 5.3.5.3 South Africa
- 5.3.5.4 Egypt
- 5.3.5.5 Rest of Middle East and Africa
- 5.3.1 North America
6 Competitive Landscape
- 6.1 Market Concentration
- 6.2 Strategic Moves (M&A, Partnerships, PPAs)
- 6.3 Market Share Analysis (Market Rank/Share for key companies)
- 6.4 Company Profiles (includes Global level Overview, Market level overview, Core Segments, Financials as available, Strategic Information, Products & Services, and Recent Developments)
- 6.4.1 Exxon Mobil
- 6.4.2 Chevron
- 6.4.3 Shell
- 6.4.4 BP
- 6.4.5 TotalEnergies
- 6.4.6 Saudi Aramco
- 6.4.7 Sinopec
- 6.4.8 PetroChina
- 6.4.9 Rosneft
- 6.4.10 Lukoil
- 6.4.11 ENI
- 6.4.12 Petrobras
- 6.4.13 Kuwait Petroleum
- 6.4.14 QatarEnergy
- 6.4.15 Indian Oil Corp
- 6.4.16 Bharat Petroleum
- 6.4.17 Reliance Industries
- 6.4.18 Valero Energy
- 6.4.19 Marathon Petroleum
- 6.4.20 SK Energy
7 Market Opportunities & Future Outlook
- 7.1 White-space & Unmet-Need Assessment