
|
시장보고서
상품코드
2124481
광산용 실험실 자동화 : 시장 점유율 분석, 업계 동향 및 통계, 성장 예측(2026-2031년)Mining Laboratory Automation - Market Share Analysis, Industry Trends & Statistics, Growth Forecasts (2026 - 2031) |
||||||
 Mordor Intelligence
Mordor Intelligence에 의하면, 2026년 광산용 실험실 자동화 시장 규모는 79억 5,000만 달러로 추정되고 2025년 72억 2,000만 달러에서 확대해, 2031년에는 128억 8,000만 달러에 이를 것으로 예측됩니다.
2026년부터 2031년까지의 연평균 성장률(CAGR)은 10.13%를 나타낼 전망입니다.
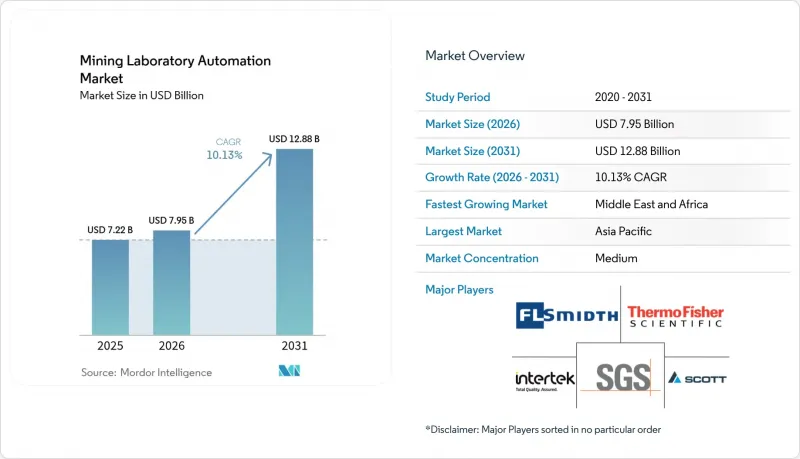
본 보고서는 제품별(로봇, LIMS, 컨테이너 실험실 등), 자동화 수준별(전체 실험실, 모듈식), 광업 단계별(탐사, 생산, 폐광 등),상품별(철광석, 구리, 금, 배터리용 광물), 최종 사용자별(대형 광업 기업, 중견·신흥 광산 기업), 지역별로 분류되어 있습니다. 시장 예측은 금액(달러) 기준으로 제시되어 있습니다.
세계의 광산용 실험실 자동화 시장 동향 및 인사이트
호주에서 추진 중인 ‘채굴 현장부터 항구까지’를 아우르는 디지털 퍼스트 샘플링 이니셔티브
대형 광산 기업들은 현재 자율 주행 드릴, 자동 분쇄기, 로봇을 활용한 화석 분석 라인을 통합된 데이터 백본에 연결하여, 지질화학 분석 결과를 몇 분 이내에 계획 소프트웨어에 반영하고 있습니다. 리오 틴토(Rio Tinto)는 로봇화된 실험실 설비에 예측 유지보수를 도입한 결과, 연간 2억 달러의 비용 절감을 달성했다고 보고한 반면, BHP의 칠레 스펜스(Spence) 광산에서는 2024년에 안전 사고 제로 상태로 3개월간의 완전 자율 가동을 기록했습니다. 지속적인 데이터 흐름을 통해 수작업으로 인한 병목 현상이 해소되고, 오염 위험이 40% 감소했으며, 대규모 철광석 사업에서 광석 회수율이 3-5% 향상되었습니다.
칠레 구리 광산에서 현장 분석 결과 보고 의무화
품위 관리 분석에 대한 4시간이라는 규제상 제한으로 인해, 칠레의 광산에서는 90분 만에 결과를 얻을 수 있는 자동화된 시료 전처리와 휴대용 XRF 장치의 도입이 불가피하게 되었습니다. 코델코(Codelco)가 ABB와 체결한 25억 달러 규모의 계약에는 전기화 및 실험실 자동화가 포함되어 있으며, 이를 선행 도입한 기업들은 구리 회수율이 2-3포인트 향상되었고, 페루에서도 유사한 규제가 마련되고 있습니다.
중견 광산의 설비 투자 회수 기간은 3년 이상
중견 광산 사업자들은 실험실 자동화에 대한 투자를 평가할 때 중대한 재정적 제약에 직면하고 있습니다. 이는 회수 기간이 길어지면 자본 자원이 제한된 기업에게 있어 허용 가능한 위험 임계치를 초과하는 경우가 많기 때문입니다. SRK 컨설팅의 광산 운영 비용 분석에 따르면, 초기 투자액이 500만 달러를 초과하는 자동화 프로젝트는 회수 기간이 36개월을 넘을 경우, 일반적으로 이사회로부터 엄격한 심사를 받게 됩니다. 이 과제는 상품 가격의 변동성으로 인해 더욱 심각해지고 있습니다. 특히 금이나 비철금속 광산 사업의 경우, 가격 변동이 연간 20%를 넘기도 하여 장기적인 ROI(투자 수익률) 산출의 신뢰성이 떨어집니다. 테크 리소시스(Tech Resources)사의 케브라다 블랑카 II 프로젝트는 이러한 과제를 여실히 보여주는 사례입니다. 개발 비용이 당초 견적을 크게 웃도는 85억-90억 달러까지 불어났으며, 이는 대규모 자동화 이니셔티브에서 발생할 수 있는 비용 초과 위험을 여실히 드러내고 있습니다. 설비 금융 옵션이나 리스 계약이 잠재적인 해결책으로 대두되고 있지만, 기술의 노후화나 유지보수 책임에 대한 우려로 인해 그 도입은 여전히 제한적입니다.
부문별 분석
2025년, 광산용 실험실 자동화 시장에서 로봇 공학 분야가 33.60%라는 가장 큰 점유율을 차지했습니다. 이는 고온의 용광로와 발암성 분진으로부터 작업자를 보호해야 할 필요성에 기인한 것입니다. Scott Automation사의 턴키형 셀은 밀폐된 환경에서 파쇄, 분쇄, 계량, 화학적 분석에 의한 주조를 가능하게 하여 처리 능력과 재현성을 향상시키고 있습니다. LIMS(실험실 정보 관리 시스템)는 규모는 작지만 연평균 성장률(CAGR) 12.15%로 가장 빠르게 성장하고 있으며, 이는 경영진이 하드웨어의 처리 속도 향상보다 데이터의 무결성과 규제상 추적 가능성을 더 중요하게 여기기 때문입니다. 컨테이너형 실험실은 신속한 전개가 요구되는 탐사 활동에 대응하고 있으며, 40피트 모듈 1기라면 3주 이내에 가동을 시작할 수 있습니다. 자동 분석 장치는 AI를 활용한 보정을 채택하여 시약 사용량을 줄이면서 정확도를 높이고 있습니다.
각 기업은 전체 워크플로우의 안정성을 해치지 않으면서 분쇄, 분할, 용융과 같은 개별 작업을 대체하는 모듈식 아일랜드를 선호합니다. 2025년에는 이러한 시스템이 광산용 실험실 자동화 시장의 50.20%를 차지했습니다. 투자 회수 사례가 축적됨에 따라 실험실 자동화 시장 전체는 연간 14.51%의 속도로 성장하고 있으며, 특히 시료량이 극히 많은 철광석 및 구리의 주요 산지에서 이러한 경향이 두드러집니다. ABB가 애지런트와 제휴하여 로봇과 화학 분석을 통합한 ‘아일랜드’형 시스템을 제공한다는 점은 제조 공정 전체를 아우르는 솔루션을 제공하는 벤더 생태계로의 전환을 시사합니다.
지역별 분석
2025년, 아시아태평양은 전 세계 매출의 31.20%를 차지했으며, 호주의 자율형 철광석 공급망과 중국의 막대한 비철금속 생산 능력이 수요를 견인했습니다. 호주 광업 분야의 로봇 관련 지출은 2022년에 630억 달러에 달했으며, 2030년까지 2,180억 달러로 급증할 것으로 예측되고 있으며, 이러한 추세는 실험실 환경에서도 마찬가지로 나타납니다. 일본과 한국은 분석 정밀도를 높이는 정밀 센서와 AI 칩을 공급하고 있습니다.
중동 및 아프리카는 국부펀드를 원동력으로 14.86%라는 가장 높은 연평균 성장률(CAGR)을 기록하고 있습니다. 사우디아라비아의 광업 회사 마아덴이 헥사곤과 제휴하여 해당 지역 최초의 디지털 광산(예산 20억 달러)을 개설한 것은 인산염, 금, 구리 자산에 대한 실험실 자동화의 모범 사례가 되고 있습니다. 아프리카에서의 도입에 있어서는 취약한 인프라와 기술자 부족을 보완하기 위해 컨테이너형 실험실 및 원격 모니터링에 크게 의존하고 있습니다.
북미에서는 기존의 우라늄, 칼륨, 귀금속 분석 시설이 노후화됨에 따라 꾸준한 교체 수요가 나타나고 있습니다. 각 벤더사는 상호 운용성을 확보하기 위한 개조와 노동조합이 존재하는 노동 환경에 대한 대응을 요구받고 있습니다. 유럽의 상황은 제각각입니다. 북유럽의 철광석 생산자들은 다수의 위성 광산을 지원하는 ‘허브 앤 스포크(hub-and-spoke)’형 자동화 실험실을 선도적으로 도입하고 있지만, EU 전체적으로는 클라우드 기반 LIMS 모델 도입을 복잡하게 만드는 데이터 주권 관련 과제에 직면해 있습니다. 남미에서는 칠레의 분석 결과 보고 기간에 관한 법률과 페루의 리튬 붐이 호재로 작용하고 있습니다.
기타 혜택 :
- 엑셀 형식 시장 예측(ME) 시트
- 3개월간의 애널리스트 지원
자주 묻는 질문
목차
제1장 서론
제2장 조사 방법
제3장 주요 요약
제4장 시장 구도
제5장 시장 규모 및 성장 예측
제6장 경쟁 구도
제7장 시장 기회 및 향후 전망
KTH 26.09.14According to Mordor Intelligence, mining laboratory automation market size in 2026 is estimated at USD 7.95 billion, growing from 2025 value of USD 7.22 billion with 2031 projections showing USD 12.88 billion, growing at 10.13% CAGR over 2026-2031.
This report is Segmented by Product (Robotics, LIMS, Container Labs, and More), Automation Level (Total Lab, Modular), Mining Phase (Exploration, Production, Closure, and More), Commodity (Iron Ore, Copper, Gold, Battery Minerals), End User (Large Mining Enterprises, Mid-Tier and Junior Miners), and Geography. The Market Forecasts are Provided in Terms of Value (USD).
Global Mining Laboratory Automation Market Trends and Insights
Digital-first "Pit-to-Port" Sampling Initiatives in Australia
Mining majors now integrate autonomous drills, automated crushers, and robotic fire-assay lines into unified data backbones that push geochemical results into planning software within minutes. Rio Tinto reports annual savings of USD 200 million after deploying predictive maintenance on robotic lab assets, while BHP's Spence mine in Chile logged three months of full autonomy with zero safety incidents in 2024. Continuous data flow removes manual choke points, cuts contamination risk by 40%, and lifts ore recovery 3-5% in large iron-ore operations.
Mandatory On-site Assay Turn-around in Chilean Copper Mines
Four-hour regulatory limits for grade-control assays have forced Chilean sites to adopt automated sample preparation and portable XRF units capable of 90-minute results. Codelco's USD 2.5 billion agreement with ABB bundles electrification and laboratory automation, giving early movers 2-3-point boosts in copper recovery and shaping similar mandates in Peru.
CAPEX Pay-back > 3 Years for Mid-Tier Mines
Mid-tier mining operations face significant financial constraints when evaluating laboratory automation investments, as extended payback periods often exceed acceptable risk thresholds for companies with limited capital resources. SRK Consulting's analysis of mining operational costs reveals that automation projects requiring initial investments above USD 5 million typically face scrutiny from boards when payback periods extend beyond 36 months. The challenge is compounded by volatile commodity prices that make long-term ROI calculations unreliable, particularly for gold and base metal operations where price fluctuations can exceed 20% annually. Teck Resources' Quebrada Blanca II project exemplifies this challenge, with development costs escalating to USD 8.5-9 billion significantly above initial estimates, highlighting the risk of cost overruns in major automation initiatives. Equipment financing options and leasing arrangements are emerging as potential solutions, but adoption remains limited due to concerns about technology obsolescence and maintenance responsibilities.
Other drivers and restraints analyzed in the detailed report include:
- Rapid Grade-Control Needs in West African Gold Super-Pits
- AI-Enabled Predictive Maintenance for Robotic Sample Prep
- Limited Inter-operability Between Legacy Assay Hardware
For complete list of drivers and restraints, kindly check the Table Of Contents.
Segment Analysis
Robotics generated the largest 33.60% slice of the Mining Laboratory Automation market in 2025, underpinned by the need to shield personnel from high-temperature furnaces and carcinogenic dust. Scott Automation's turnkey cells now deliver crushing, milling, weighing, and fire-assay pouring in sealed environments, lifting throughput and repeatability. LIMS, while smaller, is the fastest climber at 12.15% CAGR, as executives value data integrity and regulatory traceability more than incremental hardware speed. Container labs meet exploration campaigns that require rapid mobilization; one 40-foot module can be on-line within three weeks. Automated analyzers adopt AI-assisted calibration, trimming reagent use and boosting precision.
Firms prefer modular islands that replace discrete tasks-crushing, splitting, or fusion-without destabilizing whole workflows. Such systems accounted for 50.20% of the Mining Laboratory Automation market share in 2025. As payback proof accumulates, total lab automation grows 14.51% per year, particularly in iron-ore and copper hubs where sample volumes are extreme. ABB's alliance with Agilent to provide integrated robotic-chemistry islands signals a shift toward vendor ecosystems that deliver cradle-to-gate solutions.
Complete Report Scope:
- By Product
- Robotics
- Laboratory Information Management Systems (LIMS)
- Container Laboratory
- Automated Analyzers and Sample Preparation Equipment
- By Automation Level
- Total Lab Automation (TLA)
- Modular / Island Automation
- By Mining Phase
- Exploration and Grade Control
- Mine Development and Planning
- Production and Beneficiation
- Closure and Environmental Monitoring
- By Commodity Processed
- Iron Ore
- Copper
- Gold
- Coal and Battery Minerals (Ni, Li, Co)
- By Geography
- North America
- United States
- Canada
- Mexico
- Europe
- United Kingdom
- Germany
- France
- Italy
- Rest of Europe
- Asia-Pacific
- China
- Japan
- India
- South Korea
- Rest of Asia-Pacific
- Middle East
- Israel
- Saudi Arabia
- United Arab Emirates
- Turkey
- Rest of Middle East
- Africa
- South Africa
- Egypt
- Rest of Africa
- South America
- Brazil
- Argentina
- Rest of South America
- North America
Geography Analysis
Asia-Pacific anchored 31.20% of global revenue in 2025, with Australia's autonomous iron-ore chain and China's vast base-metal capacity driving demand. Australian robotics spending in mining stood at USD 63 billion in 2022 and is projected to jump to USD 218 billion by 2030, a trend mirrored in laboratory settings. Japan and South Korea supply precision sensors and AI chips that sharpen assay accuracy.
Middle East & Africa records the quickest 14.86% CAGR, catalyzed by sovereign funds. Saudi miner Ma'aden's tie-up with Hexagon to open the region's first digital mine-budgeted at USD 2 billion-sets a template for lab automation across phosphate, gold, and copper assets. African deployments lean heavily on container labs and remote monitoring to sidestep weak infrastructure and scarce technicians.
North America shows steady replacement demand as legacy uranium, potash, and precious-metal labs age. Vendors must navigate inter-operability retrofits and unionized labor environments. Europe's picture is mixed: Nordic iron-ore producers pioneer hub-and-spoke automated labs that support numerous satellite mines, but the wider EU struggles with data-sovereignty hurdles that complicate cloud-based LIMS models. South America benefits from Chile's assay-turn-around law and Peru's lithium boom.
- FLSmidth A/S
- Bruker Corporation
- Thermo Fisher Scientific Inc.
- Intertek Group PLC
- SGS SA
- ALS Limited
- Bureau Veritas SA
- Rocklabs (SCOTT Technology)
- HERZOG Automation Corp.
- Malvern Panalytical Ltd.
- Nucomat
- PerkinElmer Inc.
- Agilent Technologies Inc.
- Metso Outotec Oyj
- CEM Corporation
- Element Materials Technology
- Online LIMS Canada Ltd.
- QMetrix Group
- Sentry Equipment Corp.
- CITIC Heavy Industries Robotic Lab Systems
Additional Benefits:
- The market estimate (ME) sheet in Excel format
- 3 months of analyst support
TABLE OF CONTENTS
1 INTRODUCTION
- 1.1 Study Assumptions and Market Definition
- 1.2 Scope of the Study
2 RESEARCH METHODOLOGY
3 EXECUTIVE SUMMARY
4 MARKET LANDSCAPE
- 4.1 Market Overview
- 4.2 Market Drivers
- 4.2.1 Digital-first "Pit-to-Port" Sampling Initiatives in Australia
- 4.2.2 Mandatory On-site Assay Turn-around in Chilean Copper Mines
- 4.2.3 Rapid Grade-Control Needs in West African Gold Super-Pits
- 4.2.4 Stricter Tailings-Dam Monitoring Rules in Brazil
- 4.2.5 Rise of Containerized "Hub-and-Spoke" Labs Across the Nordics
- 4.2.6 AI-Enabled Predictive Maintenance for Robotic Sample Prep
- 4.3 Market Restraints
- 4.3.1 CAPEX Pay-back to 3 Years for Mid-Tier Mines
- 4.3.2 Limited Inter-operability Between Legacy Assay Hardware
- 4.3.3 Scarcity of Robotics Technicians in Africa and Caribbeans
- 4.3.4 Data-sovereignty Barriers to Cloud-Hosted LIMS in EU
- 4.4 Value / Supply-Chain Analysis
- 4.5 Regulatory Outlook
- 4.6 Technological Outlook
- 4.7 Porter's Five Forces Analysis
- 4.7.1 Bargaining Power of Suppliers
- 4.7.2 Bargaining Power of Buyers
- 4.7.3 Threat of New Entrants
- 4.7.4 Threat of Substitutes
- 4.7.5 Competitive Rivalry
- 4.8 Key Applications
- 4.8.1 Laboratories
- 4.8.2 Mine-site In-Pit Labs
- 4.9 Major Use-Cases
- 4.9.1 Automated Shift-Based Blast-Hole QA/QC
- 4.9.2 Environmental Baseline and ESG Reporting
5 MARKET SIZE AND GROWTH FORECASTS (VALUE)
- 5.1 By Product
- 5.1.1 Robotics
- 5.1.2 Laboratory Information Management Systems (LIMS)
- 5.1.3 Container Laboratory
- 5.1.4 Automated Analyzers and Sample Preparation Equipment
- 5.2 By Automation Level
- 5.2.1 Total Lab Automation (TLA)
- 5.2.2 Modular / Island Automation
- 5.3 By Mining Phase
- 5.3.1 Exploration and Grade Control
- 5.3.2 Mine Development and Planning
- 5.3.3 Production and Beneficiation
- 5.3.4 Closure and Environmental Monitoring
- 5.4 By Commodity Processed
- 5.4.1 Iron Ore
- 5.4.2 Copper
- 5.4.3 Gold
- 5.4.4 Coal and Battery Minerals (Ni, Li, Co)
- 5.5 By Geography
- 5.5.1 North America
- 5.5.1.1 United States
- 5.5.1.2 Canada
- 5.5.1.3 Mexico
- 5.5.2 Europe
- 5.5.2.1 United Kingdom
- 5.5.2.2 Germany
- 5.5.2.3 France
- 5.5.2.4 Italy
- 5.5.2.5 Rest of Europe
- 5.5.3 Asia-Pacific
- 5.5.3.1 China
- 5.5.3.2 Japan
- 5.5.3.3 India
- 5.5.3.4 South Korea
- 5.5.3.5 Rest of Asia-Pacific
- 5.5.4 Middle East
- 5.5.4.1 Israel
- 5.5.4.2 Saudi Arabia
- 5.5.4.3 United Arab Emirates
- 5.5.4.4 Turkey
- 5.5.4.5 Rest of Middle East
- 5.5.5 Africa
- 5.5.5.1 South Africa
- 5.5.5.2 Egypt
- 5.5.5.3 Rest of Africa
- 5.5.6 South America
- 5.5.6.1 Brazil
- 5.5.6.2 Argentina
- 5.5.6.3 Rest of South America
- 5.5.1 North America
6 COMPETITIVE LANDSCAPE
- 6.1 Strategic Moves
- 6.2 Market Share Analysis
- 6.3 Company Profiles (includes Global Level Overview, Market Level Overview, Core Segments, Financials as available, Strategic Information, Market Rank/Share for key companies, Products and Services, and Recent Developments)
- 6.3.1 FLSmidth A/S
- 6.3.2 Bruker Corporation
- 6.3.3 Thermo Fisher Scientific Inc.
- 6.3.4 Intertek Group PLC
- 6.3.5 SGS SA
- 6.3.6 ALS Limited
- 6.3.7 Bureau Veritas SA
- 6.3.8 Rocklabs (SCOTT Technology)
- 6.3.9 HERZOG Automation Corp.
- 6.3.10 Malvern Panalytical Ltd.
- 6.3.11 Nucomat
- 6.3.12 PerkinElmer Inc.
- 6.3.13 Agilent Technologies Inc.
- 6.3.14 Metso Outotec Oyj
- 6.3.15 CEM Corporation
- 6.3.16 Element Materials Technology
- 6.3.17 Online LIMS Canada Ltd.
- 6.3.18 QMetrix Group
- 6.3.19 Sentry Equipment Corp.
- 6.3.20 CITIC Heavy Industries Robotic Lab Systems
7 MARKET OPPORTUNITIES AND FUTURE OUTLOOK
- 7.1 White-space and Unmet-Need Assessment


