

|
시장보고서
상품코드
2124486
파이버 브래그 그레이팅 센서 : 시장 점유율 분석, 업계 동향 및 통계, 성장 예측(2026-2031년)Fiber Bragg Grating Sensor - Market Share Analysis, Industry Trends & Statistics, Growth Forecasts (2026 - 2031) |
||||||
 Mordor Intelligence
Mordor Intelligence에 의하면, 파이버 브래그 그레이팅 센서 시장 규모는 2025년 8억 3,000만 달러로 평가되었습니다. 2026년 9억 1,000만 달러에서 2031년까지 13억 4,000만 달러로 확대되고 2026년부터 2031년까지 연평균 복합 성장률(CAGR)은 8.12%를 나타낼 전망입니다.
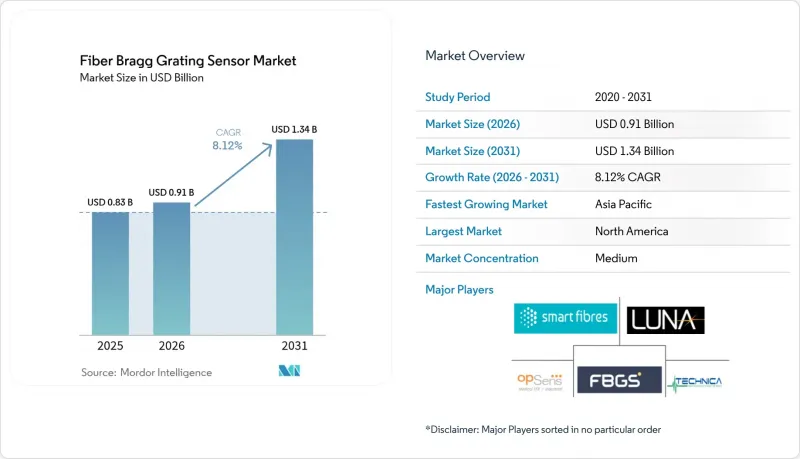
본 보고서는 유형별(온도 센서, 변형 센서 등), 그레이팅 파장 범위별(C-band, L-band 등), 최종 사용자 산업별(통신, 항공우주 및 방위 등), 용도별(구조 건전성 모니터링, 온도 모니터링, 진동·음향 모니터링 등), 지역별로 분류되어 있습니다. 시장 전망은 금액(달러) 기준으로 제시되어 있습니다.
세계의 파이버 브래그 그레이팅 센서 시장 동향 및 인사이트
실시간 구조 건전성 모니터링에 대한 수요 증가
교량 및 터널 소유주는 이식형 FBG를 개조하여 변형 및 온도를 지속적으로 측정하고 있습니다. 이를 통해 수작업 점검을 대체하고 24시간 데이터 스트림을 활용함으로써 자산의 수명을 최대 20년까지 연장하고 있습니다. 풍력 발전소 운영자는 터빈 블레이드 내부에 어레이를 설치하여 수백만 회의 피로 사이클을 거친 후 발생하는 미세 균열을 감지하고, 분석 결과 위험이 지적된 경우에만 블레이드 교체를 계획하고 있습니다. 핵융합 에너지 연구소나 항공우주 시험대에서는 자기장이나 극저온의 영향을 받지 않는 기술이 채택되고 있으며, 이를 통해 높은 신뢰성을 요구하는 사용자층의 신뢰도가 더욱 높아지고 있습니다. 클라우드 대시보드와 머신러닝을 통한 이상 감지를 통해 센서 데이터가 유지보수 작업 지시서로 변환되며, 수익원이 소프트웨어 구독 모델로 전환되고 있습니다. 이러한 동향들이 맞물려 파이버 브래그 그레이팅 센서 시장에는 향후 수년간 안정적인 수요가 예상됩니다.
5G 광섬유 백홀 인프라의 확대
이동통신 사업자들은 중국, 인도, 한국, 유럽, 북미에 걸쳐 300만 곳 이상의 5G 기지국을 연결하기 위해 고밀도 광섬유 네트워크를 구축하고 있습니다. 분배 노드에 연결된 아포다이즈드 그레이팅은 지연 목표치를 위협하는 굴곡, 급격한 온도 상승, 미세한 진동을 감지하여, 서비스 품질이 저하되기 전에 현장 작업자가 회선을 복구할 수 있도록 합니다. 통신 사업자들은 80km가 넘는 지방의 백홀 구간에서 L-밴드 그레이팅을 점점 더 선호하고 있습니다. 이는 감쇠가 낮아 증폭기 대수와 설비 투자 비용을 절감할 수 있기 때문입니다. 이미 설치된 통신용 광섬유를 데이터 통신과 센싱 모두에 재사용하는 시범 프로젝트를 통해 1km당 도입 비용이 거의 절반으로 줄어들면서, 철도 및 전력 회사에서의 도입이 가속화되고 있습니다. 따라서 통신 분야의 확산이 파이버 브래그 그레이팅 센서 시장의 단기적인 수익 기반이 되고 있습니다.
온도 및 변형에 대한 교차 감도
1°C의 온도 변화에 따라 파장이 약 10 마이크로 변형만큼 이동하기 때문에 설치 업체는 각 능동 그레이팅에 변형 영향을 차단한 기준 장치를 결합해야 합니다. 듀얼 채널 구성에서는 센서 수와 인터로게이터의 복잡성이 최대 40% 증가하지만, 많은 산업용 소유주들은 이러한 추가 비용을 꺼리고 있습니다. 소프트웨어 모델을 사용하여 이 문제를 해결하려고 할 경우, 신규 사용자가 거의 보유하지 않는 이력 데이터가 필요하기 때문에 도입이 지연됩니다. 주요 공급업체의 보정용 하드웨어를 사용하면 오차는 ±2 마이크로 변형까지 축소되지만, 크로스 토크는 여전히 설계상의 장벽으로 남아 있어 파이버 브래그 그레이팅 센서 시장의 성장 속도를 둔화시키고 있습니다.
부문별 분석
2025년 매출을 살펴보면, 변형 측정 장치가 파이버 브래그 그레이팅 센서 시장 규모의 42.21%를 차지했으며, 이는 지속적인 하중 추적이 요구되는 교량, 풍력 터빈, 항공기 구조물에서 해당 장치가 수행하는 역할을 반영한 것입니다. 인프라 소유자가 수명을 연장하기 위해 내장형 모니터링을 의무화하고 있기 때문에 판매량은 안정적입니다. 한편, 음향 방식은 2031년까지 연평균 성장률(CAGR) 9.14%를 나타낼 것으로 예측되며, 파이프라인 및 주변 보안 분야의 구매자들이 광섬유를 킬로미터 규모의 마이크로폰 그리드로 전환하는 분산형 음향 감지 기술을 채택함에 따라 다른 모든 카테고리를 능가하는 성장이 전망됩니다.
듀얼 FBG를 이용한 온도 보정 변형 설계는 정확도를 ±2 마이크로 변형까지 향상시켜, 교정을 위한 가동 중단을 허용할 수 없는 원자력, 항공우주, HVDC 프로젝트의 요구 사항을 충족합니다. 한편, 음향 인터로게이터는 현재 1 MS/s를 초과하는 샘플링 속도를 실현하여, 광산에서 발생하는 미세 지진의 전조나 복합재료에서 발생하는 고주파 균열 소리를 포착하고 있습니다. 이러한 기술적 도약으로 인해 오랫동안 틈새 시장으로만 여겨졌던 분야가 대규모 출하로 전환되었으며, 예측 기간이 끝날 때까지 음향 장치용 파이버 브래그 그레이팅 센서 시장 점유율이 확대될 것입니다.
C-밴드 센서는 통신 백본의 레거시 에르븀 도핑 증폭기와의 호환성 덕분에 2025년 매출의 39.13%를 차지했습니다. 기존 장비를 통해 조달 장벽이 낮아지기 때문에 해당 광학 부품을 이미 보유하고 있는 통신 사업자에게 C-밴드는 여전히 주된 선택지로 남아 있습니다. 반면, L-밴드 모델은 더 긴 전송 거리와 높은 다중화 밀도를 보장하며, C-밴드가 약 절반 수준의 수치만 지원할 수 있는 반면, 단일 광섬유 상에서 600개 이상의 그레이팅을 구현합니다. 그 결과, 2031년까지 L-밴드 시장의 연평균 성장률(CAGR)은 8.89%를 나타낼 것으로 전망됩니다.
새로운 파이프라인, 철도, HVDC(고전압 직류 송전) 프로젝트에서는 현재 C-밴드와 L-밴드를 모두 판독할 수 있는 하이브리드형 인터로게이터가 사양으로 채택되고 있어, 미래를 내다본 투자가 가능해지는 한편, 전환도 용이해집니다. 유닛 출하 대수가 증가함에 따라 부품 가격은 하락하고, 중견 공급업체에게 새로운 기회가 생겨나며, 파이버 브래그 그레이팅 센서 시장 전체의 잠재 수요가 확대되고 있습니다.
지역별 분석
북미는 방위용 항공기, 셰일 파이프라인, 노후화된 고속도로 교량에 상태 모니터링을 위해 그레이팅이 통합됨에 따라 2025년 매출의 34.79%를 차지했습니다. 연방 정부의 인프라 보조금을 통해 구조 보강 공사에 자금이 지원되었으며, 미국 공군은 복합재 전투기 전체 기체에 센서 통합을 추진했습니다. 캐나다의 연구 자금은 국내 인터로게이터 역량을 향상시켰으며, 한편 멕시코의 해양 플랫폼에서는 고전압 장비로 인한 전자기 간섭을 피하기 위해 광학 어레이가 채택되었습니다.
아시아태평양은 2031년까지 9.07%라는 가장 높은 연평균 성장률(CAGR)을 보일 것으로 전망됩니다. 중국에서는 수년에 걸친 5G 구축에 따라 모든 신규 기지국에 인라인 광섬유 모니터링 시스템이 도입되고 있습니다. 인도의 지하철 프로젝트에서는 변형을 지속적으로 감지하기 위해 격자형 센서가 터널 내부에 배선되어 있으며, 일본에서는 2025년 11월에 시작된 철도 시범 사업에서 진동 모니터링를 위해 기존 통신용 광섬유를 재사용함으로써 비용 절감을 도모하고 있습니다. 기술자 부족이 여전히 유일한 병목 현상으로 남아 있어, 각 벤더들은 설치 서비스와 원격 진단 지원을 세트로 제공하게 되었습니다.
유럽에서는 성숙한 교량 감시 사업과 미래를 내다본 수소·해상 풍력 발전에 대한 투자의 균형이 잡혀 있습니다. 독일과 네덜란드에서는 전유전체식 누설 감지를 규정한 1,200km의 수소 회랑이 설치되어 있으며,북해 풍력 발전 허브에서는 수명 주기 전반에 걸친 열 관리를 위해 격자 구조가 내장된 수천 킬로미터에 달하는 고전압 직류(HVDC) 케이블이 필요할 전망입니다. 중동 및 아프리카의 성장은 석유 및 가스 분야에 집중되어 있으며, 알제리가 1만 4,000 km에 달하는 음향 파이프라인을 구축한 사례가 두드러집니다. 한편, 남미는 뒤처져 있지만, 브라질의 해상 유전이나 아르헨티나의 셰일층 개발에서 국지적인 도입이 진행되고 있습니다.
기타 혜택 :
- 엑셀 형식 시장 예측(ME) 시트
- 3개월간의 애널리스트 지원
자주 묻는 질문
목차
제1장 서론
제2장 조사 방법
제3장 주요 요약
제4장 시장 구도
제5장 시장 규모 및 성장 예측
제6장 경쟁 구도
제7장 시장 기회 및 향후 전망
KTH 26.09.14According to Mordor Intelligence, the fiber bragg grating sensor market size is projected to expand from USD 0.83 billion in 2025 and USD 0.91 billion in 2026 to USD 1.34 billion by 2031, registering a CAGR of 8.12% between 2026 to 2031.
This report is Segmented by Type (Temperature Sensor, Strain Sensor, and More), Grating Wavelength Range (C-Band, L-Band, and More), End-User Industry (Telecommunication, Aerospace and Defense, and More), Application (Structural Health Monitoring, Temperature Monitoring, Vibration and Acoustic Monitoring, and More), and Geography. The Market Forecasts are Provided in Terms of Value (USD).
Global Fiber Bragg Grating Sensor Market Trends and Insights
Growing Demand for Real-Time Structural Health Monitoring
Bridge and tunnel owners retrofit embedded fiber Bragg gratings to continuously measure strain and temperature, replacing manual inspections with 24-hour data streams that extend asset life by up to 20 years. Wind farm operators add arrays inside turbine blades, capturing micro-crack initiation after millions of fatigue cycles and scheduling blade swaps only when analytics flag risk. Fusion-energy laboratories and aerospace test stands select technologies that are immune to magnetic fields and cryogenic temperatures, thereby broadening credibility among high-reliability users. Cloud dashboards and machine-learning anomaly detection convert sensor data into maintenance work orders, shifting revenue toward software subscriptions. Collectively, these dynamics secure a multi-year volume pipeline for the fiber Bragg grating sensor market.
Expansion of 5G Fiber Backhaul Infrastructure
Mobile operators string dense fiber networks to connect more than three million 5G base stations across China, India, South Korea, Europe, and North America. Apodized gratings spliced at distribution nodes detect bending, temperature spikes, and micro-vibrations that jeopardize latency targets, enabling field crews to repair lines before service degradation. Operators increasingly favor L-band gratings for rural backhaul stretches exceeding 80 km, where lower attenuation cuts amplifier count and capital cost. Pilot projects that reuse installed communications fiber for both data and sensing reduce per-kilometer deployment expense by nearly half, accelerating adoption among railways and power utilities . The telecom footprint therefore anchors near-term revenue for the fiber Bragg grating sensor market.
Cross-Sensitivity to Temperature and Strain
A 1 °C thermal change produces a wavelength shift equal to roughly 10 microstrain, forcing installers to pair each active grating with a strain-isolated reference device. Dual-channel configurations raise sensor counts and interrogator complexity by up to 40%, a premium many industrial owners resist. Attempts to solve the issue using software models require historical data that new users rarely have, delaying deployment. Although compensation hardware from leading vendors narrows errors to +-2 microstrain, cross-talk remains a design hurdle that tempers the expansion rate of the fiber Bragg grating sensor market.
Other drivers and restraints analyzed in the detailed report include:
- Rapid Deployment of Distributed Acoustic Sensing in Oil and Gas Pipelines
- Increasing Use in High-Voltage Direct Current Cables
- High Upfront Installation Cost versus Electrical Gauges
For complete list of drivers and restraints, kindly check the Table Of Contents.
Segment Analysis
2025 sales show strain devices controlling 42.21% of the fiber Bragg grating sensor market size, reflecting their role in bridges, wind turbines, and aircraft structures that demand continuous load tracking. Volume remains steady as infrastructure owners mandate embedded monitoring to stretch service life. Acoustic formats, however, will chart a 9.14% CAGR to 2031, outpacing every other category as pipeline and perimeter-security buyers adopt distributed acoustic sensing that turns fiber into a kilometer-scale microphone grid.
Dual-FBG temperature-compensated strain designs push accuracy toward +-2 microstrain, satisfying nuclear, aerospace, and HVDC projects that cannot accommodate calibration shut-downs. Meanwhile, acoustic interrogators now sample at rates beyond 1 MS/s, capturing microseismic precursors in mines and high-frequency crack emissions in composites. This technical leap converts long-tail niche opportunities into scale shipments, lifting the fiber Bragg grating sensor market share of acoustic devices by the end of the forecast window.
C-band sensors accounted for 39.13% of 2025 revenue thanks to compatibility with legacy erbium-doped amplifiers in telecom backbones. Installed gear lowers procurement friction, keeping C-band a staple for operators that already own matching optics. L-band models, however, promise longer reach and greater multiplex density, enabling 600-plus gratings on a single fiber where C-band supports roughly half that figure. The result is an 8.89% CAGR for the L-band slice through 2031.
Greenfield pipeline, railway, and HVDC projects now specify hybrid interrogators capable of reading both C- and L-band, future-proofing investments while easing migration. As unit volumes rise, component prices drop, opening opportunities for mid-tier suppliers and expanding total addressable demand across the fiber Bragg grating sensor market.
Complete Report Scope:
- By Type
- Temperature Sensor
- Strain Sensor
- Pressure Sensor
- Acoustic Sensor
- Other Types
- By Grating Wavelength Range
- C-Band (1530 to 1565 nm)
- L-Band (1565 to1625 nm)
- O-Band (1260 to 1360 nm)
- Other Grating Wavelength Ranges
- By End-User Industry
- Telecommunication
- Aerospace and Defense
- Construction and Infrastructure
- Energy and Power
- Oil and Gas
- Mining
- Other End-User Industries
- By Application
- Structural Health Monitoring
- Temperature Monitoring
- Vibration and Acoustic Monitoring
- Pressure Monitoring
- Load and Weight Monitoring
- Other Applications
- By Geography
- North America
- United States
- Canada
- Mexico
- Europe
- Germany
- United Kingdom
- France
- Russia
- Rest of Europe
- Asia-Pacific
- China
- Japan
- India
- South Korea
- Australia
- Rest of Asia-Pacific
- Middle East
- Saudi Arabia
- United Arab Emirates
- Rest of Middle East
- Africa
- South Africa
- Egypt
- Rest of Africa
- South America
- Brazil
- Argentina
- Rest of South America
- North America
Geography Analysis
North America contributed 34.79% of 2025 sales as defense aircraft, shale pipelines, and aging highway bridges embedded gratings for condition-based oversight. Federal infrastructure grants financed structural retrofits, and the United States Air Force advanced full-fleet sensor integration on composite fighters. Canada's research funding boosted domestic interrogator capability, while Mexican offshore platforms adopted optical arrays to avoid electromagnetic interference from high-voltage equipment.
Asia-Pacific will record the swiftest 9.07% CAGR to 2031. China's multiyear 5G rollout attaches inline fiber monitoring to every new base station, India's metro rail projects hard-wire gratings into tunnels for continuous deformation alerts, and Japan's November 2025 railway pilot showcases cost-saving reuse of existing telecom fiber for vibration surveillance. Technician shortages remain the lone bottleneck, prompting vendors to bundle installation services and remote diagnostic support.
Europe balances mature bridge-monitoring portfolios with forward-looking hydrogen and offshore wind investments. Germany and the Netherlands are laying 1,200 km of hydrogen corridors that specify all-dielectric leak detection, and the North Sea Wind Power Hub will demand thousands of kilometers of HVDC cable carrying embedded gratings for lifetime thermal management. Middle East and African growth clusters around oil and gas, highlighted by Algeria's 14,000 km acoustic pipeline rollout, while South America trails but shows pockets of uptake in Brazilian offshore fields and Argentine shale plays.
- FBGS International NV
- Smart Fibres Ltd
- Luna Innovations Inc. (Micron Optics)
- Technica Optical Components LLC
- Opsens Inc
- Timbercon Inc
- National Instruments Corporation
- Hottinger Bruel & Kjaer HBM Inc
- Broptics Technology Inc
- ITF Technologies Inc
- Advanced Optics Solutions GmbH
- TeraXion Inc
- FISO Technologies Inc
- Optromix Inc
- Shenzhen Fibersail Technology Co Ltd
- Neoptix Inc
- Lightwave Logic Inc
- Smart Sensing Solutions GmbH
- Blue Road Research
- Cinogy Technologies GmbH
Additional Benefits:
- The market estimate (ME) sheet in Excel format
- 3 months of analyst support
TABLE OF CONTENTS
1 INTRODUCTION
- 1.1 Study Assumptions and Market Definition
- 1.2 Scope of the Study
2 RESEARCH METHODOLOGY
3 EXECUTIVE SUMMARY
4 MARKET LANDSCAPE
- 4.1 Market Overview
- 4.2 Market Drivers
- 4.2.1 Growing Demand for Real-Time Structural Health Monitoring
- 4.2.2 Expansion of 5G Fiber Backhaul Infrastructure
- 4.2.3 Rapid Deployment of Distributed Acoustic Sensing in Oil and Gas Pipelines
- 4.2.4 Increasing Use in High-Voltage Direct Current (HVDC) Cables
- 4.2.5 Adoption in Hydrogen Pipeline Networks
- 4.2.6 Defense Focus on Condition-Based Aircraft Maintenance
- 4.3 Market Restraints
- 4.3.1 Cross-Sensitivity to Temperature and Strain
- 4.3.2 High Upfront Installation Cost versus Electrical Gauges
- 4.3.3 Limited Dynamic Range in Ultra-Fast Events
- 4.3.4 Scarcity of Skilled Fiber-Optic Technicians
- 4.4 Industry Value Chain Analysis
- 4.5 Regulatory Landscape
- 4.6 Technological Outlook
- 4.7 Impact of Macroeconomic Factors
- 4.8 Porter's Five Forces Analysis
- 4.8.1 Threat of New Entrants
- 4.8.2 Bargaining Power of Buyers
- 4.8.3 Bargaining Power of Suppliers
- 4.8.4 Threat of Substitute Products
- 4.8.5 Intensity of Competitive Rivalry
5 MARKET SIZE AND GROWTH FORECASTS (VALUE)
- 5.1 By Type
- 5.1.1 Temperature Sensor
- 5.1.2 Strain Sensor
- 5.1.3 Pressure Sensor
- 5.1.4 Acoustic Sensor
- 5.1.5 Other Types
- 5.2 By Grating Wavelength Range
- 5.2.1 C-Band (1530 to 1565 nm)
- 5.2.2 L-Band (1565 to1625 nm)
- 5.2.3 O-Band (1260 to 1360 nm)
- 5.2.4 Other Grating Wavelength Ranges
- 5.3 By End-User Industry
- 5.3.1 Telecommunication
- 5.3.2 Aerospace and Defense
- 5.3.3 Construction and Infrastructure
- 5.3.4 Energy and Power
- 5.3.5 Oil and Gas
- 5.3.6 Mining
- 5.3.7 Other End-User Industries
- 5.4 By Application
- 5.4.1 Structural Health Monitoring
- 5.4.2 Temperature Monitoring
- 5.4.3 Vibration and Acoustic Monitoring
- 5.4.4 Pressure Monitoring
- 5.4.5 Load and Weight Monitoring
- 5.4.6 Other Applications
- 5.5 By Geography
- 5.5.1 North America
- 5.5.1.1 United States
- 5.5.1.2 Canada
- 5.5.1.3 Mexico
- 5.5.2 Europe
- 5.5.2.1 Germany
- 5.5.2.2 United Kingdom
- 5.5.2.3 France
- 5.5.2.4 Russia
- 5.5.2.5 Rest of Europe
- 5.5.3 Asia-Pacific
- 5.5.3.1 China
- 5.5.3.2 Japan
- 5.5.3.3 India
- 5.5.3.4 South Korea
- 5.5.3.5 Australia
- 5.5.3.6 Rest of Asia-Pacific
- 5.5.4 Middle East
- 5.5.4.1 Saudi Arabia
- 5.5.4.2 United Arab Emirates
- 5.5.4.3 Rest of Middle East
- 5.5.5 Africa
- 5.5.5.1 South Africa
- 5.5.5.2 Egypt
- 5.5.5.3 Rest of Africa
- 5.5.6 South America
- 5.5.6.1 Brazil
- 5.5.6.2 Argentina
- 5.5.6.3 Rest of South America
- 5.5.1 North America
6 COMPETITIVE LANDSCAPE
- 6.1 Market Concentration
- 6.2 Strategic Moves
- 6.3 Market Share Analysis
- 6.4 Company Profiles (includes Global level Overview, Market level overview, Core Segments, Financials as available, Strategic Information, Market Rank/Share for key companies, Products and Services, and Recent Developments)
- 6.4.1 FBGS International NV
- 6.4.2 Smart Fibres Ltd
- 6.4.3 Luna Innovations Inc. (Micron Optics)
- 6.4.4 Technica Optical Components LLC
- 6.4.5 Opsens Inc
- 6.4.6 Timbercon Inc
- 6.4.7 National Instruments Corporation
- 6.4.8 Hottinger Bruel & Kjaer HBM Inc
- 6.4.9 Broptics Technology Inc
- 6.4.10 ITF Technologies Inc
- 6.4.11 Advanced Optics Solutions GmbH
- 6.4.12 TeraXion Inc
- 6.4.13 FISO Technologies Inc
- 6.4.14 Optromix Inc
- 6.4.15 Shenzhen Fibersail Technology Co Ltd
- 6.4.16 Neoptix Inc
- 6.4.17 Lightwave Logic Inc
- 6.4.18 Smart Sensing Solutions GmbH
- 6.4.19 Blue Road Research
- 6.4.20 Cinogy Technologies GmbH
7 MARKET OPPORTUNITIES AND FUTURE OUTLOOK
- 7.1 White-Space and Unmet-Need Assessment


