

|
시장보고서
상품코드
2124497
동적 애플리케이션 보안 테스트 : 시장 점유율 분석, 업계 동향 및 통계, 성장 예측(2026-2031년)Dynamic Application Security Testing - Market Share Analysis, Industry Trends & Statistics, Growth Forecasts (2026 - 2031) |
||||||
 Mordor Intelligence
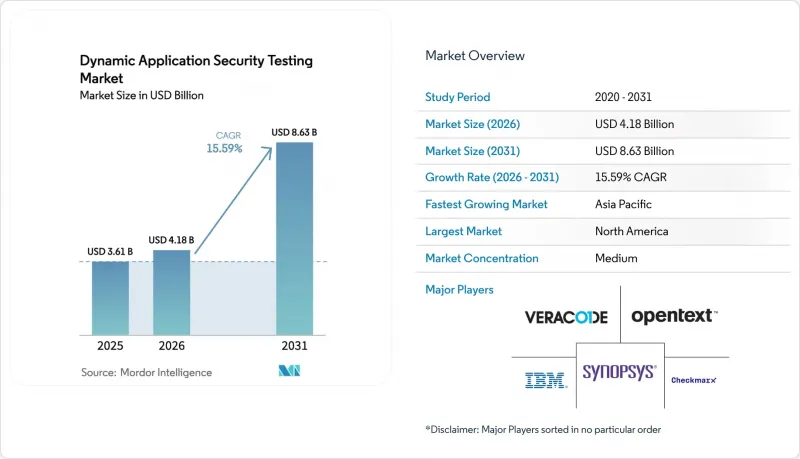
동적 애플리케이션 보안 테스트 시장 규모는 2025년에 36억 1,000만 달러로 평가되었습니다. 2026년에 41억 8,000만 달러에 달하고, 2031년까지 86억 3,000만 달러에 이를 것으로 예측되며, 2026년부터 2031년에 걸쳐 CAGR 15.59%로 성장할 전망입니다.
본 보고서는 구성 요소(솔루션 및 서비스), 도입 형태(클라우드 기반 및 On-Premise형), 조직 규모(대기업 및 중소기업), 최종 사용자 업종(은행, 금융서비스 및 보험(BFSI), 헬스케어, IT 및 통신, 산업·방위, 소매 및 전자상거래, 에너지·유틸리티 등), 지역별로 분류되어 있습니다. 시장 예측은 금액(달러) 기준으로 제시되어 있습니다.
세계의 동적 애플리케이션 보안 테스트 시장 동향 및 인사이트
API를 표적으로 한 공격 증가
2024년에는 API 엔드포인트가 전체 웹 용도 공격의 48%를 차지했으며, 이는 Akamai가 전 세계 네트워크에서 추적한 1,500억 건의 이벤트에 해당합니다. Wallarm은 2025년 3분기에 1,602건의 고유한 API 취약점을 기록했는데, 이는 전 분기 대비 20% 증가한 수치이며, 그 대부분은 객체 수준의 인증 미비나 과도한 데이터 노출 결함 때문이었습니다. 마이크로서비스로의 전환으로 인해 현대의 상거래 용도에서는 200-500개의 API가 공개되게 되어, 실행 시의 공격 표면이 확대되고 있습니다. 이 영역을 효과적으로 조사할 수 있는 것은 동적 애플리케이션 보안 테스트 시장뿐입니다. Traceable AI의 보고서에 따르면, 전년도에 57%의 조직이 API 침해 피해를 입었음에도 불구하고, API 전용 방어책을 도입한 조직은 불과 34%에 그쳤습니다. PSD2 및 오픈 뱅킹 규제로 인해 제3자 접근이 의무화되고, 그 인증의 무결성을 검증해야 할 필요성이 대두되면서 규제상의 압박도 이러한 시급성을 더욱 높이고 있습니다.
시프트 레프트(Shift Left)형 DevSecOps 도입
GitLab의 2024년 조사에 따르면, 개발자의 58%가 이미 개발 파이프라인 단계에서 동적 테스트를 수행하고 있으며, 이는 2년 전 41%에서 증가한 수치입니다. 이러한 진전에도 불구하고, 전용 API 스캔을 포함하고 있는 경우는 3분의 1에 그치고 있습니다. 그 주된 이유는 인증 정보와 임시 테스트 환경이 자동화를 복잡하게 만들기 때문입니다. Datadog의 조사에 따르면, 운영 중인 서비스의 15%에서 CISA의 ‘알려진 악용 목록’에 등재된 취약점이 여전히 존재하는 것으로 밝혀져, 조기 감지의 필요성이 다시 한번 부각되고 있습니다. 변경된 엔드포인트를 5분 간격으로 테스트하는 증분형 스캐너는 현재 10분 미만의 빌드 목표와 일치하게 되어, 보다 광범위한 도입이 촉진되고 있습니다.
신호 대 잡음(오감지)으로 인한 피로
보안 팀은 시스템에서 생성되는 방대한 양의 경보를 관리해야 하는 큰 과제에 직면해 있으며, 이러한 경보의 70-90%는 오감지입니다. 이처럼 높은 비율의 무관한 경보로 인해 팀은 진정으로 주의가 필요한 중요한 10-30%를 식별하기 위해서만 수천 건의 알림에 우선순위를 매기는 데 막대한 시간과 자원을 소비할 수밖에 없습니다. 시간이 지남에 따라 개발자들은 끊임없는 잡음 때문에 경보를 무시하는 경향이 생기며, 이는 결국 중요한 보안 목표 달성을 방해하게 됩니다. 이 문제를 해결하기 위해 Invicti와 같은 벤더가 제공하는 측정 기능을 갖춘 증거 기반 스캔 솔루션은 관련 없는 감지 결과를 최대 60%까지 줄이는 데 효과적임이 입증되었습니다. 이러한 개선을 통해 효율성이 향상될 뿐만 아니라, 보안 팀은 실질적인 인사이트에 집중할 수 있게 됩니다. 그 결과, 구매자들은 정확성을 중요한 요구 사항으로 점점 더 중시하게 되었으며, 제안 요청서(RFP)에 필수 기능으로 명시하는 경우가 늘고 있습니다.
부문별 분석
이 솔루션은 2025년 매출의 68.30%를 차지했으며, 기업들이 여전히 광범위한 자산 인벤토리를 포괄하기 위해 모든 기능을 갖춘 플랫폼 라이선스를 취득하고 있음을 보여줍니다. 그러나 서비스 부문의 점유율은 연평균 성장률(CAGR) 15.62%로 확대되고 있으며, 이는 동적 애플리케이션 보안 테스트 시장 전체의 성장률을 상회하는 수치입니다. 각 공급업체는 스캐너를 CI/CD 시스템과 통합하고, 인증 흐름을 최적화하며, 각 사업 부문을 위해 감지 결과를 해석하고 있습니다. 액센츄어를 비롯한 세계 컨설팅 기업들은 이러한 수요에 부응하기 위해 2025년까지 애플리케이션 보안 부문 인력을 확충했습니다.
또한, 이 서비스는 오탐으로 어려움을 겪는 조직에게도 매력적입니다. 관리 팀이 에스컬레이션 전에 악용 가능성을 검증함으로써 경보 누적을 줄일 수 있습니다. 그 결과, 서비스와 관련된 동적 애플리케이션 보안 테스트 시장 규모는 2031년까지 꾸준히 확대될 것으로 예측됩니다. 벤더들은 이에 대응하여 도입 지원, 맞춤형 정책 수립, 정기적인 상태 점검을 구독 플랜에 포함시킴으로써 경제적 인센티브와 고객의 성과를 일치시키고 있습니다.
2025년에는 클라우드 호스팅형 스캐너에 대한 지출이 73.50%를 차지했으며, On-Premise형 솔루션을 능가하는 성장을 이어가며 연평균 성장률(CAGR) 15.76%로 확대되고 있습니다. 클라우드 엔진은 하루에 수십 번 재배포되는 컨테이너화된 마이크로서비스나 서버리스 함수를 거의 실시간으로 감지 및 테스트하는 기능을 갖추고 있습니다. 이러한 빈번한 재배포를 효율적으로 처리할 수 있는 능력야말로 클라우드 호스팅형 솔루션의 채택을 촉진하는 중요한 요인이 되고 있습니다. Amazon Inspector가 Lambda 및 컨테이너 워크로드를 지원하게 된 것은 운영상의 오버헤드를 줄이고 확장성을 향상시키는 이러한 솔루션에 대해 구매자들이 풀 매니지드형 서비스를 점점 더 선호하는 경향을 더욱 부각시키고 있습니다.
규제가 엄격한 산업에서는 외부 처리를 제한하는 데이터 주권 정책으로 인해 On-Premise 배포가 여전히 중요한 요건으로 남아 있습니다. 이러한 정책은 기밀 데이터가 관리된 환경 내에 머무르도록 보장하기 때문에 규정 준수 측면에서 On-Premise 솔루션은 필수적입니다. 그 결과, 하이브리드 아키텍처가 실용적인 해결책으로 부상하고 있습니다. 즉, 스캔 엔진은 벤더의 클라우드에서 작동하지만, 인증 정보 및 기타 기밀 데이터는 고객의 하드웨어에 안전하게 보관됩니다. 이러한 구성을 통해 보안 조치의 범위를 훼손하지 않으면서도 규정 준수 요건을 충족할 수 있습니다. 이러한 혼합 모델은 역동적인 애플리케이션 보안 테스트 시장에서 요구되는 적응성과 유연성을 돋보이게 하며, 혁신을 추구하는 클라우드 중심의 개발자와 규제 준수 및 데이터 보안을 우선시하는 위험 회피형 기존 기업 모두의 요구를 충족시킬 수 있게 합니다.
지역별 분석
북미는 대통령령 14028호에 따라 연방 정부 계약업체가 실행 시 취약점 검증을 입증해야 할 의무가 있기 때문에 2025년 매출의 42.80%를 차지하며 1위를 차지했습니다. 도입 보급률이 가장 높은 지역인 북미에서는 팀이 극심한 경보 피로에 직면하고 있어, 이는 증거 기반 스캔 및 AI를 활용한 트라이아지에 대한 수요를 촉진하고 있습니다. 2024년에 제정된 캐나다의 ‘중요 사이버 시스템 보호법’은 주 정부가 규제하는 공공 서비스에 대한 의무적 테스트 대상을 확대하여 추가적인 수요를 창출했습니다.
유럽은 NIS2, DORA 및 ‘사이버 복원력 법’의 단계적 도입에 힘입어 2025년 지출의 약 29%를 차지했습니다. 독일과 프랑스의 금융 기관들은 24시간 이내의 사고 보고 기한을 준수하기 위해 모든 제3자 API에 대한 스캔을 확대되고 있습니다. 브렉시트 이후의 규제 차이로 인해, EU 고객에게 서비스를 제공하는 영국 기업은 두 규제 체계를 모두 준수해야 하며, 이로 인해 테스트의 양과 복잡성이 증가하고 있습니다.
아시아태평양은 연평균 성장률(CAGR) 17.10%로 가장 빠르게 성장하는 지역입니다. 중국의 ‘다층 보호 체계 2.0’에서는 레벨 3 이상의 시스템에 대해 동적 평가가 의무화되어 있으며, 이는 대부분의 엔터프라이즈 용도를 포괄합니다. 인도의 ‘디지털 개인 데이터 보호법’에서는 위반 시 최대 25억 루피(3,000만 달러)의 벌금이 부과되므로, 수출업체들은 전 세계 고객을 대상으로 보안 체계 인증을 받도록 권장받고 있습니다. 일본, 한국, 호주, 뉴질랜드는 정보 유출 통지에 관한 법률이 해마다 엄격해지고 있어, 이 또한 큰 기여를 하고 있습니다.
기타 혜택 :
- 엑셀 형식 시장 예측(ME) 시트
- 3개월간의 애널리스트 지원
자주 묻는 질문
목차
제1장 서론
제2장 조사 방법
제3장 주요 요약
제4장 시장 구도
제5장 시장 규모 및 성장 예측
제6장 경쟁 구도
제7장 시장 기회 및 향후 전망
KTH 26.09.14According to Mordor Intelligence, the dynamic application security testing market size is projected to be USD 3.61 billion in 2025, USD 4.18 billion in 2026, and reach USD 8.63 billion by 2031, growing at a CAGR of 15.59% from 2026 to 2031.
This report is Segmented by Component (Solutions, and Services), Deployment Mode (Cloud-Based, and On-Premise), Organisation Size (Large Enterprises, and Small and Medium Enterprises), End-User Vertical (BFSI, Healthcare, IT and Telecom, Industrial and Defence, Retail and E-Commerce, Energy and Utilities, and More), and Geography. The Market Forecasts are Provided in Terms of Value (USD).
Global Dynamic Application Security Testing Market Trends and Insights
Rising Volume of API-Centric Attacks
API endpoints generated 48% of all web-application attacks in 2024, equal to 150 billion events that Akamai traced across its global network. Wallarm cataloged 1,602 unique API vulnerabilities in Q3 2025, a 20% sequential rise, dominated by broken object-level authorization and excessive data exposure flaws. The shift to microservices means a modern commerce application now surfaces 200-500 APIs, magnifying the runtime surface that only the dynamic application security testing market can probe effectively. Traceable AI reported that 57% of organizations suffered an API breach in the prior year, yet just 34% deployed API-specific defenses. Regulatory pressure compounds the urgency, as PSD2 and open-banking rules enforce third-party access that must be validated for authorization integrity.
Shift-Left DevSecOps Adoption
GitLab's 2024 survey showed 58% of developers already run dynamic tests during development pipelines, up from 41% two years earlier. Despite this progress, only one-third include dedicated API scans, largely because authentication credentials and ephemeral test environments complicate automation. Datadog found that 15% of live services still contained vulnerabilities cataloged in CISA's Known Exploited list, reinforcing the need for earlier discovery. Incremental scanners that test changed endpoints in five-minute cycles now align with sub-10-minute build targets, encouraging broader adoption.
Signal-to-Noise (False-Positive) Fatigue
Security teams face a significant challenge in managing the overwhelming volume of alerts generated by their systems, with 70-90% of these alerts being false positives. This high rate of irrelevant alerts forces teams to spend considerable time and resources triaging thousands of notifications just to identify the critical 10-30% that genuinely require attention. Over time, developers tend to disregard alerts due to the persistent noise, which ultimately compromises the achievement of essential security objectives. To address this issue, instrumented proof-based scanning solutions offered by vendors like Invicti have proven effective in reducing irrelevant findings by up to 60%. This improvement not only enhances efficiency but also allows security teams to focus on actionable insights. As a result, buyers are increasingly emphasizing precision as a critical requirement, often listing it as a mandatory feature in their requests for proposals.
Other drivers and restraints analyzed in the detailed report include:
- Mandatory SBOM and Supply-Chain Disclosure Rules
- AI-Enabled Exploit Automation
- Scarcity of AppSec Skill-Sets
For complete list of drivers and restraints, kindly check the Table Of Contents.
Segment Analysis
Solutions generated 68.30% of 2025 revenue, showing that enterprises still license full-featured platforms to cover broad asset inventories. Yet the services slice is growing at 15.62% CAGR, faster than the overall dynamic application security testing market. Providers integrate scanners with CI/CD systems, tune authentication flows, and interpret findings for business units. Global consultancies, including Accenture, expanded application-security headcount through 2025 to meet this demand.
Services also appeal to organizations that struggle with false positives; a managed team validates exploitability before escalating, trimming alert queues. As a result, the dynamic application security testing market size attached to services is projected to expand steadily through 2031. Vendors respond by bundling onboarding, custom policy creation, and regular health checks inside subscription tiers, aligning economic incentives with customer outcomes.
In 2025, spending on cloud-hosted scanners accounted for 73.50%, and they continue to outpace on-premise solutions, growing at a rate of 15.76% CAGR. Cloud engines possess the capability to discover and test containerized microservices and serverless functions, which are redeployed dozens of times daily, in near real-time. This ability to handle frequent redeployments efficiently is a key factor driving the adoption of cloud-hosted solutions. The extension of Amazon Inspector to Lambda and container workloads further highlights the growing preference of buyers for fully managed offerings, as these solutions reduce operational overhead and enhance scalability.
In industries with stringent regulations, on-premise deployment remains a critical requirement due to data sovereignty policies that limit external processing. These policies ensure sensitive data remains within controlled environments, making on-premise solutions indispensable for compliance. As a result, hybrid architectures are emerging as a practical solution: the scan engine operates in the vendor's cloud, but credentials and other sensitive data are securely stored on the customer's hardware. This setup ensures compliance requirements are met without compromising the breadth of security coverage. Such a mixed model underscores the adaptability and flexibility required in the dynamic application security testing market, enabling it to cater to both cloud-centric developers seeking innovation and risk-averse incumbents prioritizing regulatory compliance and data security.
Complete Report Scope:
- By Component
- Solutions
- Services
- By Deployment Mode
- Cloud-Based
- On-Premise
- By Organisation Size
- Large Enterprises
- Small and Medium Enterprises
- By End-User Vertical
- BFSI
- Healthcare
- IT and Telecom
- Industrial and Defence
- Retail and E-Commerce
- Energy and Utilities
- Manufacturing
- Other End-User Vertical
- By Geography
- North America
- United States
- Canada
- Mexico
- South America
- Brazil
- Argentina
- Rest of South America
- Europe
- Germany
- United Kingdom
- France
- Italy
- Spain
- Rest of Europe
- Asia Pacific
- China
- Japan
- South Korea
- India
- Australia
- New Zealand
- Rest of Asia-Pacific
- Middle East and Africa
- Middle East
- United Arab Emirates
- Saudi Arabia
- Turkey
- Rest of Middle East
- Africa
- South Africa
- Nigeria
- Kenya
- Rest of Africa
- Middle East
- North America
Geography Analysis
North America led with 42.80% of 2025 revenue because Executive Order 14028 forces federal contractors to demonstrate runtime vulnerability validation. Adoption depth is highest, but teams also experience the greatest alert fatigue, spurring premium demand for proof-based scanning and AI triage. Canada's Critical Cyber Systems Protection Act, enacted in 2024, widened mandatory testing to provincially regulated utilities, adding incremental demand.
Europe contributed roughly 29% of spending in 2025, propelled by the progressive rollout of NIS2, DORA, and the Cyber Resilience Act. German and French financial institutions extend scans to every third-party API, aligning with 24-hour incident-report deadlines. Post-Brexit divergence obliges United Kingdom firms that serve EU clients to follow both regulation sets, inflating test volume and complexity.
Asia-Pacific is the fastest growing region at a 17.10% CAGR. China's Multi-Level Protection Scheme 2.0 now mandates dynamic assessments for Level 3 systems or higher, covering most enterprise applications. India's Digital Personal Data Protection Act enforces fines up to INR 2.5 billion (USD 30 million) for breaches, encouraging exporters to certify security posture to global customers. Japan, South Korea, Australia, and New Zealand together make sizeable contributions where breach-notification laws tighten annually.
- IBM Corporation
- Synopsys Inc.
- Veracode Inc.
- Checkmarx Ltd.
- OpenText Corporation (Fortify)
- Rapid7 Inc.
- Qualys Inc.
- Invicti Security Ltd.
- Contrast Security Inc.
- HCLTech Ltd. (AppScan)
- GitLab Inc.
- Snyk Ltd.
- Tenable Holdings Inc.
- PortSwigger Ltd. (Burp Suite)
- Indusface Pvt Ltd.
- NowSecure Inc.
- Appknox Pte Ltd.
- CyCognito Inc.
- WhiteHat Security Inc. (NTT)
- Cobalt Labs Inc.
Additional Benefits:
- The market estimate (ME) sheet in Excel format
- 3 months of analyst support
TABLE OF CONTENTS
1 INTRODUCTION
- 1.1 Study Assumptions and Market Definition
- 1.2 Scope of the Study
2 RESEARCH METHODOLOGY
3 EXECUTIVE SUMMARY
4 MARKET LANDSCAPE
- 4.1 Market Overview
- 4.2 Market Drivers
- 4.2.1 Shift-left DevSecOps Adoption
- 4.2.2 Rising Volume of API-Centric Attacks
- 4.2.3 AI-Enabled Exploit Automation
- 4.2.4 Mandatory SBOM and Supply-Chain Disclosure Rules
- 4.2.5 Pay-per-Scan Pricing Disrupting TCO
- 4.2.6 Low-Code/No-Code Proliferation
- 4.3 Market Restraints
- 4.3.1 Signal-to-Noise (False-Positive) Fatigue
- 4.3.2 Limited Runtime and Business-Logic Coverage
- 4.3.3 Scarcity of AppSec Skill-Sets
- 4.3.4 Fragmented Standards across Jurisdictions
- 4.4 Industry Value-Chain Analysis
- 4.5 Regulatory Landscape
- 4.6 Technological Outlook
- 4.7 Porter's Five Forces Analysis
- 4.7.1 Bargaining Power of Buyers
- 4.7.2 Bargaining Power of Suppliers
- 4.7.3 Threat of New Entrants
- 4.7.4 Threat of Substitutes
- 4.7.5 Competitive Rivalry
5 MARKET SIZE AND GROWTH FORECASTS (VALUE)
- 5.1 By Component
- 5.1.1 Solutions
- 5.1.2 Services
- 5.2 By Deployment Mode
- 5.2.1 Cloud-Based
- 5.2.2 On-Premise
- 5.3 By Organisation Size
- 5.3.1 Large Enterprises
- 5.3.2 Small and Medium Enterprises
- 5.4 By End-User Vertical
- 5.4.1 BFSI
- 5.4.2 Healthcare
- 5.4.3 IT and Telecom
- 5.4.4 Industrial and Defence
- 5.4.5 Retail and E-Commerce
- 5.4.6 Energy and Utilities
- 5.4.7 Manufacturing
- 5.4.8 Other End-User Vertical
- 5.5 By Geography
- 5.5.1 North America
- 5.5.1.1 United States
- 5.5.1.2 Canada
- 5.5.1.3 Mexico
- 5.5.2 South America
- 5.5.2.1 Brazil
- 5.5.2.2 Argentina
- 5.5.2.3 Rest of South America
- 5.5.3 Europe
- 5.5.3.1 Germany
- 5.5.3.2 United Kingdom
- 5.5.3.3 France
- 5.5.3.4 Italy
- 5.5.3.5 Spain
- 5.5.3.6 Rest of Europe
- 5.5.4 Asia Pacific
- 5.5.4.1 China
- 5.5.4.2 Japan
- 5.5.4.3 South Korea
- 5.5.4.4 India
- 5.5.4.5 Australia
- 5.5.4.6 New Zealand
- 5.5.4.7 Rest of Asia-Pacific
- 5.5.5 Middle East and Africa
- 5.5.5.1 Middle East
- 5.5.5.1.1 United Arab Emirates
- 5.5.5.1.2 Saudi Arabia
- 5.5.5.1.3 Turkey
- 5.5.5.1.4 Rest of Middle East
- 5.5.5.2 Africa
- 5.5.5.2.1 South Africa
- 5.5.5.2.2 Nigeria
- 5.5.5.2.3 Kenya
- 5.5.5.2.4 Rest of Africa
- 5.5.5.1 Middle East
- 5.5.1 North America
6 COMPETITIVE LANDSCAPE
- 6.1 Market Concentration
- 6.2 Strategic Moves
- 6.3 Market Share Analysis
- 6.4 Company Profiles (includes Global Level Overview, Market Level Overview, Core Segments, Financials as available, Strategic Information, Market Rank/Share, Products and Services, Recent Developments)
- 6.4.1 IBM Corporation
- 6.4.2 Synopsys Inc.
- 6.4.3 Veracode Inc.
- 6.4.4 Checkmarx Ltd.
- 6.4.5 OpenText Corporation (Fortify)
- 6.4.6 Rapid7 Inc.
- 6.4.7 Qualys Inc.
- 6.4.8 Invicti Security Ltd.
- 6.4.9 Contrast Security Inc.
- 6.4.10 HCLTech Ltd. (AppScan)
- 6.4.11 GitLab Inc.
- 6.4.12 Snyk Ltd.
- 6.4.13 Tenable Holdings Inc.
- 6.4.14 PortSwigger Ltd. (Burp Suite)
- 6.4.15 Indusface Pvt Ltd.
- 6.4.16 NowSecure Inc.
- 6.4.17 Appknox Pte Ltd.
- 6.4.18 CyCognito Inc.
- 6.4.19 WhiteHat Security Inc. (NTT)
- 6.4.20 Cobalt Labs Inc.
7 MARKET OPPORTUNITIES AND FUTURE OUTLOOK
- 7.1 White-Space and Unmet-Need Assessment


