
|
시장보고서
상품코드
2124498
핀테크 블록체인 : 시장 점유율 분석, 업계 동향과 통계, 성장 예측(2026-2031년)Fintech Blockchain - Market Share Analysis, Industry Trends & Statistics, Growth Forecasts (2026 - 2031) |
||||||
 Mordor Intelligence
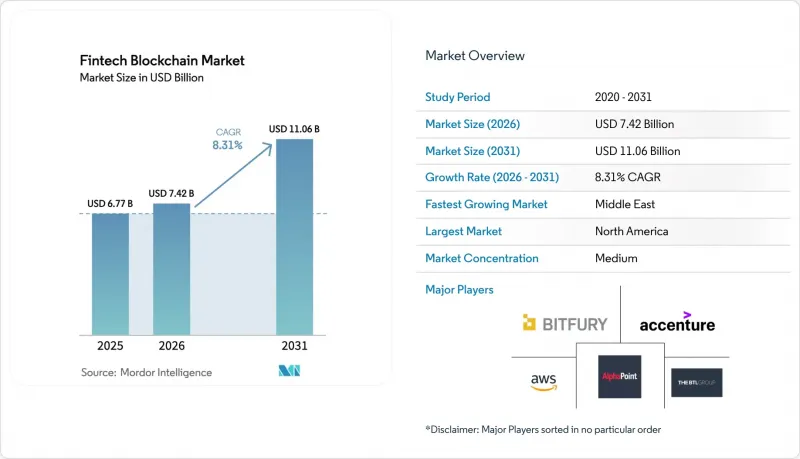
Mordor Intelligence에 의하면, 핀테크·블록체인 시장 규모는 2025년 67억 7,000만 달러에서 2026년에는 74억 2,000만 달러, 2031년까지 110억 6,000만 달러에 이를 것으로 예상되고 있어 2026-2031년 CAGR 8.31%를 기록할 전망입니다.
본 보고서는 공급자별(미들웨어 공급자, 용도 및 솔루션 공급자, 인프라 및 프로토콜 공급자), 용도별(거래소 및 송금, 스마트 계약 등), 조직 규모별(대기업, 중소기업), 최종 사용자 산업별(은행, 보험 등), 지역별로 분류되어 있습니다. 시장 전망은 금액(달러) 단위로 표시되어 있습니다.
세계 핀테크·블록체인 시장 동향 및 인사이트
국경을 초월한 결제 분야에서 블록체인 채택 확대
SWIFT가 2025년 9월에 분산 원장 모듈을 도입한 것은 하루 4,000만 건의 메시지를 처리하는 해당 네트워크가 즉각적이고 온체인 가시성으로 방향을 전환했음을 나타내며, 리플(Ripple)이나 스텔라(Stellar)의 결제 경로와의 기술 격차를 좁히는 계기가 되었습니다. 국제결제은행(BIS)은 ‘mBridge’ 프로젝트가 2025년에 220억 달러 규모의 도매 거래를 결제하며, 결제 시간을 2일에서 수 초로 단축하고 수수료를 절반으로 줄였음을 확인했습니다. 개인용 송금 경로도 이에 발맞추고 있으며, 머니그램이 스텔라(Stellar)의 송금 경로를 통합해 거래 비용을 1% 미만으로 낮춘 것이 그 증거입니다. 전 세계 송금액의 42%를 차지하는 아시아태평양은 싱가포르의 ‘결제 서비스법’에 기반한 지원적인 규제 덕분에 가장 큰 샌드박스 환경을 제공합니다. 규제 확실성이 높아짐에 따라, 국경을 넘는 송금 경로는 2031년보다 훨씬 이전에 블록체인 송금 경로로 결정적으로 전환될 것으로 예측됩니다.
실물 자산의 토큰화 진전
세계경제포럼은 2030년까지 토큰화된 실물 자산의 규모가 16조 달러에 달할 가능성이 있다고 예측하고 있지만, 유동성은 여전히 허가제 거래 플랫폼들 사이에 분산된 상태입니다. 유럽투자은행은 디지털 채권 발행 규모를 2021년 1억 유로에서 2025년까지 6억 유로(6억 4,800만 달러)로 확대하여, 전장부 시스템에 비해 운영 비용을 절감했습니다. 지멘스가 Polygon에서 발행한 6,000만 유로(6,500만 달러) 규모의 디지털 채권은 발행 비용을 40% 절감하고 중개자를 배제했습니다. Paxos Gold와 같은 토큰화된 원자재의 발행 잔액은 현재 10억 달러를 초과하며, 분산형 대출 풀에 온체인 담보를 제공합니다. 토큰화된 전통 자산에 대한 바젤 I의 취급으로 과도한 자본 가중치가 제거되어, 은행 대차대조표가 토큰화된 담보를 수용할 수 있는 길이 열렸습니다.
허가형 원장 간의 상호 운용성 격차
기업들은 종종 Hyperledger Fabric, R3 Corda, Canton과 같은 여러 컨소시엄에 참여하고 있지만, 합의 방식이나 데이터 모델의 차이로 인해 병행된 인프라 구축을 강요받게 되어 비용과 백오피스 대조 작업이 증가하고 있습니다. 체인링크(Chainlink)의 CCIP는 크로스체인 메시징을 약속하고 있지만, 대부분의 허가형 원장이 외부 Oracle에 대한 접근을 제한하고 있어 여전히 퍼블릭 네트워크로 한정되어 있습니다. 유럽 블록체인 서비스 인프라(European Blockchain Service Infrastructure)는 이러한 과제를 여실히 보여주고 있습니다. 27개 회원국이 각각 서로 다른 ID 스키마를 채택하고 있어 원활한 데이터 교환이 저해되고 있습니다. 그 결과, 은행들은 지배적인 컨소시엄에 유연성을 양보할지, 아니면 네트워크 효과를 희생하고 고립된 네트워크를 운영할지 선택의 기로에 서 있습니다. 개인정보 보호, 감사, 처리량 요건을 충족하는 범용 상호운용성 계층이 등장하기 전까지는 멀티레저로 인한 분절이 대규모 도입의 걸림돌이 될 것입니다.
부문 분석
2025년, 미들웨어 제공업체는 핀테크·블록체인 시장 점유율의 42.36%를 차지하고 있으며, 이는 기존 코어 시스템과 여러 분산 원장을 시스템을 전면적으로 교체하는 것과 같은 혼란을 초래하지 않고 연결해 주는 추상화 계층에 대한 기업 수요가 높음을 뒷받침합니다. IBM Blockchain과 같은 플랫폼은 무역 금융 컨소시엄을 위해 초당 2만 건 이상의 트랜잭션을 처리하며, 기밀 데이터의 분리 및 세밀한 권한 관리를 가능하게 합니다. 은행들이 시장 출시 시간을 단축하는 턴키 방식의 결제, 수탁, 규정 준수 모듈을 선택함에 따라 용도 및 솔루션 공급업체가 지출의 약 35%를 차지했습니다. 핀테크 블록체인 시장에서 인프라 및 프로토콜 제공업체의 점유율은 연평균 성장률(CAGR) 8.89%로 확대되고 있습니다. 이는 기업들이 현재 이더리움의 레이어 2 롤업, 폴리곤의 지분 증명(PoS) 체인, 아발란치의 서브넷에서 자체 호스팅형 노드를 구축하고 있으며, 이들이 1초 미만의 최종 확정 시간과 극히 적은 수수료를 실현하고 있기 때문입니다. Canton Network의 프라이버시 보호형 동기화 기능은 오더북의 과도한 공유를 피하면서도 단일한 신뢰할 수 있는 정보원을 원하는 자본 시장 사업자들의 관심을 끌고 있습니다. Oracle이 ‘블록체인 플랫폼’을 ‘퓨전 클라우드’ 제품군에 통합한 것은 소프트웨어 대기업들이 원장 서비스를 ERP 및 공급망 모듈과 번들로 묶어 기업의 워크플로우를 자사 플랫폼에 정착시키려 하고 있음을 보여줍니다.
대형 은행들이 비용과 지연 시간 관리를 위해 프로토콜 전문 지식을 사내에 도입하는 반면, 중견 금융 기관들은 노드 유지 관리 및 거버넌스 업그레이드를 외부에 위탁하는 매니지드 미들웨어를 선호하기 때문에 수요 패턴은 변화할 전망입니다. 또한 Hyperledger Fabric, Corda, 이더리움이 모두 플러그인 가능한 합의 알고리즘을 제공함으로써, 제3자 서비스 기업이 독자적인 코드가 아닌 지원을 통해 수익을 창출할 수 있게 되었기 때문에 오픈소스 생태계도 경쟁 구도를 변화시키고 있습니다. 기업들이 멀티레저 아키텍처를 도입함에 따라, 네트워크 간 API와 이벤트 스트림을 표준화하는 중립적인 오케스트레이터가 압도적인 시장 점유율을 확보할 전망입니다. 그 결과, 2031년까지 프로토콜에 대한 지출이 더 높은 성장률을 보일 것이며, 미들웨어는 절대적인 수익 면에서 주도적인 위치를 유지할 것으로 예측됩니다.
결제, 청산 및 결제 처리는 계속해서 핵심을 이루고 있으며, 기존 기업들이 블록체인을 통한 추적 기능과 온디맨드 유동성 서비스를 통합함에 따라 2025년 지출의 39.56%를 차지했습니다. 한편, 은행들이 W3C의 ‘검증 가능한 자격 증명(Verifiable Credentials)’을 채택하여 고객 확인(KYC) 결과를 중앙 집중화하면서도 원시 데이터 저장을 분산화함에 따라, ID 관리 분야는 9.51%라는 가장 높은 연평균 성장률(CAGR)을 기록했습니다. 거래소 및 송금 플랫폼과 관련된 핀테크·블록체인 시장 규모는 코인베이스(Coinbase)의 기관 투자자 대상 브로커 업무와 스텔라(Stellar)의 머니그램(MoneyGram) 송금 경로에 힘입어 약 22%를 차지했습니다. 신용장(L/C) 워크플로우와 파라메트릭 보험을 지원하는 스마트 계약은 체인링크(Chainlink)의 Oracle이 1만 건 이상의 가동 중인 계약에 데이터를 공급하고 있어 약 18%를 차지했습니다. 컴플라이언스 관리는 MiCA(금융시장규제) 규정에 따라 유럽에서 실시간 블록체인 분석이 의무화됨에 따라 12%를 차지했습니다.
앞으로 분산형 식별자가 모바일 지갑이나 정부의 전자 ID 프로그램에 원활하게 통합된다면, ID 레이어는 결제 분야를 능가하는 기세를 보일 것으로 보입니다. 예전에는 며칠이 걸리던 은행 계좌 개설 절차가 이제는 몇 분 만에 완료되어 직원의 업무 부담이 줄어들고 전환율도 향상되고 있습니다. 국경을 넘는 무역에서 선하증권이나 원산지 증명서가 디지털화됨에 따라, ID 모듈과 컴플라이언스 모듈이 상호 연동되어 계약 체결부터 통관에 이르는 스트레이트 스루 처리가 가능해집니다. 아시아태평양의 슈퍼 앱에서 진행 중인 토큰화된 로열티 프로그램 및 분산형 신용 평가 시범 프로젝트는 적용 범위를 더욱 확대하며, 핀테크 블록체인 시장이 그 출발점인 결제 분야를 넘어 지속적으로 다각화될 것임을 확실히 하고 있습니다.
지역별 분석
북미 핀테크·블록체인 시장 규모는 규제 당국이 토큰화된 자산의 취급 방침을 명확히 하고, 기관 투자자들이 ETF로의 자금 유입을 확대하는 가운데 여전히 벤치마크 역할을 하고 있습니다. 미국 은행들은 ‘GENIUS 법’의 보호 조치를 활용하여 사채를 토큰화하고 있으며, 캐나다에서는 비은행 기관에 대한 보관 라이선스 확대가 진행되고, 멕시코에서는 핀테크법 개정을 통해 이미 미국으로 향하는 고액 거래의 8%를 처리하고 있는 샌드박스 내 시범 사업이 허용되고 있습니다. 주요 클라우드 제공업체들이 이 지역에 본사를 두고 있어 기업들은 풍부한 인프라 선택권을 누릴 수 있으며, 이는 현재의 수익 면에서의 우위를 더욱 공고히 하고 있습니다.
유럽은 초기 단계부터 구축된 디지털 채권 프레임워크와 MiCA에 따른 통일된 패스포트 제도의 혜택을 받고 있으며, 이를 통해 법적 분절화가 완화되고 유럽 대륙 전체로의 확산이 촉진되고 있습니다. 독일의 전자증권법에 따라 이미 유로화 표시 채권의 온체인 직접 발행이 가능해졌습니다. 프랑스는 서클(Circle)사의 유럽 본사 이전을 유치하며 정책 측면에서의 경쟁력을 부각시켰습니다. 한편, 유럽연합(EU)을 탈퇴한 영국은 디지털 증권 샌드박스를 활용하여 존재감을 유지하고 있으며, 스위스의 독립적인 DLT 법은 계속해서 수탁 관련 스타트업 기업들을 유치하고 있습니다.
아시아태평양에서는 진행 상황에 차이가 보입니다. 중국의 소액용 디지털 통화는 거래량 측면에서 다른 CBDC 시범 사업을 압도하고 있지만, 엄격한 자본 규제로 인해 국경을 넘는 이용은 제한되고 있습니다. 일본의 ‘디지털 엔’, 인도의 블록체인 기반 UPI, 그리고 한국의 토큰화 채권 샌드박스는 상호운용성 문제가 해결된다면 해당 지역에서의 급속한 확산을 위한 기반을 마련하고 있습니다. 호주에서 CHESS 대체 시스템의 도입 지연은 구현의 복잡성을 여실히 드러내는 한편, 대규모 도입을 위한 장기적인 노력을 뒷받침하고 있습니다. 이 지역 전체적으로는 블록체인을 활용한 포인트 프로그램과 마이크로 보험을 통합한 슈퍼 앱이 일반 소비자의 참여를 확대할 가능성이 높습니다.
기타 혜택:
- 엑셀 형식 시장 예측(ME) 시트
- 3개월간의 애널리스트 지원
자주 묻는 질문
목차
제1장 서론
제2장 조사 방법
제3장 주요 요약
제4장 시장 구도
제5장 시장 규모와 성장 예측
제6장 경쟁 구도
제7장 시장 기회와 향후 전망
LSHAccording to Mordor Intelligence, the fintech blockchain market size is expected to increase from USD 6.77 billion in 2025 to USD 7.42 billion in 2026 and reach USD 11.06 billion by 2031, growing at a CAGR of 8.31% over 2026-2031.
This report is Segmented by Provider (Middleware Providers, Application and Solution Providers, Infrastructure and Protocol Providers), Application (Exchanges and Remittance, Smart Contract, and More), Organization Size (Large Enterprises, and Small and Medium-Sized Enterprises), End-User Verticals (Banking, Insurance, and More), and Geography. The Market Forecasts are Provided in Terms of Value (USD).
Global Fintech Blockchain Market Trends and Insights
Increasing Adoption of Blockchain for Cross-Border Payments
SWIFT's September 2025 rollout of a distributed-ledger module signaled a pivot by the 40 million messages per day network toward instant, on-chain visibility, narrowing the technology gap with Ripple and Stellar corridors. The Bank for International Settlements confirmed that Project mBridge settled USD 22 billion in wholesale trades during 2025, compressing settlement time from two days to seconds and halving fees. Consumer remittance lanes are following suit, evidenced by MoneyGram's integration of Stellar rails that cut transaction costs below 1%. Asia-Pacific, which accounts for 42% of global remittance volume, offers the largest sandbox thanks to supportive rules under Singapore's Payment Services Act. As regulatory certainty grows, cross-border corridors are expected to tip decisively toward blockchain rails well before 2031.
Growing Tokenization of Real-World Assets
The World Economic Forum projects that tokenized real-world assets could represent USD 16 trillion by 2030, yet liquidity remains fragmented across permissioned venues. The European Investment Bank scaled digital-bond issuance from EUR 100 million in 2021 to EUR 600 million (USD 648 million) by 2025, proving operational savings over book-entry systems. Siemens's EUR 60 million (USD 65 million) digital bond on Polygon reduced issuance costs by 40% and bypassed intermediaries. Tokenized commodities such as Paxos Gold now exceed USD 1 billion outstanding, furnishing on-chain collateral for decentralized lending pools. Basel Group 1 treatment for tokenized traditional assets eliminates punitive capital weights, opening bank balance sheets to tokenized collateral.
Interoperability Gaps Among Permissioned Ledgers
Enterprises often participate in multiple consortia, Hyperledger Fabric, R3 Corda, and Canton, yet divergent consensus and data models force parallel infrastructure, inflating costs and back-office reconciliation. Chainlink's CCIP promises cross-chain messaging but remains confined to public networks because most permissioned ledgers restrict external oracle access. The European Blockchain Services Infrastructure illustrates the challenge: 27 member states adopted varied identity schemas, blocking seamless data exchange. Banks, therefore, face a choice between surrendering flexibility to a dominant consortium or running isolated networks that sacrifice network effects. Until a universal interoperability layer meets privacy, audit, and throughput needs, multi-ledger fragmentation will temper large-scale rollouts.
Other drivers and restraints analyzed in the detailed report include:
- Rising Demand for Compliance Automation (RegTech)
- Expansion of Stablecoins in Corporate Treasury
- Capital-Charge Impact of Basel Crypto Rules on Banks
For complete list of drivers and restraints, kindly check the Table Of Contents.
Segment Analysis
Middleware providers held 42.36% of the fintech blockchain market share in 2025, underscoring enterprise demand for abstraction layers that bridge legacy core systems to multiple distributed ledgers without rip-and-replace disruption. Platforms such as IBM Blockchain process over 20,000 transactions per second for trade-finance consortia, enabling confidential data segregation and granular permissioning. Application and solution vendors controlled roughly 35% of spending as banks opted for turnkey payment, custody, and compliance modules that accelerate time-to-market. The fintech blockchain market size allocation for infrastructure and protocol providers is rising at an 8.89% CAGR because firms now spin up self-hosted nodes on Ethereum Layer-2 rollups, Polygon proof-of-stake chains, and Avalanche subnets that achieve sub-second finality and negligible fees. Canton Network's privacy-preserving synchronization is attracting capital markets operators seeking a single source of truth without over-sharing order books. Oracle's integration of Blockchain Platform into its Fusion Cloud suite illustrates how software giants bundle ledger services with ERP and supply-chain modules to lock in enterprise workflows.
Demand patterns are set to evolve as large banks insource protocol expertise for cost and latency control, while mid-tier institutions favor managed middleware that outsources node maintenance and governance upgrades. Open-source ecosystems are also shifting the competitive balance because Hyperledger Fabric, Corda, and Ethereum each offer pluggable consensus, enabling third-party service firms to monetize support rather than proprietary code. As firms deploy multi-ledger architectures, neutral orchestrators that normalize APIs and event streams across networks stand to capture outsized wallet share. Consequently, middleware is expected to retain leadership in absolute revenue, even though protocol spending posts the faster growth rate through 2031.
Payments, clearing, and settlement remained the anchor, commanding 39.56% of 2025 spending as incumbents integrated blockchain tracking and on-demand liquidity services. Identity management, however, posted the highest 9.51% CAGR as banks adopted W3C Verifiable Credentials to centralize know-your-customer outcomes while decentralizing raw data storage. The fintech blockchain market size attached to exchanges and remittance platforms represented about 22%, driven by Coinbase institutional brokerage and Stellar MoneyGram corridors. Smart contracts supporting letter-of-credit workflows and parametric insurance captured roughly 18%, with Chainlink oracles feeding data into more than 10,000 live contracts. Compliance management rounded out 12% as MiCA rules forced real-time blockchain analytics in Europe.
Looking ahead, identity layers are poised to leapfrog payments once decentralized identifiers integrate seamlessly into mobile wallets and government e-ID programs. Bank onboarding that once took days now completes in minutes, freeing staff capacity and improving conversion. As cross-border trade digitizes bills of lading and certificates of origin, identity and compliance modules will intertwine, enabling straight-through processing from contract initiation to customs clearance. Tokenized loyalty and decentralized credit scoring pilots in Asia-Pacific super-apps further broaden application scope, ensuring the fintech blockchain market continues to diversify beyond its payment roots.
Complete Report Scope:
- By Provider
- Middleware Providers
- Application and Solution Providers
- Infrastructure and Protocol Providers
- By Application
- Payments, Clearing, and Settlement
- Exchanges and Remittance
- Smart Contract
- Identity Management
- Compliance Management / KYC
- Other Applications
- By Organization Size
- Large Enterprises
- Small and Medium-Sized Enterprises
- By End-User Verticals
- Banking
- Non-Banking Financial Services
- Insurance
- By Geography
- North America
- United States
- Canada
- Mexico
- Europe
- Germany
- United Kingdom
- France
- Russia
- Rest of Europe
- Asia-Pacific
- China
- Japan
- India
- South Korea
- Australia
- Rest of Asia-Pacific
- Middle East and Africa
- Middle East
- Saudi Arabia
- United Arab Emirates
- Rest of Middle East
- Africa
- South Africa
- Egypt
- Rest of Africa
- Middle East
- South America
- Brazil
- Argentina
- Rest of South America
- North America
Geography Analysis
North America's fintech blockchain market size remains the benchmark as regulators clarify tokenized-asset treatment and institutional investors scale ETF flows. United States banks use GENIUS Act protections to tokenize corporate bonds, while Canada expands custody licenses to non-bank entities, and Mexico's fintech-law amendments permit sandbox pilots that already process 8% of the high-value corridor to the United States. With major cloud providers headquartered in the region, enterprises enjoy abundant infrastructure choice, reinforcing the current revenue lead.
Europe benefits from early digital-bond frameworks and MiCA's uniform passporting, which reduces legal fragmentation and encourages continental deployment. Germany's electronic securities law has already enabled direct issuance of EUR-denominated bonds on-chain. France captured Circle's European headquarters relocation, highlighting policy competitiveness. Meanwhile, the United Kingdom, now outside the European Union, uses a digital-securities sandbox to maintain relevance, plus Switzerland's independent DLT law continues to attract custody startups.
Asia-Pacific exhibits heterogeneous progress. China's retail digital currency dwarfs other CBDC pilots by volume, yet strict capital controls limit cross-border use. Japan's Digital Yen, India's blockchain-enhanced UPI, and South Korea's tokenized-bond sandbox position the region for rapid deployment once interoperability questions are resolved. Australia's delay of the CHESS replacement underscores implementation complexity but also confirms long-term commitment to large-scale adoption. Across the region, super-apps integrating blockchain loyalty points and micro-insurance are likely to widen retail participation.
- Accenture PLC
- AlphaPoint Corporation
- Amazon Web Services Inc.
- Bitfury Group Limited
- BTL Group
- Cambridge Blockchain LLC
- Circle Internet Financial Limited
- Coinbase Inc.
- ConsenSys Software Inc.
- Digital Asset Holdings LLC
- Guardtime AS
- IBM Corporation
- Mastercard Inc.
- Microsoft Corporation
- Oracle Corporation
- Ripple Labs Inc.
- SAP SE
- Stellar Development Foundation
- Tata Consultancy Services
- Visa Inc.
Additional Benefits:
- The market estimate (ME) sheet in Excel format
- 3 months of analyst support
TABLE OF CONTENTS
1 INTRODUCTION
- 1.1 Study Assumptions and Market Definition
- 1.2 Scope of the Study
2 RESEARCH METHODOLOGY
3 EXECUTIVE SUMMARY
4 MARKET LANDSCAPE
- 4.1 Market Overview
- 4.2 Impact of Macroeconomic Factors on the Market
- 4.3 Market Drivers
- 4.3.1 Increasing Adoption of Blockchain for Cross-Border Payments
- 4.3.2 Growing Tokenization of Real-World Assets
- 4.3.3 Rising Demand for Compliance Automation (RegTech)
- 4.3.4 Expansion of Stablecoins in Corporate Treasury
- 4.3.5 Surge in Embedded Finance and BaaS Integrations
- 4.3.6 Higher Venture Funding for Decentralized Finance Platforms
- 4.4 Market Restraints
- 4.4.1 Interoperability Gaps Among Permissioned Ledgers
- 4.4.2 Scarcity of Tokenized-Asset Secondary Liquidity
- 4.4.3 Cross-Chain Bridge Cyber-Risk Exposure
- 4.4.4 Capital-Charge Impact of Basel Crypto Rules on Banks
- 4.5 Industry Value Chain Analysis
- 4.6 Regulatory Landscape
- 4.7 Technological Outlook
- 4.8 Porter's Five Forces Analysis
- 4.8.1 Bargaining Power of Suppliers
- 4.8.2 Bargaining Power of Buyers
- 4.8.3 Threat of New Entrants
- 4.8.4 Threat of Substitutes
- 4.8.5 Intensity of Competitive Rivalry
5 MARKET SIZE AND GROWTH FORECASTS (VALUE)
- 5.1 By Provider
- 5.1.1 Middleware Providers
- 5.1.2 Application and Solution Providers
- 5.1.3 Infrastructure and Protocol Providers
- 5.2 By Application
- 5.2.1 Payments, Clearing, and Settlement
- 5.2.2 Exchanges and Remittance
- 5.2.3 Smart Contract
- 5.2.4 Identity Management
- 5.2.5 Compliance Management / KYC
- 5.2.6 Other Applications
- 5.3 By Organization Size
- 5.3.1 Large Enterprises
- 5.3.2 Small and Medium-Sized Enterprises
- 5.4 By End-User Verticals
- 5.4.1 Banking
- 5.4.2 Non-Banking Financial Services
- 5.4.3 Insurance
- 5.5 By Geography
- 5.5.1 North America
- 5.5.1.1 United States
- 5.5.1.2 Canada
- 5.5.1.3 Mexico
- 5.5.2 Europe
- 5.5.2.1 Germany
- 5.5.2.2 United Kingdom
- 5.5.2.3 France
- 5.5.2.4 Russia
- 5.5.2.5 Rest of Europe
- 5.5.3 Asia-Pacific
- 5.5.3.1 China
- 5.5.3.2 Japan
- 5.5.3.3 India
- 5.5.3.4 South Korea
- 5.5.3.5 Australia
- 5.5.3.6 Rest of Asia-Pacific
- 5.5.4 Middle East and Africa
- 5.5.4.1 Middle East
- 5.5.4.1.1 Saudi Arabia
- 5.5.4.1.2 United Arab Emirates
- 5.5.4.1.3 Rest of Middle East
- 5.5.4.2 Africa
- 5.5.4.2.1 South Africa
- 5.5.4.2.2 Egypt
- 5.5.4.2.3 Rest of Africa
- 5.5.4.1 Middle East
- 5.5.5 South America
- 5.5.5.1 Brazil
- 5.5.5.2 Argentina
- 5.5.5.3 Rest of South America
- 5.5.1 North America
6 COMPETITIVE LANDSCAPE
- 6.1 Market Concentration
- 6.2 Strategic Moves
- 6.3 Market Share Analysis
- 6.4 Company Profiles (includes Global Level Overview, Market Level Overview, Core Segments, Financials as Available, Strategic Information, Market Rank/Share for Key Companies, Products and Services, and Recent Developments)
- 6.4.1 Accenture PLC
- 6.4.2 AlphaPoint Corporation
- 6.4.3 Amazon Web Services Inc.
- 6.4.4 Bitfury Group Limited
- 6.4.5 BTL Group
- 6.4.6 Cambridge Blockchain LLC
- 6.4.7 Circle Internet Financial Limited
- 6.4.8 Coinbase Inc.
- 6.4.9 ConsenSys Software Inc.
- 6.4.10 Digital Asset Holdings LLC
- 6.4.11 Guardtime AS
- 6.4.12 IBM Corporation
- 6.4.13 Mastercard Inc.
- 6.4.14 Microsoft Corporation
- 6.4.15 Oracle Corporation
- 6.4.16 Ripple Labs Inc.
- 6.4.17 SAP SE
- 6.4.18 Stellar Development Foundation
- 6.4.19 Tata Consultancy Services
- 6.4.20 Visa Inc.
7 MARKET OPPORTUNITIES AND FUTURE OUTLOOK
- 7.1 White-Space and Unmet-Need Assessment