

|
시장보고서
상품코드
2124516
지속적 통합 툴 : 시장 점유율 분석, 산업 동향 및 통계 데이터, 성장 예측(2026-2031년)Continuous Integration Tools - Market Share Analysis, Industry Trends & Statistics, Growth Forecasts (2026 - 2031) |
||||||
 Mordor Intelligence
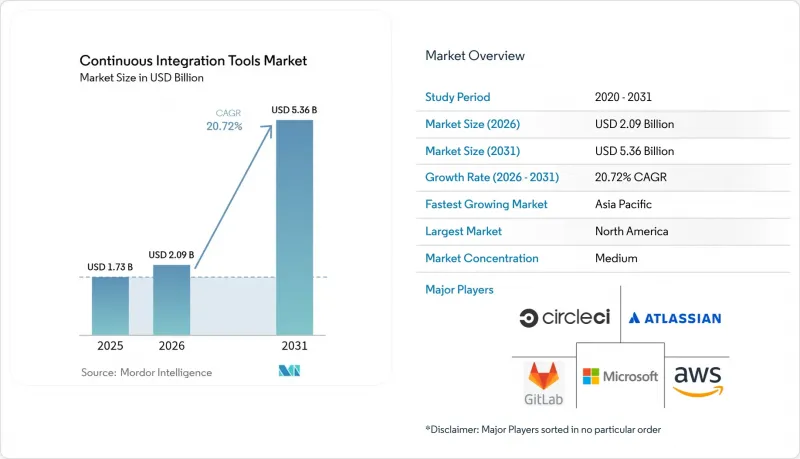
Mordor Intelligence에 의하면, 지속적 통합 툴 시장 규모는 2025년에 17억 3,000만 달러로 평가되었습니다. 2026년 20억 9,000만 달러에서 2031년까지 53억 6,000만 달러에 이를 것으로 예상되며, 예측 기간(2026-2031년) CAGR은 20.72%를 나타낼 전망입니다.
본 보고서는 배포 방식(On-Premise, 클라우드 네이티브 SaaS, 하이브리드), 조직 규모(대기업, 중소기업), 최종 사용자 산업(IT 및 통신, 은행, 금융서비스 및 보험(BFSI), 소매업·전자상거래 등), 적용 단계(빌드 자동화, 테스트 자동화, 릴리스·구현 등) 및 지역별로 분류되어 있습니다. 시장 예측은 금액(달러) 기준으로 제시되어 있습니다.
세계의 지속적 통합 툴 시장 동향 및 인사이트
DevOps 도입 확대와 릴리스 주기 단축에 대한 수요
기업들은 하루에 수십 번이나 배포(deployment)를 수행하는 클라우드 네이티브 경쟁사들을 따라잡기 위해 전달 파이프라인을 재구축하고 있습니다. IBM의 2024년 조사에 따르면, 경영진의 83%가 현대화를 최우선 과제로 꼽았지만, 전환을 완료한 곳은 불과 27%에 그쳤습니다. 이러한 실행상의 격차는 빌드, 테스트, 배포를 단일 자동화 워크플로로 통합하는 플랫폼에 대한 지속적인 투자를 촉진하고 있습니다. 통합된 툴체인은 인계 작업을 줄이고, 포인트 솔루션으로 인한 지연을 해소합니다. 그 결과, 통합 제품군을 제공하는 벤더들이 지속적 통합(CI) 툴 시장에서 표준 서버를 서서히 대체하고 있습니다.
클라우드 네이티브 소프트웨어 개발의 부상
2025년까지 전 세계 클라우드 네이티브 애플리케이션의 총 수는 7억 5,000만 건에 달했습니다. 컨테이너화된 마이크로서비스에는 병렬 빌드, 동적 테스트 환경 및 GitOps 방식의 배포를 오케스트레이션할 수 있는 CI/CD 파이프라인이 필요합니다. 자체 호스팅형 Jenkins와 같은 레거시 솔루션은 이러한 요구 사항을 충족하기 위해 플러그인에 의존하고 있어 추가적인 유지 관리 부담을 야기하고 있습니다. 따라서 기업들은 Kubernetes와의 네이티브 통합 및 멀티 클라우드 지원을 갖춘 솔루션으로 눈을 돌리고 있으며, 이는 지속적 통합 툴 시장에서 하이브리드 모델과 SaaS 모델의 보급을 촉진하고 있습니다.
CI/CD 플랫폼 엔지니어링 분야의 기술 인력 부족
파이프라인 스크립트 작성, 쿠버네티스 클러스터 보안 확보, GitOps 배포 관리를 수행할 수 있는 인력에 대한 수요가 공급을 초과하고 있어, 채용 지연과 컨설팅 비용 급등을 초래하고 있습니다. 이러한 인력 부족으로 인해 총 소유 비용(TCO)이 상승하고, 도입 일정이 지연되고 있습니다. 각 벤더는 사내 전문 지식에 대한 의존도를 낮추는 로우코드 파이프라인 디자이너나 매니지드 서비스를 제공함으로써 이에 대응하고 있습니다. 그럼에도 불구하고 인력 부족은 복잡한 엔터프라이즈 환경에서 지속적 통합 툴의 도입 속도를 저해하는 요인으로 작용하고 있습니다.
부문별 분석
클라우드 네이티브 SaaS 도입은 인프라 유지 관리를 불필요하게 만들고 온보딩을 가속화하여 지속적인 수익을 창출하고 있습니다. 한편, 하이브리드 도입은 15.52%라는 가장 높은 연평균 성장률(CAGR)을 보일 것으로 예상되며, 이는 규제 대상 구매자들이 기밀성이 높은 워크로드에 대해 현지에서 직접 제어하기를 원하고 있음을 여실히 보여줍니다. 벤더들이 NIST SP 800-204D의 제로 트러스트 권장 사항을 반영한 유연한 도입 청사진을 전개함에 따라, 하이브리드 구현을 위한 지속적 통합 툴 시장 규모는 급속히 확대될 것으로 예측됩니다. 프라이빗 에이전트 실행 및 고객 관리형 암호화 키를 통합한 SaaS 제공업체는 당초 클라우드 도입을 추진했던 사용 편의성의 장점을 훼손하지 않으면서도 규정 준수상의 장벽을 해결하고 있습니다.
기업들은 점점 더 ‘두 가지의 장점을 모두 활용하는’ 접근 방식을 채택하고 있으며, 빌드 워커를 On-Premise에서 호스팅하는 한편 가시성과 분석을 위해 클라우드 대시보드를 활용하고 있습니다. 이 아키텍처는 데이터 유출을 제한하면서도 버스트 워크로드에 대한 탄력적인 확장을 유지하고 있으며, 이러한 균형은 지속적 통합 툴 시장에서 공감을 얻고 있습니다. 여러 환경에 걸쳐 아티팩트 저장소, 시크릿 관리, 정책 적용을 동기화할 수 있는 벤더가 우선적인 파트너로 부상하고 있습니다.
현재 대기업이 매출 점유율의 60.58%를 차지하고 있으며, 이는 DevOps의 성숙도와 자원 가용성 측면에서 대기업이 역사적으로 선도해 왔음을 반영합니다. 그러나 종량제 및 프리미엄 플랜의 합리적인 가격 설정 덕분에 중소기업을 대상으로 한 지속적 통합 툴 시장 규모는 급속히 확대되고 있습니다. CircleCI의 엔트리 레벨 요금제(사용자당 360달러)는 스타트업 기업에게 진입 장벽이 낮음을 보여줍니다. 중소기업이 규모를 확장함에 따라 이용 시간은 자연스럽게 증가하여 벤더의 지속적인 수익을 끌어올립니다.
이러한 민주화 추세는 고객 기반을 확대하고, 공급업체로 하여금 독자적인 템플릿, 자동화된 거버넌스, 내장형 보안 스캔 등을 활용하여 온보딩을 효율화하도록 촉진하고 있습니다. 이러한 개선은 내부 간접비 절감을 목표로 하는 대기업에도 이익을 가져다주며, 지속적 통합 툴 시장의 확장을 뒷받침하는 선순환을 만들어내고 있습니다.
지역별 분석
북미는 DevOps의 높은 보급률, 벤처 캐피탈, 그리고 현재 SBOM 보고가 의무화되어 있는 국방 조달의 뒷받침을 받아 매출의 36.05%를 차지하고 있습니다. 미국 기업들은 CI, CD, 보안 스캔, 인프라 프로비저닝을 결합한 종합적인 제품군을 선호하고 있으며, 이로 인해 지속적 통합 툴 시장에서 플랫폼 통합이 촉진되고 있습니다. 캐나다와 멕시코에서는 니어쇼어링(nearshoring) 노력과 중견 제조업 분야의 클라우드 도입을 통해 추가적인 성장이 예상됩니다.
아시아태평양은 연평균 성장률(CAGR) 14.32%로 가장 빠른 성장이 예상됩니다. 인도, 한국, 싱가포르 정부의 인센티브를 통해 클라우드 전환에 대한 지원이 이루어지고 있지만, 데이터 현지화 법안으로 인해 구매자들은 하이브리드 배포 방식을 선택하고 있습니다. 중국에서는 프라이빗 클라우드 기반의 AI 모델이 선호되고 있으며, 이는 호스트형 컨트롤 플레인에서 관리되는 On-Premise형 러너와 일치하여 유연한 벤더에게 새로운 기회가 열리고 있습니다. 또한, CERT-In에 의한 2024년 SBOM 의무화도 인도 전역에서 규정 준수 자동화에 대한 수요를 뒷받침하고 있습니다.
유럽에서는 GDPR(EU 개인정보보호규정) 및 향후 시행될 EU 사이버 복원력 법에 힘입어 꾸준한 성장세가 유지되고 있습니다. 이 모든 요인들이 공급망의 보안 요구 사항을 높이고 있습니다. 구매자들은 데이터의 거주지를 보장하고 자동화된 감사 추적을 생성할 수 있는 솔루션을 높이 평가하며, 지역별 호스팅 및 암호화 인증을 보유한 공급업체에 예산을 할당하고 있습니다. 독일, 프랑스, 영국이 여전히 가장 큰 기여국인 반면, 스칸디나비아 및 동유럽 국가에서는 지속적 통합 툴 시장에서 새로운 수요가 확대되고 있습니다.
기타 혜택 :
- 엑셀 형식 시장 예측(ME) 시트
- 3개월간의 애널리스트 지원
자주 묻는 질문
목차
제1장 서론
제2장 분석 방법
제3장 주요 요약
제4장 시장 구도
제5장 시장 규모 및 성장률 예측
제6장 경쟁 구도
제7장 시장 기회 및 향후 전망
KTH 26.09.14According to Mordor Intelligence, the continuous integration tools market size was valued at USD 1.73 billion in 2025 and estimated to grow from USD 2.09 billion in 2026 to reach USD 5.36 billion by 2031, at a CAGR of 20.72% during the forecast period (2026-2031).
This report is Segmented by Deployment Type (On-Premise, Cloud-Native SaaS, and Hybrid), Organization Size (Large Enterprise, and Small and Medium Enterprise), End-User Industry (IT and Telecom, BFSI, Retail and E-Commerce, and More), Application Stage (Build Automation, Testing Automation, Release and Deployment, and More), and Geography. The Market Forecasts are Provided in Terms of Value (USD).
Global Continuous Integration Tools Market Trends and Insights
Growing DevOps adoption and need for shorter release cycles
Enterprises are rearchitecting their delivery pipelines to match cloud-native competitors that deploy dozens of times a day. An IBM 2024 survey reveals that 83% of executives rank modernization as a top priority, yet only 27% have completed the transition . That execution gap fuels sustained investment in platforms that collapse build, test, and deploy into a single automated workflow. Integrated tool chains also reduce handoffs, eliminating latency caused by point solutions. Consequently, vendors offering consolidated suites are steadily displacing standard-built servers in the continuous integration tools market.
Rising cloud-native software development
The global stock of cloud-native applications is expected to hit 750 million by 2025. Containerized microservices require CI/CD pipelines that can orchestrate concurrent builds, dynamic test environments, and GitOps-style deployments. Legacy solutions, such as self-hosted Jenkins, rely on plugins to meet those needs, creating additional maintenance overhead. Enterprises therefore gravitate toward offerings with native Kubernetes integration and multi-cloud support, reinforcing hybrid and SaaS models inside the continuous integration tools market.
Skill shortages in CI/CD platform engineering
The demand for personnel who can script pipelines, secure Kubernetes clusters, and manage GitOps deployments exceeds the supply, driving hiring delays and increased consulting fees. The scarcity elevates the total cost of ownership and slows adoption timelines. Vendors respond with low-code pipeline designers and managed services that reduce the need for in-house expertise. Still, the talent gap hinders the adoption velocity of continuous integration tools in complex enterprise environments.
Other drivers and restraints analyzed in the detailed report include:
- AI-assisted coding increases build frequency
- Expansion of remote/hybrid work models
- Legacy toolchain complexity and migration costs
For complete list of drivers and restraints, kindly check the Table Of Contents.
Segment Analysis
Cloud-native SaaS deployment retained revenue as it removes infrastructure maintenance and accelerates onboarding. Hybrid deployment, however, is forecast to log the highest 15.52% CAGR, underscoring that regulated buyers want local control over sensitive workloads. The continuous integration tools market size for hybrid implementations is projected to expand sharply as vendors roll out flexible deployment blueprints that mirror zero-trust recommendations from NIST.SP 800-204D. SaaS providers that incorporate private-agent execution or customer-managed encryption keys address compliance barriers without compromising the usability edge that originally drove cloud adoption.
Enterprises increasingly adopt a "best of both" stance, hosting build workers on-premise while leveraging cloud dashboards for visibility and analytics. This architecture limits data egress yet preserves elastic scaling for burst workloads, a balance that resonates within the continuous integration tools market. Vendors able to synchronize artifact stores, secrets management, and policy enforcement across environments are emerging as preferred partners.
Large enterprises currently hold 60.58% revenue share, reflecting their historical lead in DevOps maturity and resource availability. Nonetheless, the continuous integration tools market size attributed to small and medium enterprises is rising quickly due to the affordability of consumption-based pricing and freemium tiers. CircleCI's entry-level plans at USD 360 per seat illustrate low barriers for start-ups. As SMEs scale, they naturally grow usage hours, boosting vendor recurring revenue.
The democratization trend broadens the customer base and pushes vendors to streamline onboarding with opinionated templates, automated governance, and embedded security scanning. Those improvements also benefit large organizations seeking to reduce internal overhead, creating a virtuous cycle that underpins the expansion of the continuous integration tools market.
Complete Report Scope:
- By Deployment Type
- On-premise
- Cloud-native SaaS
- Hybrid
- By End-user Enterprise Size
- Large Enterprises
- Small and Medium Enterprises (SMEs)
- By Application Stage
- Build Automation
- Testing Automation
- Release and Deployment
- Monitoring and Feedback
- By End-User Industry
- IT and Telecom
- BFSI
- Retail and E-commerce
- Healthcare and Life Sciences
- Media and Entertainment
- Education
- Manufacturing
- Government and Public Sector
- By Geography
- North America
- United States
- Canada
- Mexico
- Europe
- Germany
- United Kingdom
- France
- Russia
- Rest of Europe
- Asia-Pacific
- China
- Japan
- India
- South Korea
- Australia
- Rest of Asia-Pacific
- Middle East and Africa
- Middle East
- Saudi Arabia
- United Arab Emirates
- Rest of Middle East
- Africa
- South Africa
- Egypt
- Rest of Africa
- Middle East
- South America
- Brazil
- Argentina
- Rest of South America
- North America
Geography Analysis
North America contributes 36.05% revenue, fueled by deep DevOps penetration, venture capital, and defense procurement that now requires SBOM reporting. U.S. enterprises prefer comprehensive suites that combine CI, CD, security scanning, and infrastructure provisioning, reinforcing platform consolidation in the continuous integration tools market. Canada and Mexico provide supplemental growth through near-shoring initiatives and cloud adoption among mid-sized manufacturers.
The Asia-Pacific region is projected to experience the fastest growth, with a 14.32% CAGR. Government incentives in India, South Korea, and Singapore subsidize cloud migration; however, data-localization laws prompt buyers to opt for hybrid deployments. China's preference for private-cloud AI models aligns with on-premise runners managed from hosted control planes, opening an avenue for flexible vendors. CERT-In's 2024 SBOM mandate likewise drives demand for compliance automation across India.
Europe maintains steady momentum underpinned by GDPR and the forthcoming EU Cyber Resilience Act, both of which elevate supply-chain security requirements. Buyers validate solutions that can guarantee data residency and produce automated audit trails, steering budget toward providers with regional hosting and encryption certificates. Germany, France, and the United Kingdom remain the largest contributors, while Scandinavian and Eastern European countries represent expanding greenfield demand in the continuous integration tools market.
- Atlassian Corporation Plc
- Amazon Web Services, Inc. (AWS)
- Microsoft Corporation (Azure DevOps and GitHub)
- GitLab Inc.
- Circle Internet Services, Inc. (CircleCI)
- CloudBees, Inc.
- JetBrains s.r.o.
- IBM Corporation
- Micro Focus International Plc (OpenText)
- Buddy Works sp. z o.o. sp. k.
- Thoughtworks, Inc.
- Travis CI GmbH
- CodeShip GmbH
- Bitrise Ltd.
- Harness Inc.
- Buildkite Pty Ltd.
- Semaphore (Rendered Text d.o.o.)
- Drone.io (Harness)
- AppVeyor Systems Inc.
- SUSE LLC (Rancher Pipelines)
Additional Benefits:
- The market estimate (ME) sheet in Excel format
- 3 months of analyst support
TABLE OF CONTENTS
1 INTRODUCTION
- 1.1 Study Assumptions and Market Definition
- 1.2 Scope of the Study
2 RESEARCH METHODOLOGY
3 EXECUTIVE SUMMARY
4 MARKET LANDSCAPE
- 4.1 Market Overview
- 4.2 Market Drivers
- 4.2.1 Growing DevOps adoption and need for shorter release cycles
- 4.2.2 Rising cloud-native software development
- 4.2.3 Expansion of remote/hybrid work models
- 4.2.4 Integration of AI-assisted coding increasing build frequenc
- 4.2.5 Shift-left security (DevSecOps) mandates
- 4.2.6 Supply-chain security concerns around open-source components
- 4.3 Market Restraints
- 4.3.1 Skill shortages in CI/CD platform engineering
- 4.3.2 Legacy toolchain complexity and migration costs
- 4.3.3 Escalating cloud expenditure scrutiny (FinOps)
- 4.3.4 Regulatory data-sovereignty hurdles for SaaS CI
- 4.4 Industry Ecosystem Analysis
- 4.5 Regulatory Landscape
- 4.6 Technological Outlook
- 4.7 Porter's Five Forces Analysis
- 4.7.1 Threat of New Entrants
- 4.7.2 Bargaining Power of Buyers
- 4.7.3 Bargaining Power of Suppliers
- 4.7.4 Threat of Substitutes
- 4.7.5 Intensity of Competitive Rivalry
5 MARKET SIZE AND GROWTH FORECASTS (VALUE)
- 5.1 By Deployment Type
- 5.1.1 On-premise
- 5.1.2 Cloud-native SaaS
- 5.1.3 Hybrid
- 5.2 By End-user Enterprise Size
- 5.2.1 Large Enterprises
- 5.2.2 Small and Medium Enterprises (SMEs)
- 5.3 By Application Stage
- 5.3.1 Build Automation
- 5.3.2 Testing Automation
- 5.3.3 Release and Deployment
- 5.3.4 Monitoring and Feedback
- 5.4 By End-User Industry
- 5.4.1 IT and Telecom
- 5.4.2 BFSI
- 5.4.3 Retail and E-commerce
- 5.4.4 Healthcare and Life Sciences
- 5.4.5 Media and Entertainment
- 5.4.6 Education
- 5.4.7 Manufacturing
- 5.4.8 Government and Public Sector
- 5.5 By Geography
- 5.5.1 North America
- 5.5.1.1 United States
- 5.5.1.2 Canada
- 5.5.1.3 Mexico
- 5.5.2 Europe
- 5.5.2.1 Germany
- 5.5.2.2 United Kingdom
- 5.5.2.3 France
- 5.5.2.4 Russia
- 5.5.2.5 Rest of Europe
- 5.5.3 Asia-Pacific
- 5.5.3.1 China
- 5.5.3.2 Japan
- 5.5.3.3 India
- 5.5.3.4 South Korea
- 5.5.3.5 Australia
- 5.5.3.6 Rest of Asia-Pacific
- 5.5.4 Middle East and Africa
- 5.5.4.1 Middle East
- 5.5.4.1.1 Saudi Arabia
- 5.5.4.1.2 United Arab Emirates
- 5.5.4.1.3 Rest of Middle East
- 5.5.4.2 Africa
- 5.5.4.2.1 South Africa
- 5.5.4.2.2 Egypt
- 5.5.4.2.3 Rest of Africa
- 5.5.4.1 Middle East
- 5.5.5 South America
- 5.5.5.1 Brazil
- 5.5.5.2 Argentina
- 5.5.5.3 Rest of South America
- 5.5.1 North America
6 COMPETITIVE LANDSCAPE
- 6.1 Market Concentration
- 6.2 Strategic Moves
- 6.3 Market Share Analysis
- 6.4 Company Profiles {(includes Global level Overview, Market level overview, Core Segments, Financials as available, Strategic Information, Market Rank/Share for key companies, Products and Services, and Recent Developments)}
- 6.4.1 Atlassian Corporation Plc
- 6.4.2 Amazon Web Services, Inc. (AWS)
- 6.4.3 Microsoft Corporation (Azure DevOps and GitHub)
- 6.4.4 GitLab Inc.
- 6.4.5 Circle Internet Services, Inc. (CircleCI)
- 6.4.6 CloudBees, Inc.
- 6.4.7 JetBrains s.r.o.
- 6.4.8 IBM Corporation
- 6.4.9 Micro Focus International Plc (OpenText)
- 6.4.10 Buddy Works sp. z o.o. sp. k.
- 6.4.11 Thoughtworks, Inc.
- 6.4.12 Travis CI GmbH
- 6.4.13 CodeShip GmbH
- 6.4.14 Bitrise Ltd.
- 6.4.15 Harness Inc.
- 6.4.16 Buildkite Pty Ltd.
- 6.4.17 Semaphore (Rendered Text d.o.o.)
- 6.4.18 Drone.io (Harness)
- 6.4.19 AppVeyor Systems Inc.
- 6.4.20 SUSE LLC (Rancher Pipelines)
7 MARKET OPPORTUNITIES and FUTURE OUTLOOK
- 7.1 White-space and Unmet-need Assessment


