
|
시장보고서
상품코드
2124525
POC(Point of Care) 데이터 관리 소프트웨어 : 시장 점유율 분석, 산업 동향 및 통계 데이터, 성장 예측(2026-2031년)Point-of-Care Data Management Software - Market Share Analysis, Industry Trends & Statistics, Growth Forecasts (2026 - 2031) |
||||||
 Mordor Intelligence
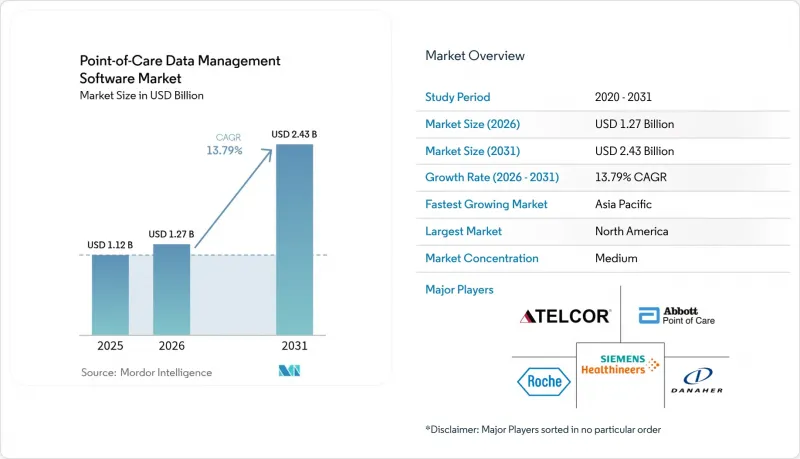
Mordor Intelligence에 의하면, POC(Point of Care) 데이터 관리 소프트웨어 시장 규모는 2025년 11억 2,000만 달러로 평가되었습니다. 2026년에는 12억 7,000만 달러로 확대되어 2026년부터 2031년에 걸쳐 CAGR 13.79%로 성장을 지속하여, 2031년에는 24억 3,000만 달러에 이를 것으로 예측됩니다.
본 보고서는 배포 방식(클라우드 기반, On-Premise, 하이브리드), 최종 사용자(병원/중환자실, 진단센터, 진료소/외래, 재택치료 등), 용도(감염병 진단 기기, 혈당 모니터링 등), 구성 요소(소프트웨어 플랫폼, 서비스) 및 지역별로 분류되어 있습니다. 시장 예측은 금액(달러) 기준으로 제시되어 있습니다.
세계의 POC(Point of Care) 데이터 관리 소프트웨어 시장 동향 및 인사이트
유연한 연결 방식과 인터페이스 솔루션의 혁신
의료 시스템에서는 표준화된 FHIR R4 API를 통해 200종 이상의 서로 다른 POC(Point of Care) 기기를 연동할 수 있는 상호 운용 가능한 미들웨어가 요구되고 있습니다. 이는 CMS(미국 의료보험서비스센터)의 ‘상호 운용성 및 환자 접근 규정’에 의해 촉진된 기능입니다. 현재 각 벤더들은 데이터 사일로를 방지하고 임상 의사 결정을 가속화하기 위해 연결성을 단순한 부가 기능이 아닌 핵심 인프라로 자리매김하고 있습니다. 5G 및 엣지 컴퓨팅 노드의 등장으로 클라우드 네이티브 배포 시 지연 시간이 단축되었으며, 여러 거점을 운영하는 사업자는 분산된 시설 간에 워크플로를 통합할 수 있게 되었습니다. FDA의 ‘디지털 헬스 소프트웨어 사전 인증 프로그램’은 연결성을 규제 심사에 포함시킴으로써 그 중요성을 더욱 높였으며, 지속적인 성능 모니터링에 대한 인센티브를 창출하고 있습니다. 그 결과, 구매자들은 계약을 체결할 때 미들웨어 기능의 깊이와 미래를 내다보는 인터페이스 로드맵을 우선시하게 되었습니다.
의료 인프라 예산 확대
2024년, 각국 정부는 의료 인프라 프로젝트에 2,000억 달러를 투자하며, POC(Point of Care) 데이터 관리 소프트웨어를 포함한 디지털 플랫폼에 막대한 자금을 배정했습니다. 인도의 ‘국가 디지털 헬스 미션’이나 중국의 ‘건강 중국 2030’과 같은 프로그램은 IT 현대화를 위해 예산을 배정하고 있으며, 각국 고유의 데이터 현지화 규정을 충족할 수 있는 벤더에게 새로운 기회를 제공합니다. 민관 파트너십에서는 건설 입찰에 소프트웨어 조항이 포함되는 경우가 많으며, 이로 인해 본래는 선택 사항이었던 기술이 사실상 필수 요건이 됩니다. 새로운 병원이나 진단센터가 가동을 시작함에 따라, 가치 기반 의료 대시보드에 데이터를 공급하는 분석 제품군이 지정되어, 소프트웨어 조달이 시설 건설 일정과 확실하게 연계되도록 하고 있습니다. 이러한 지출의 급증으로 인해 중소득 국가에서의 잠재 고객 기반이 확대되고, 장기 유지보수 계약을 통해 공급업체의 수익 전망이 안정화됩니다.
높은 도입 및 통합 비용
종합적인 도입에는 시설 1곳당 50만-200만 달러의 비용이 소요되며, 이는 IT 직원의 40%가 공석인 소규모 병원이나 지방 병원의 도입을 저해하는 장벽이 되고 있습니다. 레거시 시스템의 비일관성은 인터페이스 코딩 및 워크플로 재설계의 부담을 가중시켜, 많은 경우 일정을 예산 주기를 넘어 연장시키게 됩니다. 연간 유지보수비, 직원 교육비, 업그레이드 구독료가 계산에 포함되면 총 소유 비용은 더욱 부풀어 오릅니다. 환자 수가 적은 시설에서는 투자 회수 모델이 여전히 취약하여, 보조금이나 단계적 과금 방식을 채택한 SaaS 옵션으로의 전환을 촉진하고 있습니다. 모듈식 클라우드 호스팅 서비스를 저렴한 도입 가격으로 제공할 수 있는 벤더는 잠재적 수요를 자극하고, 연평균 성장률(CAGR) 둔화 요인에 대응할 수 있습니다.
부문별 분석
2025년에도 On-Premise 배포는 여전히 매출의 51.62%를 차지했으며, 데이터를 직접 관리하기 위한 사내 서버가 역사적으로 큰 영향력을 행사해 왔음을 보여줍니다. 그러나 견고한 재해 복구 기능, 자동 패치 적용, 탄력적인 스토리지와 같은 이점에 힘입어 클라우드 솔루션은 15.88%의 연평균 복합 성장률(CAGR)로 급성장하고 있습니다. 하이브리드 방식은 전환의 가교 역할을 하고 있습니다. 많은 시스템에서 지연 시간에 민감한 모듈은 On-Premise에 유지하면서, 분석 처리는 HIPAA 준수 클라우드로 이전하고 있습니다. 여러 거점을 보유한 체인 기업들은 캠퍼스 간 성능 지표를 동기화하고 중복 인프라를 줄여주는 클라우드 중심 대시보드를 중요하게 여기고 있습니다. 검증된 클라우드 구성을 On-Premise 환경과 동등하게 간주하는 FDA의 최근 지침은 CIO들의 우려를 더욱 완화시키고, SaaS 모델로의 전환을 촉진하고 있습니다. 하드웨어 업데이트를 미루어 절약된 비용은 대개 사이버 보안 업그레이드 자금으로 충당되어 전환 속도를 가속화하고 있습니다.
클라우드 벤더들은 연방 정부 및 학술 기관 고객을 확보하기 위해 FedRAMP 및 HITRUST 인증을 내세우며, 기존 On-Premise 벤더들이 누리던 선점 우위를 잠식하고 있습니다. 또한 랜섬웨어 위협이 증가함에 따라 오프사이트 백업이 필수화되었으며, 이는 많은 클라우드 계약에서 표준 기능으로 제공되고 있습니다. 한편, 유전체 데이터를 다루는 연구 기관에서는 계산 처리량을 극대화하기 위해 여전히 On-Premise 클러스터에 의존하고 있습니다. 그러나 이러한 분야에서도 컨테이너화된 워크로드를 통해 수요가 급증할 때 클라우드에서 버스트 용량을 확보할 수 있게 되었으며, 이로 인해 경계가 모호해지는 하이브리드 아키텍처가 주류를 이루는 미래를 예고하고 있습니다. 시간이 지남에 따라 서비스 기반 가격 책정으로 인해 벤더들의 초점은 영구 라이선스에서 AI 모듈 및 API 마켓플레이스를 풍부하게 갖춘 고객 유지에 중점을 둔 로드맵으로 이동하고 있으며, 이를 통해 생태계 참여가 수익화되고 있습니다.
2025년에는 응급실의 처리 능력 목표와 검사 결과의 신속한 제공 의무에 힘입어, 병원 및 중환자실이 여전히 46.15%라는 최대 점유율을 유지했습니다. 그럼에도 불구하고, 메디케어의 ‘재택 병원(Hospital-at-Home)’ 프로그램 확대와 고령화 사회 추세에 힘입어 재택치료 프로그램은 연평균 성장률(CAGR) 14.71%로 성장을 지속하고 있습니다. 휴대용 분석 기기 및 원격 의료 키트는 간병인이 환자의 자택에서 접근할 수 있는 경량 브라우저 기반 대시보드에 대한 수요를 높이고 있습니다. 진단센터에서는 급증하는 검체 처리량을 감당하기 위해 자동 검증 규칙을 통합하고 있는 반면, 진료소에서는 정액제 하에서 진료 주기를 단축하기 위해 POC(Point of Care) 데이터를 활용하고 있습니다.
재택치료 사업자들은 광대역 통신 품질의 불균형으로 어려움을 겪고 있으며, 연결이 복구되었을 때 데이터를 동기화하는 ‘스토어 앤 포워드(store-and-forward)’ 아키텍처에 대한 관심이 높아지고 있습니다. 병원에서는 품질 관리 편차를 감지하고, 시약 재고 데이터를 통합하여 공급망 효율을 높이는 전사적 미들웨어에 대한 투자를 지속하고 있습니다. 외래 진료소에서는 공유 서비스 모델이 채택되어, 일원화된 분석 기능을 라이선싱하면서도 현지의 의료기기 풀에 대한 자율성을 유지하고 있습니다. 장기 요양 및 산업 보건 현장을 아우르는 ‘기타’ 범주가 확대되면서, 병원 외부의 워크플로우에 맞춘 모듈식 UI 스킨에 대한 수요가 발생하고, 이에 따른 수익원이 확대되고 있습니다.
지역별 분석
북미는 2025년에도 38.21%의 점유율을 유지했으며, 그 기반이 되는 것은 NIH의 보조금, BARDA의 DRIVe 프로그램, 그리고 성숙한 EHR 보급률입니다. 미국의 병원들은 메디케어 어드밴티지의 품질 지표를 충족하기 위해 분석 도구를 도입하고 있는 반면, 캐나다 주 정부 시스템은 미들웨어의 상호 운용성에 의존하여 지방 지역에서의 접근성을 개선하는 데 자금을 투자하고 있습니다. 벤처 캐피탈의 유입과 예측 가능한 FDA 승인 절차 덕분에 이 지역은 AI를 광범위하게 활용하는 모듈의 시험장이 되어, 공급업체에 조기 피드백 루프를 제공합니다.
아시아태평양은 연평균 성장률(CAGR) 16.52%로 성장할 전망이며, 이는 세계에서 가장 빠른 속도입니다. 중국의 150억 달러 규모의 의료 디지털화 예산은 클라우드 호스팅형 대시보드 도입을 열망하는 현립 병원에 투입되고 있습니다. 인도의 ‘아유슈만 바라트 디지털 미션(Ayushman Bharat Digital Mission)’은 상호 운용성을 촉진하여 구매자들이 표준을 준수하는 소프트웨어를 채택하도록 유도하고 있습니다. 일본은 ‘Society 5.0’을 활용하여 재택 모니터링 키트와 중앙 집중식 분석을 결합한 고령자 돌봄 시범 사업을 지원하고 있습니다. 싱가포르는 지역적 거점 역할을 수행하며, 동남아시아 전역에 전문 지식을 수출하고 있습니다. 규제 환경의 다양성으로 인해 유연한 데이터 주권 설정 기능과 다국어 인터페이스를 갖춘 플랫폼이 우위를 점하고 있습니다.
유럽에서는 규제 주도의 꾸준한 확산이 관찰됩니다. 독일의 ‘디지털 의료법’은 병원의 IT 개편에 자금을 지원하고 있는 반면, 영국의 NHS 디지털 캠페인은 모든 급성기 의료 트러스트에 대해 공통된 상호운용성 기준으로의 전환을 추진하고 있습니다. 프랑스와 스페인은 원격의료 및 검사실 IT 현대화를 위해 EU의 부흥 기금을 활용하고 있습니다. 엄격한 GDPR(EU 개인정보보호규정)(일반 데이터 보호 규정) 규정에 따라 동의 관리 기능 및 암호화 기능이 표준으로 탑재되어야 하므로 도입 주기는 길어지지만 신뢰성은 높아집니다. 컴플라이언스 템플릿에 대한 사전 검증을 마친 공급업체는 입찰에서 우위를 점할 수 있습니다. 남미, 중동 및 아프리카는 시장 점유율 면에서는 뒤처져 있지만, 민관 협력에 의한 인프라 구축 과정에서 초기 단계부터 디지털 키트 도입이 의무화되어 있어 10% 중반대의 성장률을 기록하고 있습니다.
기타 혜택 :
- 엑셀 형식 시장 예측(ME) 시트
- 3개월간의 애널리스트 지원
자주 묻는 질문
목차
제1장 서론
제2장 분석 방법
제3장 주요 요약
제4장 시장 구도
제5장 시장 규모 및 성장률 예측
제6장 경쟁 구도
제7장 시장 기회 및 향후 전망
KTH 26.09.14According to Mordor Intelligence, the point-of-care data management software market size is expected to grow from USD 1.12 billion in 2025 to USD 1.27 billion in 2026 and is forecast to reach USD 2.43 billion by 2031 at 13.79% CAGR over 2026-2031.
This report is Segmented by Deployment Mode (Cloud-Based, On-Premise, and Hybrid), End User (Hospitals/Critical Care Units, Diagnostic Centers, Clinics/Outpatient, Home Healthcare, and More), Application (Infectious Disease Devices, Glucose Monitoring, and More), Component (Software Platform, and Services), and Geography. The Market Forecasts are Provided in Terms of Value (USD).
Global Point-of-Care Data Management Software Market Trends and Insights
Innovation in Flexible Connectivity and Interface Solutions
Health systems are demanding interoperable middleware that links more than 200 distinct point-of-care devices through standardized FHIR R4 APIs, a capability spurred by CMS's Interoperability and Patient Access Rule. Vendors now treat connectivity as core infrastructure, not add-on code, to avoid data silos and accelerate clinical decision-making. The arrival of 5G and edge-computing nodes cuts latency for cloud-native deployments, letting multi-site operators harmonize workflows across dispersed facilities. FDA's Digital Health Software Precertification Program further elevates connectivity by embedding it in regulatory review, creating an incentive for continuous performance monitoring. As a result, buyers prioritize middleware depth and future-proof interface roadmaps when awarding contracts.
Expansion of Healthcare Infrastructure Budgets
Governments spent USD 200 billion on health-infrastructure projects in 2024, earmarking sizable funds for digital platforms that include point-of-care data management software. Programs like India's National Digital Health Mission and China's Healthy China 2030 channel budget toward IT modernization, opening doors for vendors able to meet country-specific data-localization rules. Private-public partnerships often bundle software clauses into construction tenders, effectively converting optional tech into mandatory kit. As new hospitals and diagnostic centers go live, they specify analytics suites that feed value-based care dashboards, ensuring software procurement aligns with bricks-and-mortar schedules. This spends surge enlarges the addressable base in mid-income economies and smooths revenue visibility for suppliers through long-term maintenance deals.
High Deployment and Integration Costs
Comprehensive rollouts cost USD 500,000-USD 2 million per facility, a hurdle that stalls adoption in smaller or rural hospitals where 40% of IT posts sit vacant. Legacy-system heterogeneity inflates interface coding and workflow redesign, often stretching timelines past budget cycles. Total cost of ownership widens when annual maintenance, staff training, and upgrade subscriptions enter the calculus. For facilities with thin patient volumes, payback models remain weak, nudging them toward grant funding or SaaS options with phased billing. Vendors able to package modular, cloud-hosted offerings at lower entry prices can unlock pent-up demand and counter this drag on CAGR.
Other drivers and restraints analyzed in the detailed report include:
- Government Funding Initiatives for POC Testing
- Data Privacy and Cybersecurity Threats
For complete list of drivers and restraints, kindly check the Table Of Contents.
Segment Analysis
On-premises deployments still commanded 51.62% revenue in 2025, showing the historical sway of in-house servers for direct data custody. Yet cloud solutions are sprinting at a 15.88% CAGR, fuelled by robust disaster-recovery, auto-patching, and elastic storage benefits. A hybrid approach acts as a transition bridge: many systems keep latency-sensitive modules on-site while pushing analytics to HIPAA-compliant clouds. Multi-site chains prize cloud-centric dashboards that synchronize performance metrics across campuses, trimming duplicated infrastructure. FDA's recent guidance equating validated cloud configurations with local installations further eases CIO concerns, nudging purchase orders toward SaaS models. Savings from hardware refresh deferral often finance cybersecurity upgrades, accelerating the migration curve.
Cloud vendors tout FedRAMP and HITRUST credentials to win federal and academic accounts, denting the head-start enjoyed by legacy on-premises incumbents. Rising ransomware threats also make off-site backups imperative, a default feature in many cloud contracts. Conversely, research institutes handling genomic data still lean on local clusters to maximize compute throughput. Even here, containerized workloads permit burst capacity in the cloud during peak demand, showcasing a future where line-blurring hybrid architectures dominate. Over time, service-based pricing shifts vendor focus from perpetual licenses to retention-driven roadmaps rich in AI modules and API marketplaces that monetize ecosystem participation.
Hospitals and critical-care units retained the lion's 46.15% share in 2025, supported by emergency-department throughput targets and lab turnaround mandates. Nevertheless, home-health programs are clocking a 14.71% CAGR, buoyed by Medicare's Hospital-at-Home expansion and aging-population dynamics. Portable analyzers and telehealth kits feed a need for lightweight, browser-based dashboards that caregiver's access from patient residences. Diagnostic centers integrate auto-verification rules to handle ballooning specimen loads while clinics lean on point-of-care data to shorten visit cycles under capitated payment plans.
Home-care operators grapple with variable broadband quality, propelling interest in store-and-forward architecture that syncs when connectivity resumes. Hospitals continue to invest in enterprise-wide middleware that flags quality-control drifts and consolidates reagent inventory data, improving supply chain efficiency. Outpatient clinics adopt shared-service models, licensing centralized analytics but maintaining autonomy over local device pools. The growing "other" category spanning long-term care and occupational-health sites creates opportunities for modular UI skins tailored to non-hospital workflows, widening addressable revenue.
Complete Report Scope:
- By Deployment Mode
- Cloud-Based
- On-Premise
- Hybrid
- By End User
- Hospitals / Critical Care Units
- Diagnostic Centers
- Clinics / Outpatient
- Home Healthcare
- Other End Users
- By Application
- Infectious Disease Devices
- Glucose Monitoring
- Coagulation Monitoring
- Urinalysis
- Cardiometabolic Monitoring
- Cancer Markers
- Hematology
- Other POC Applications
- By Component
- Software Platform
- Middleware
- Services
- By Geography
- North America
- United States
- Canada
- Mexico
- Europe
- United Kingdom
- Germany
- France
- Italy
- Rest of Europe
- Asia-Pacific
- China
- Japan
- India
- South Korea
- Rest of Asia
- Middle East
- Israel
- Saudi Arabia
- United Arab Emirates
- Turkey
- Rest of Middle East
- Africa
- South Africa
- Egypt
- Rest of Africa
- South America
- Brazil
- Argentina
- Rest of South America
- North America
Geography Analysis
North America maintained a 38.21% share in 2025, anchored by NIH grants, BARDA's DRIVe program, and mature EHR penetration. U.S. hospitals deploy analytics to satisfy Medicare Advantage quality metrics, whereas Canada's provincial systems fund rural-access upgrades that hinge on middleware interoperability. Venture capital flows and predictable FDA pathways make the region a test bed for AI-rich modules, giving suppliers early feedback loops.
Asia Pacific is set to compound at 16.52% CAGR, the fastest worldwide. China's USD 15 billion health-digitization budget funnels into county-level hospitals eager for cloud-hosted dashboards. India's Ayushman Bharat Digital Mission enforces interoperability, nudging buyers toward standards-compliant software. Japan leverages Society 5.0 to back aging-care pilots that marry home-monitoring kits with centralized analytics. Singapore acts as the regional deployment hub, exporting expertise across Southeast Asia. The mosaic of regulations rewards platforms sporting flexible data-sovereignty toggles and multilingual interfaces.
Europe exhibits steady, regulation-driven uptake. Germany's Digital Healthcare Act finances hospital IT overhauls, while the United Kingdom's NHS Digital campaign pushes all acute trusts onto a shared interoperability standard. France and Spain tap EU Recovery funds for telemedicine and lab IT modernization. Strict GDPR rules require baked-in consent management and encryption, extending deployment cycles but enhancing trust. Suppliers that pre-validate compliance templates gain bidding advantages. South America, the Middle East, and Africa trail in share but post mid-teens growth as public-private buildouts stipulates digital kits from the outset.
- Siemens Healthineers AG (Conworx)
- Abbott Point of Care Inc. (Alere Inc.)
- Danaher Corporation (HemoCue AB and Radiometer Medical ApS)
- F. Hoffmann-La Roche Ltd
- TELCOR Inc.
- Orchard Software Corporation
- Randox Laboratories Ltd
- Thermo Fisher Scientific Inc.
- EKF Diagnostics Holdings plc
- HORIBA Ltd
- Nova Biomedical Corporation
- Sysmex Corporation
- Werfen S.A.
- Alcor Scientific Inc.
- PTS Diagnostics LLC
- Masimo Corporation
- Becton, Dickinson and Company
- Beckman Coulter Inc.
- Medtronic plc
Additional Benefits:
- The market estimate (ME) sheet in Excel format
- 3 months of analyst support
TABLE OF CONTENTS
1 INTRODUCTION
- 1.1 Study Assumptions and Market Definition
- 1.2 Scope of the Study
2 RESEARCH METHODOLOGY
3 EXECUTIVE SUMMARY
4 MARKET LANDSCAPE
- 4.1 Market Overview
- 4.2 Market Drivers
- 4.2.1 Innovation in Flexible Connectivity and Interface Solutions
- 4.2.2 Expansion of Healthcare Infrastructure Budgets
- 4.2.3 Government Funding Initiatives for POC Testing
- 4.2.4 Payor Shift Toward Outcome-Based Reimbursement
- 4.2.5 AI-Driven Analytics Modules for Antimicrobial Stewardship
- 4.2.6 Growing Cybersecurity Compliance Requirements
- 4.3 Market Restraints
- 4.3.1 High Deployment and Integration Costs
- 4.3.2 Data Privacy and Cybersecurity Threats
- 4.3.3 Fragmented Legacy Device Firmware Ecosystem
- 4.3.4 Shortage of Skilled IT Staff in Rural Facilities
- 4.4 Impact of Macroeconomic Factors
- 4.5 Industry Value-Chain Analysis
- 4.6 Regulatory Landscape
- 4.7 Technological Outlook
- 4.8 Porter's Five Forces Analysis
- 4.8.1 Bargaining Power of Suppliers
- 4.8.2 Bargaining Power of Buyers
- 4.8.3 Threat of New Entrants
- 4.8.4 Threat of Substitutes
- 4.8.5 Intensity of Competitive Rivalry
5 MARKET SIZE AND GROWTH FORECASTS (VALUE)
- 5.1 By Deployment Mode
- 5.1.1 Cloud-Based
- 5.1.2 On-Premise
- 5.1.3 Hybrid
- 5.2 By End User
- 5.2.1 Hospitals / Critical Care Units
- 5.2.2 Diagnostic Centers
- 5.2.3 Clinics / Outpatient
- 5.2.4 Home Healthcare
- 5.2.5 Other End Users
- 5.3 By Application
- 5.3.1 Infectious Disease Devices
- 5.3.2 Glucose Monitoring
- 5.3.3 Coagulation Monitoring
- 5.3.4 Urinalysis
- 5.3.5 Cardiometabolic Monitoring
- 5.3.6 Cancer Markers
- 5.3.7 Hematology
- 5.3.8 Other POC Applications
- 5.4 By Component
- 5.4.1 Software Platform
- 5.4.2 Middleware
- 5.4.3 Services
- 5.5 By Geography
- 5.5.1 North America
- 5.5.1.1 United States
- 5.5.1.2 Canada
- 5.5.1.3 Mexico
- 5.5.2 Europe
- 5.5.2.1 United Kingdom
- 5.5.2.2 Germany
- 5.5.2.3 France
- 5.5.2.4 Italy
- 5.5.2.5 Rest of Europe
- 5.5.3 Asia-Pacific
- 5.5.3.1 China
- 5.5.3.2 Japan
- 5.5.3.3 India
- 5.5.3.4 South Korea
- 5.5.3.5 Rest of Asia
- 5.5.4 Middle East
- 5.5.4.1 Israel
- 5.5.4.2 Saudi Arabia
- 5.5.4.3 United Arab Emirates
- 5.5.4.4 Turkey
- 5.5.4.5 Rest of Middle East
- 5.5.5 Africa
- 5.5.5.1 South Africa
- 5.5.5.2 Egypt
- 5.5.5.3 Rest of Africa
- 5.5.6 South America
- 5.5.6.1 Brazil
- 5.5.6.2 Argentina
- 5.5.6.3 Rest of South America
- 5.5.1 North America
6 COMPETITIVE LANDSCAPE
- 6.1 Market Concentration
- 6.2 Strategic Moves
- 6.3 Market Share Analysis
- 6.4 Company Profiles {(includes Global level Overview, Market level overview, Core Segments, Financials as available, Strategic Information, Market Rank / Share for key companies, Products and Services, and Recent Developments)}
- 6.4.1 Siemens Healthineers AG (Conworx)
- 6.4.2 Abbott Point of Care Inc. (Alere Inc.)
- 6.4.3 Danaher Corporation (HemoCue AB and Radiometer Medical ApS)
- 6.4.4 F. Hoffmann-La Roche Ltd
- 6.4.5 TELCOR Inc.
- 6.4.6 Orchard Software Corporation
- 6.4.7 Randox Laboratories Ltd
- 6.4.8 Thermo Fisher Scientific Inc.
- 6.4.9 EKF Diagnostics Holdings plc
- 6.4.10 HORIBA Ltd
- 6.4.11 Nova Biomedical Corporation
- 6.4.12 Sysmex Corporation
- 6.4.13 Werfen S.A.
- 6.4.14 Alcor Scientific Inc.
- 6.4.15 PTS Diagnostics LLC
- 6.4.16 Masimo Corporation
- 6.4.17 Becton, Dickinson and Company
- 6.4.18 Beckman Coulter Inc.
- 6.4.19 Medtronic plc
7 MARKET OPPORTUNITIES AND FUTURE OUTLOOK
- 7.1 White-Space and Unmet-Need Assessment