|
시장보고서
상품코드
2124551
데이터 카달로그 : 시장 점유율 분석, 업계 동향과 통계, 성장 예측(2026-2031년)Data Catalog - Market Share Analysis, Industry Trends & Statistics, Growth Forecasts (2026 - 2031) |
||||||
 Mordor Intelligence
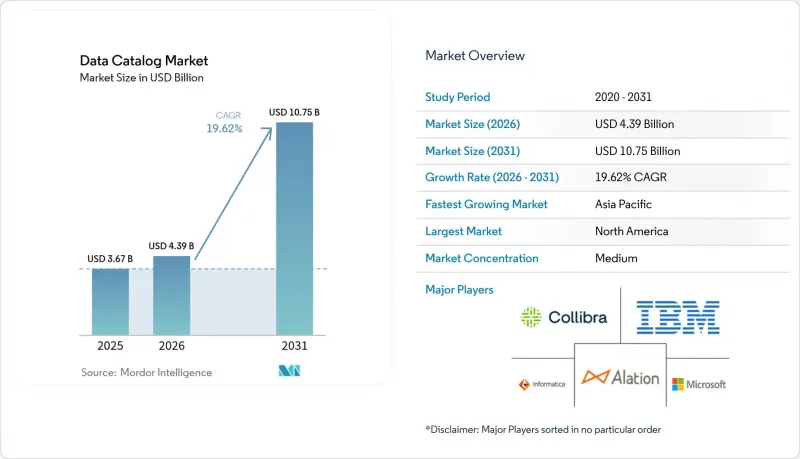
Mordor Intelligence에 의하면, 데이터 카달로그 시장 규모는 2025년 36억 7,000만 달러에서 2026년에는 43억 9,000만 달러에 이르고, 2026-2031년 CAGR 19.62%로 성장을 지속하여 2031년에는 107억 5,000만 달러에 달할 것으로 예측됩니다.
본 보고서는 구성 요소(솔루션 및 서비스), 도입 형태(클라우드 및 On-Premise), 최종 사용자 산업(은행, 금융서비스 및 보험(BFSI), 소매 및 전자상거래, 헬스케어 등), 조직 규모(대기업 및 중소기업), 지역별로 분류되어 있습니다. 시장 예측은 금액(달러) 기준으로 제시되어 있습니다.
세계 데이터 카탈로그 시장 동향 및 인사이트
클라우드 기반 카탈로그 도입 급증
현재 도입 사례의 81.2%가 클라우드 배포를 기반으로 하고 있으며, 이를 통해 인프라 오버헤드가 절감되고 도입 기간이 수개월에서 수일로 단축되고 있습니다. 분산된 인력은 거버넌스가 적용된 데이터에 일관되게 접근하기 위해 클라우드 카탈로그에 의존하고 있으며, 2025년 1월 Microsoft Purview가 도입한 사용량 기반 요금 체계를 통해 비용이 자산 규모에 상응하는 수준으로 조정되고 있습니다. 또한 클라우드 생태계는 통합을 간소화하여, 기업이 통일된 정책을 적용하면서 다양한 데이터 저장소를 연결할 수 있게 해줍니다. 분석 워크로드가 대규모로 퍼블릭 클라우드로 이전됨에 따라 클라우드 네이티브 카탈로그에 대한 수요는 계속 증가할 것이며, 이는 탄력성, 보안 및 크로스 플랫폼 데이터 계보에 관한 벤더의 혁신을 촉진할 것입니다.
데이터 양의 폭발적 증가와 복잡화
2025년까지 비정형 정보가 전 세계 데이터의 80%를 차지할 것으로 예상에 따라, 조직은 수동 태그 지정에서 자동 감지로 전환할 수밖에 없게 되었습니다. 데이터 레이크는 다양한 컨텐츠를 수집하지만, 카탈로그가 없다면 사용자는 신뢰할 수 있는 자산을 찾느라 어려움을 겪게 됩니다. 효과적인 검색을 통해 인사이트 확보까지 걸리는 시간을 최대 40% 단축하고, 고객 용도의 전환율을 향상시킬 수 있습니다. 의료 서비스 제공업체들은 IQVIA Health Data Catalog와 같은 솔루션을 도입하여 단일 포털을 통해 3,700개 이상의 자산을 프로파일링하고 있습니다. 데이터의 다양성과 속도가 가속화되는 가운데, 구조화 및 비구조화 소스를 아우르는 카탈로그는 전략적 차별화 요소가 됩니다.
표준화 및 보안 과제
일관성 없는 메타데이터 모델은 상호 운용성을 저해합니다. 특히 의료 분야에서는 임상 용어의 차이가 오해를 불러일으키는 원인이 됩니다. 생물 의학 프로젝트에서는 DATS와 같은 프레임워크를 채택하여 다양한 데이터 세트를 인코딩하고 있지만, 여전히 데이터의 파편화가 남아 있습니다. 또한 데이터 소스마다 보안 계층이 다르기 때문에 카탈로그를 통해 통일된 접근을 강제하기 어렵습니다. 아시아태평양의 규제적 차이는 데이터의 분절화를 초래하여 국경을 초월한 분석을 지연시킬 위험이 있습니다.
부문 분석
2025년 매출 중 솔루션이 71.78%를 차지하며, 엔터프라이즈 디스커버리 및 거버넌스의 기반으로서의 역할이 입증되었습니다. 각 벤더는 현재 이기종 데이터 스토어를 스캔하는 단일 인터페이스를 통해 자동화된 데이터 계보, AI를 활용한 데이터 보강, 그리고 세밀한 정책 적용을 제공합니다. 이러한 기능을 통해 솔루션은 현대화 프로그램의 첫걸음으로 자리매김하며, 보다 광범위한 데이터 인텔리전스 전략의 기반이 되고 있습니다. 동시에, 기업들이 운영 모델, 정책 설계, 변경 관리에 대한 지침을 모색함에 따라 서비스 부문은 연평균 성장률(CAGR) 24.96%로 확대되고 있습니다. 많은 프로젝트에서 세계 기준을 유지하면서 책임 소재를 분산시키는 연합형 거버넌스 구조가 구축되고 있습니다.
두 부문 모두에서 기업들은 긴밀한 통합을 우선시하고 있습니다. Microsoft Purview의 참조 아키텍처는 스캔 설정 전에 거버넌스 도메인을 정의할 것을 권장하며, 성공에 필요한 프로세스의 성숙도를 강조하고 있습니다. 서비스 제공업체는 모범 사례를 체계화한 액셀러레이터를 구축하여 첫 도입 시의 위험을 줄이고 있습니다. 솔루션이 플랫폼으로 진화하고, 벤더가 여기에 자문 서비스 및 관리형 서비스를 통합함에 따라 제품 및 서비스 간의 기존 경계는 모호해지고 있습니다. 이러한 융합은 조직이 측정 가능한 가치를 확실히 창출하는 동시에 신속한 도입을 지원하며, 데이터 카탈로그 시장의 장기적인 성장세를 유지하고 있습니다.
클라우드는 2025년에 80.55%의 점유율을 차지하고 연평균 성장률(CAGR) 23.85%로 상승할 것으로 예측됩니다. 이는 탄력적인 확장성과 신속한 프로비저닝이라는 이점을 반영한 것입니다. 사용량 기반 과금 모델을 통해 팀은 소규모로 시작하여 자산 수가 늘어남에 따라 확장할 수 있으며, 지출을 창출되는 가치에 맞출 수 있습니다. 2025년에 도입된 마이크로소프트의 종량제 요금제는 이러한 변화를 상징하며, 거버넌스 대상인 고유 자산과 품질 지표에 대해서만 요금이 부과됩니다. 또한, 클라우드 도입을 통해 기능의 자동 업데이트가 실현되어 혁신 주기가 단축될 뿐만 아니라, AI를 활용한 기능 강화에 대한 즉각적인 접근이 보장됩니다.
클라우드의 성장세에도 불구하고, 엄격한 데이터 상주 요건이나 레거시 메인프레임 워크로드가 존재하는 산업에서는 On-Premise 솔루션이 여전히 중요하게 여겨집니다. 이러한 조직에서는 기밀성이 높은 데이터를 현장에서 스캔하는 동시에 메타데이터를 안전한 클라우드 허브에 일원화하는 하이브리드형 접근 방식이 점점 더 선호되고 있습니다. 각 벤더사는 위치에 관계없이 일관된 정책을 적용하는 프라이빗 링크 연결 및 역할 기반 접근 제어를 통해 이러한 요구에 대응하고 있습니다. 이러한 민첩성과 데이터 주권의 균형이 다양한 도입 환경을 유지하고, 데이터 카탈로그 시장의 잠재적 수요를 확대시키고 있습니다.
지역별 분석
북미는 성숙한 클라우드 인프라, 선진적인 AI 도입, 그리고 엄격한 업계 규제의 뒷받침을 받아 2025년에 41.62%의 점유율을 유지하며 리더십을 지켰습니다. 미국 기업들은 생성형 모델을 카탈로그에 통합하여 프로파일링을 자동화하고 데이터 계보를 개선함으로써, 데이터 실무자의 46%가 보고한 품질 관련 우려 사항을 해결하고 있습니다. 캐나다에서는 금융 서비스 및 헬스케어 분야에서 유사한 추세가 나타나고 있는 반면, 멕시코에서는 급성장 중인 핀테크 부문이 새로운 도입을 주도하고 있습니다. 이 지역의 구매자들은 고급 규정 준수 도구와 개방형 연결성을 결합한 솔루션을 선호하며, 이러한 추세는 공급업체의 로드맵 수립에 계속해서 영향을 미치고 있습니다.
아시아태평양은 가장 빠르게 확장되고 있는 시장으로, 2031년까지 연평균 성장률(CAGR) 23.62%를 기록할 전망입니다. 중국, 인도, 일본이 AI 투자 순위 상위권을 차지하며 견고한 데이터 인프라에 대한 지출 증가를 촉진하고 있습니다. 각국 정부는 개인정보 보호 및 주권 관련 규제를 강화하고 있어, 저장 중 및 전송 중인 개인 데이터를 식별, 분류, 토큰화하는 도구에 대한 수요를 견인하고 있습니다. 정책 환경의 파편화나 숙련된 인력 공급 격차와 같은 과제가 대두되고 있지만, 유연한 아키텍처와 관리형 서비스가 기업의 대응을 뒷받침하고 있습니다. 현지 도입에 있어서는 전 세계의 모범 사례와 각국 고유의 암호화 및 데이터 거주지 규제를 융합하는 경향이 강해지고 있습니다.
유럽에서는 GDPR(EU 개인정보보호규정)을 준수하는 거버넌스를 배경으로 시장이 확대되고 있습니다. 데이터 카탈로그는 기밀 필드 감지 및 데이터 계보 기록을 자동화하여, 기업이 끊임없이 변화하는 AI 규제 하에서 설명 책임을 다할 수 있도록 지원합니다. 독일과 프랑스의 각 산업 분야에서는 지속가능성 보고를 위해 카탈로그의 적용 범위를 공급망 데이터까지 확대되고 있습니다. 중동 및 아프리카에서는 도입 기반이 작음에도 불구하고, 클라우드를 활용하여 레거시 시스템의 제약을 우회함으로써 도입이 가속화되고 있습니다. 남미, 특히 브라질의 디지털 이니셔티브에서는 카탈로그의 적용 범위가 전자상거래 및 에너지 자산까지 확대되고 있습니다. 각 지역에서 공통적으로 나타나는 것은 운영 보고와 AI 혁신을 모두 뒷받침하는 투명성이 높고 정책 주도형 접근에 대한 요구이며, 이것이 전 세계적으로 데이터 카탈로그 시장 규모를 확대시키고 있습니다.
기타 혜택:
- 엑셀 형식 시장 예측(ME) 시트
- 3개월간의 애널리스트 지원
자주 묻는 질문
목차
제1장 서론
제2장 조사 방법
제3장 주요 요약
제4장 시장 구도
제5장 시장 규모와 성장 예측
제6장 경쟁 구도
제7장 투자 분석
제8장 시장 기회와 향후 동향
LSH 26.09.14According to Mordor Intelligence, the data catalog market size is expected to grow from USD 3.67 billion in 2025 to USD 4.39 billion in 2026 and is forecast to reach USD 10.75 billion by 2031 at 19.62% CAGR over 2026-2031.
This report is Segmented by Component (Solutions and Services), Deployment Mode (Cloud and On-Premise), End-User Industry (BFSI, Retail and E-Commerce, Healthcare, and More), Organization Size (Large Enterprises and Small and Mid-Size Enterprises), and Geography. The Market Forecasts are Provided in Terms of Value (USD).
Global Data Catalog Market Trends and Insights
Cloud-based catalog adoption surge
Cloud deployment now underpins 81.2% of implementations, reducing infrastructure overhead and speeding roll-outs to days instead of months. Distributed workforces rely on cloud catalogs for consistent access to governed data, and usage-based pricing introduced by Microsoft Purview in January 2025 aligns costs to asset volume. Cloud ecosystems also simplify integrations, allowing enterprises to connect diverse data stores while applying uniform policies. As analytics workloads migrate to public clouds at scale, demand for cloud-native catalogs will keep rising, fueling vendor innovation around elasticity, security, and cross-platform lineage.
Data-volume explosion and complexity
By 2025, unstructured information is projected to account for 80% of global data, forcing organizations to move beyond manual tagging toward automated discovery. Data lakes capture varied content, yet without a catalog, users struggle to locate reliable assets. Effective discovery cuts time-to-insight by up to 40% and improves conversion in customer applications. Healthcare providers deploy solutions such as IQVIA Health Data Catalog to profile more than 3,700 assets through a single portal. As variety and velocity accelerate, catalogs able to span structured and unstructured sources become strategic differentiators.
Standardization and security gaps
Inconsistent metadata models hamper interoperability, especially in healthcare, where differing clinical vocabularies lead to misinterpretation. Biomedical projects adopt frameworks such as DATS to encode diverse datasets, yet fragmentation persists. Security layers also vary across data sources, making it hard to enforce unified access through the catalog. Regional divergence in Asia-Pacific regulations risks data balkanization that could slow cross-border analytics.
Other drivers and restraints analyzed in the detailed report include:
- Regulatory compliance mandates
- Generative-AI metadata enrichment
- Talent shortage in metadata management
For complete list of drivers and restraints, kindly check the Table Of Contents.
Segment Analysis
Solutions accounted for 71.78% of 2025 revenue, confirming their role as the backbone of enterprise discovery and governance. Vendors now deliver automated lineage, AI-assisted enrichment, and granular policy enforcement through single interfaces that scan heterogeneous stores. This functionality positions solutions as the first stop in modernization programs, anchoring broader data intelligence strategies. At the same time, the services segment is expanding at 24.96% CAGR as enterprises seek guidance on operating models, policy design, and change management. Many engagements develop federated governance structures that distribute accountability while retaining global standards.
Across both segments, enterprises prioritize tight integration. Microsoft Purview's reference architecture encourages the definition of governance domains before scan configuration, highlighting the process maturity required for success. Service providers craft accelerators that codify best practices, reducing risk for first-time deployments. As solutions evolve into platforms and vendors wrap advisory and managed services around them, the traditional boundary between product and service blurs. This blend supports rapid adoption while ensuring organizations extract measurable value, sustaining long-term momentum for the data catalog market.
Cloud captured 80.55% share in 2025 and is forecast to rise at 23.85% CAGR, reflecting advantages in elastic scale and rapid provisioning. Consumption models let teams start small and expand as asset counts grow, aligning spend to value delivered. Microsoft's pay-as-you-go tariff, adopted in 2025, exemplifies this shift, charging only for unique governed assets and quality metrics. Cloud deployment also delivers automatic feature updates, shortening innovation cycles and ensuring immediate access to AI-driven enhancements.
Despite cloud momentum, on-premise catalogs remain important in sectors with strict data residency or legacy mainframe workloads. These organizations increasingly favor hybrid patterns, scanning sensitive stores in place while centralizing metadata in a secure cloud hub. Vendors respond with private-link connectivity and role-based access controls that enforce consistent policy regardless of location. This balance between agility and sovereignty sustains a diversified deployment landscape and broadens addressable demand for the data catalog market.
Complete Report Scope:
- By Component
- Solutions
- Services
- By Deployment Mode
- Cloud
- On-Premise
- By End-user Industry
- BFSI
- Retail and E-commerce
- Healthcare
- Manufacturing
- Telecommunications
- Other End-user Industries
- By Organization Size
- Large Enterprises
- Small and Mid-size Enterprises
- By Geography
- North America
- United States
- Canada
- Mexico
- South America
- Brazil
- Argentina
- Chile
- Rest of South America
- Europe
- Germany
- United Kingdom
- France
- Italy
- Spain
- Russia
- Rest of Europe
- Asia-Pacific
- China
- Japan
- India
- South Korea
- Singapore
- Malaysia
- Australia
- Rest of Asia-Pacific
- Middle East and Africa
- Middle East
- Saudi Arabia
- United Arab Emirates
- Turkey
- Rest of Middle East
- Africa
- South Africa
- Nigeria
- Rest of Africa
- Middle East
- North America
Geography Analysis
North America retained leadership with a 41.62% share in 2025, supported by mature cloud infrastructure, advanced AI adoption, and stringent industry regulations. Enterprises in the United States integrate generative models into catalogs to automate profiling and improve lineage, addressing quality concerns reported by 46% of data practitioners. Canada follows similar trajectories in financial services and healthcare, while Mexico's fast-growing fintech sector spurs new deployments. Regional buyers favor solutions that pair deep compliance tooling with open connectivity, a profile that continues to shape vendor roadmaps.
Asia-Pacific is the fastest-expanding arena, growing at 23.62% CAGR through 2031. China, India, and Japan top AI investment rankings, prompting higher spending on robust data foundations. Governments tighten privacy and sovereignty rules, driving demand for tools that locate, classify, and tokenize personal data at rest and in motion. Challenges arise from fragmented policy landscapes and uneven skill availability, yet flexible architectures and managed services help enterprises keep pace. Local deployments increasingly blend global best practices with country-specific encryption and residency controls.
Europe advances on the back of GDPR-aligned governance. Data catalogs automate the detection of sensitive fields and record data lineage, letting firms demonstrate accountability under evolving AI rules. Industries in Germany and France extend catalog scope to supply-chain data for sustainability reporting. The Middle East and Africa see accelerated uptake from a small base, leveraging cloud to bypass legacy constraints. South America's digital initiatives, particularly in Brazil, extend catalog coverage to e-commerce and energy assets. Across regions, the common thread remains a need for transparent, policy-driven access that underpins both operational reporting and AI innovation, widening the data catalog market size globally.
- Collibra NV
- IBM Corporation
- Microsoft Corporation
- Informatica Inc.
- Alation Inc.
- Amazon Web Services, Inc.
- Google LLC
- Oracle Corporation
- SAP SE
- TIBCO Software Inc.
- Atlan Pte Ltd.
- data.world, Inc.
- Zaloni, Inc.
- Hitachi Vantara LLC
- Talend (Snowflake)
- MANTA Software
- DataGalaxy SAS
- Alex Solutions
- Precisely Holdings
- Cloudera (Apache Atlas)
- Erwin Data Intelligence
- Databricks Unity Catalog
- Elastic (Elastic Search Data Catalog)
- OpenMetadata (LF AI & Data)
- Micro Focus Voltage
Additional Benefits:
- The market estimate (ME) sheet in Excel format
- 3 months of analyst support
TABLE OF CONTENTS
1 INTRODUCTION
- 1.1 Study Assumptions and Market Definition
- 1.2 Scope of the Study
2 RESEARCH METHODOLOGY
3 EXECUTIVE SUMMARY
4 MARKET LANDSCAPE
- 4.1 Market Overview
- 4.2 Market Drivers
- 4.2.1 Cloud-based catalog adoption surge
- 4.2.2 Data-volume explosion and complexity
- 4.2.3 Regulatory compliance mandates
- 4.2.4 Generative-AI metadata enrichment
- 4.2.5 Data-mesh architecture proliferation
- 4.2.6 Open-source metadata standards
- 4.3 Market Restraints
- 4.3.1 Standardization and security gaps
- 4.3.2 Talent shortage in metadata mgmt
- 4.3.3 Catalog curation cost burden
- 4.3.4 Vendor lock-in via proprietary models
- 4.4 Industry Value Chain Analysis
- 4.5 Regulatory Landscape
- 4.6 Technological Outlook
- 4.7 Industry Attractiveness - Porter's Five Forces Analysis
- 4.7.1 Bargaining Power of Buyers/Consumers
- 4.7.2 Bargaining Power of Suppliers
- 4.7.3 Threat of New Entrants
- 4.7.4 Threat of Substitute Products
- 4.7.5 Intensity of Competitive Rivalry
- 4.8 Impact of Macroeconomic Factors on the Market
5 MARKET SIZE AND GROWTH FORECASTS (VALUES)
- 5.1 By Component
- 5.1.1 Solutions
- 5.1.2 Services
- 5.2 By Deployment Mode
- 5.2.1 Cloud
- 5.2.2 On-Premise
- 5.3 By End-user Industry
- 5.3.1 BFSI
- 5.3.2 Retail and E-commerce
- 5.3.3 Healthcare
- 5.3.4 Manufacturing
- 5.3.5 Telecommunications
- 5.3.6 Other End-user Industries
- 5.4 By Organization Size
- 5.4.1 Large Enterprises
- 5.4.2 Small and Mid-size Enterprises
- 5.5 By Geography
- 5.5.1 North America
- 5.5.1.1 United States
- 5.5.1.2 Canada
- 5.5.1.3 Mexico
- 5.5.2 South America
- 5.5.2.1 Brazil
- 5.5.2.2 Argentina
- 5.5.2.3 Chile
- 5.5.2.4 Rest of South America
- 5.5.3 Europe
- 5.5.3.1 Germany
- 5.5.3.2 United Kingdom
- 5.5.3.3 France
- 5.5.3.4 Italy
- 5.5.3.5 Spain
- 5.5.3.6 Russia
- 5.5.3.7 Rest of Europe
- 5.5.4 Asia-Pacific
- 5.5.4.1 China
- 5.5.4.2 Japan
- 5.5.4.3 India
- 5.5.4.4 South Korea
- 5.5.4.5 Singapore
- 5.5.4.6 Malaysia
- 5.5.4.7 Australia
- 5.5.4.8 Rest of Asia-Pacific
- 5.5.5 Middle East and Africa
- 5.5.5.1 Middle East
- 5.5.5.1.1 Saudi Arabia
- 5.5.5.1.2 United Arab Emirates
- 5.5.5.1.3 Turkey
- 5.5.5.1.4 Rest of Middle East
- 5.5.5.2 Africa
- 5.5.5.2.1 South Africa
- 5.5.5.2.2 Nigeria
- 5.5.5.2.3 Rest of Africa
- 5.5.5.1 Middle East
- 5.5.1 North America
6 COMPETITIVE LANDSCAPE
- 6.1 Market Concentration
- 6.2 Strategic Moves
- 6.3 Market Share Analysis
- 6.4 Company Profiles (includes Global level Overview, Market level overview, Core Segments, Financials as available, Strategic Information, Market Rank/Share for key companies, Products and Services, and Recent Developments)
- 6.4.1 Collibra NV
- 6.4.2 IBM Corporation
- 6.4.3 Microsoft Corporation
- 6.4.4 Informatica Inc.
- 6.4.5 Alation Inc.
- 6.4.6 Amazon Web Services, Inc.
- 6.4.7 Google LLC
- 6.4.8 Oracle Corporation
- 6.4.9 SAP SE
- 6.4.10 TIBCO Software Inc.
- 6.4.11 Atlan Pte Ltd.
- 6.4.12 data.world, Inc.
- 6.4.13 Zaloni, Inc.
- 6.4.14 Hitachi Vantara LLC
- 6.4.15 Talend (Snowflake)
- 6.4.16 MANTA Software
- 6.4.17 DataGalaxy SAS
- 6.4.18 Alex Solutions
- 6.4.19 Precisely Holdings
- 6.4.20 Cloudera (Apache Atlas)
- 6.4.21 Erwin Data Intelligence
- 6.4.22 Databricks Unity Catalog
- 6.4.23 Elastic (Elastic Search Data Catalog)
- 6.4.24 OpenMetadata (LF AI & Data)
- 6.4.25 Micro Focus Voltage
7 INVESTMENT ANALYSIS
8 MARKET OPPORTUNITIES AND FUTURE TRENDS
- 8.1 White-Space and Unmet-Need Assessment