

|
시장보고서
상품코드
2124581
5G 기술 : 시장 점유율 분석, 업계 동향과 통계, 성장 예측(2026-2031년)5G Technology - Market Share Analysis, Industry Trends & Statistics, Growth Forecasts (2026 - 2031) |
||||||
 Mordor Intelligence
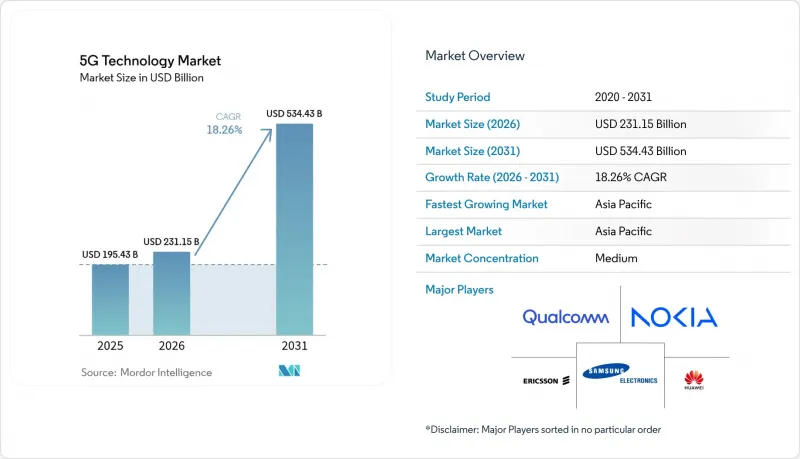
Mordor Intelligence에 의하면, 5G 기술 시장 규모는 2025년 1,954억 3,000만 달러에서 2026년에는 2,311억 5,000만 달러에 이르고, 2026-2031년 CAGR 18.26%로 성장을 지속하여 2031년에는 5,344억 3,000만 달러에 달할 것으로 예측됩니다.
본 보고서는 구성 요소(하드웨어, 소프트웨어, 서비스), 주파수 대역(Sub-6GHz, mm파, 하이브리드),용도(eMBB, FWA, MMTC, URLLC), 최종 사용자 산업(소비자, 제조업 등), 네트워크 아키텍처(스탠드얼론, 논스탠드얼론), 지역별로 분류되어 있습니다. 시장 예측은 금액(달러) 기준으로 제시되어 있습니다.
전 세계 5G 기술 시장 동향 및 인사이트
연결 기기의 지속적인 증가
셀룰러 IoT 연결 건수는 2030년까지 59억 건을 넘어설 것으로 예측되며, 이에 따라 공중 네트워크 및 사설 네트워크에 대한 용량 요구 사항이 더욱 높아지고 있습니다. 제조 공장에서는 예측 유지보수 및 자동 검사가 확대되고 있는 반면, 스마트 시티의 교통·환경 센서로 인해 데이터 흐름이 증가하고 있습니다. 엣지 컴퓨팅은 시간적 제약이 있는 분석을 로컬에 캐싱함으로써 백홀의 부하를 경감하고 지연을 줄입니다. 확정적인 성능과 본질적인 보안이 필수적인 위험 시설 내에서는 사설 네트워크가 Wi-Fi를 대체하고 있습니다. 이러한 기기의 급증은 데이터 트래픽의 복합적인 증가를 초래하며, 5G 기술 시장의 무선, 전송, 클라우드 각 분야에서 지속적인 지출을 뒷받침하고 있습니다.
RF 프런트엔드 및 SiGe 전력 증폭기의 부품 수준 비용 절감
실리콘-게르마늄(SiGe) 파워 앰프의 기술 혁신으로 2024년 이후 제조 비용이 30% 가까이 절감되어, 중급형 5G 스마트폰 및 CPE의 가격 인하로 이어지고 있습니다. 첨단 멀티칩 패키징을 통해 필터, LNA, 스위치가 통합되어 수율이 향상되고 기판의 실적가 축소되고 있습니다. 갈륨 비소 계열 대체품이 CMOS 공정으로 전환됨에 따라, Sub-6GHz 무선 유닛은 신흥 시장의 통신 사업자들에게 성능과 합리적인 가격의 균형을 실현하고 있습니다. 단일 공급업체의 파운드리에만 의존하지 않는 공급망의 다각화로 인해 경쟁 입찰이 촉진되고, 자본 지출(CAPEX)이 더욱 절감되고 있습니다. 이러한 효율화 요인들이 결합되어 5G 기술 시장 전체에서 대상 수요가 확대되고, 부품 공급업체의 규모의 경제가 강화되고 있습니다.
분산된 주파수 대역 할당
지역별로 일관성 없는 주파수 대역 계획으로 인해 OEM 각사는 멀티밴드 지원 기기 제조를 강요받고 있으며, 이로 인해 BOM 비용이 증가하고 규모의 경제 효과가 둔화되고 있습니다. 국경을 넘는 트럭 운송 경로에서는 사용자 기기가 호환되지 않는 통신 사업자 간을 이동할 때 로밍 문제가 발생합니다. 막대한 자금이 소요되는 주파수 경매로 인해 주파수 대역은 기존 사업자에 의해 독점되고 있으며, 서비스가 미흡한 지방 지역에서의 경쟁적인 인프라 구축이 저해되고 있습니다. 고도의 간섭 조정은 계획의 복잡성을 가중시켜, 스몰셀 고밀도화 비용을 상승시키고 있습니다. 이러한 마찰 요인들이 구축 속도를 둔화시키고 있지만, WRC-23에 기반한 규제 조화 노력을 통해 향후 10년 내에 격차 축소를 목표로 하고 있습니다.
부문 분석
2025년, 통신 사업자들이 전국 확장을 위해 무선 유닛, 안테나, 전송 라우터를 조달한 결과, 하드웨어는 5G 기술 시장 점유율의 47.55%를 차지했습니다. 고출력 매시브 MIMO 무선 기기 및 광섬유 백홀 회선에는 여전히 자본이 유입되고 있지만, 전년 대비 성장률은 정체 상태에 있습니다. 통신 사업자들이 오케스트레이션, 클라우드 관리, 네트워크 슬라이스 수익화를 외부에 위탁함에 따라 서비스 수익은 연평균 성장률(CAGR) 19.55%로 확대되고 있습니다. 현재 벤더의 로드맵에는 도입, 최적화 및 구독형 분석 기능이 포함되어 있어, 일회성 하드웨어 거래가 지속적인 수익원으로 전환되고 있습니다. Open-RAN을 통한 디스어그리게이션으로 통신 사업자는 한 공급업체의 베이스밴드 소프트웨어와 다른 공급업체의 무선 장치를 결합할 수 있게 되어, 기존의 벤더 락인이 해소되고 있습니다. 각 하이퍼스케일러 기업은 트래픽 유도 및 정책 제어를 구독형 소프트웨어로 전환하는 통신 사업자용 클라우드 플랫폼을 제공하며 경쟁을 심화시키고 있습니다.
5G 기술 시장에서는 이종 장비를 통합하고, 지속적인 소프트웨어 릴리스를 관리하며, SLA에 기반하여 KPI를 보장하는 통합업체에 대한 평가가 점점 더 높아지고 있습니다. 이에 반해 하드웨어 벤더들은 AI 가속기, 통합 백홀, 원격 전기식 틸트 제어 기능을 탑재하여 시장 점유율을 지키려 하고 있습니다. 한편, 지역 타워 기업들은 중립적 호스트 인프라 위에 관리형 서비스를 중첩하여 기업 및 MVNO에 모듈식 진입점을 제공합니다. 서비스로의 전환은 생태계 참여를 확대하는 한편, 책임 소재를 분산시키고 상호 운용성 테스트에 드는 오버헤드를 증가시키고 있습니다.
2025년에는 우수한 전파 전파 특성과 기존 매크로 그리드 사이트의 재사용이 가능하다는 점 덕분에 6GHz 미만의 자산이 5G 기술 시장 규모의 60.70%를 차지했습니다. 미드밴드는 100-200 MHz의 연속 대역폭과 킬로미터 단위의 도달 거리를 균형 있게 제공하여 전국적인 커버리지에 최적입니다. 그러나 통신 사업자들은 400 MHz 폭의 mm파 채널을 하이브리드 방식으로 중첩시켜 도시 지역의 통신 용량을 확보하려고 하고 있으며, 이로 인해 혼합 구축의 연평균 성장률(CAGR)은 20.95%에 달하고 있습니다. 빔 스티어링 기능을 갖춘 mm파 스몰 셀이 가로등이나 버스 정류장 대합실에 설치되어, 경기장 관중이나 고정 무선을 이용하는 가정의 트래픽을 오프로드하고 있습니다.
동적 스펙트럼 공유(DSS)는 미사용 LTE 캐리어를 5G용으로 재사용하여 주파수 경매로 인한 가격 급등의 영향을 완화합니다. 미국의 CBRS와 유럽의 공유 액세스 프레임워크를 통해 공장 및 항만 내 기업용 마이크로 네트워크가 실현됩니다. 규제 당국이 6GHz 대역의 상위 미드밴드 조화를 도모하는 가운데, 기기 제조업체들은 원활한 로밍을 가능하게 하는 트리플 밴드 모뎀을 설계하고 있습니다. 이 진화 로드맵에 따르면, Sub-6GHz 대역이 전국 규모의 모빌리티를 지원하는 한편, mm파 및 향후 테라헤르츠 대역의 할당은 핫스팟에서 기가비트급 처리량을 지원하여 5G 기술 시장 전반에 걸친 계층적인 스펙트럼 전략을 구축하게 될 것입니다.
지역별 분석
아시아태평양은 단호한 정부 정책, 통신 사업자의 규모, 그리고 활기찬 기기 생태계의 뒷받침을 받아 2025년에는 5G 기술 시장의 41.05%를 차지했습니다. 중국은 2024년에 100만 개 이상의 5G 기지국을 증설하고, 제조 측면의 시너지 효과를 활용하여 노드당 비용을 절감했습니다. 한국은 상용 SA(스탠드얼론) 커버리지에서 선두를 달리고 있으며, 클라우드 게임 패스와 VR 콘서트의 수익화를 추진하고 있습니다. 일본에서는 여러 통신 사업자의 RAN 공유를 통해 중복성이 감소하고, 고속철도 연선의 통신 영역 확대가 가속화되고 있습니다. 인도에서는 2024년에 실시된 190억 달러 규모의 주파수 경매를 계기로, 통신 사업자들이 중립 호스트 타워 및 네트워크 공유에 관한 양해각서(MOU)를 통해 설비 투자(CAPEX) 최적화를 추진하고 있습니다. 아세안(ASEAN) 국가들은 다자간 융자를 활용하여 수출 지향형 산업단지를 건설하고 있으며, 이는 5G 기술 시장 전체의 지역 수요를 끌어올리고 있습니다.
북미는 FCC의 ‘5G FAST 플랜’에 따라 해제된 중파 대역 주파수를 선행 도입 기업들이 활용함에 따라 매출액 기준 2위를 기록하고 있습니다. 경기장에서의 mm파 오버레이는 라이브 동영상 스트리밍을 위한 멀티 기가비트급 업링크를 제공하는 반면, 지방의 고정 무선은 라스트 마일 광대역에서 광섬유를 대체하는 역할을 하고 있습니다. 미국의 물류, 석유화학, 의료 분야 기업들은 데이터 주권 요건을 충족하기 위해 로컬 브레이크아웃 에지 노드를 갖춘 프라이빗 슬라이스의 시범 운영을 진행하고 있습니다. 캐나다에서는 주파수 대역 개방과 타워 공유 의무화를 조율하여 인구 밀도가 낮은 지역의 인프라 구축 비용을 합리화하고 있습니다. 멕시코는 국경을 초월한 밸류체인을 활용하여 마키라도라 공장 내에 5G 로봇을 도입하고 있으며, 이는 라틴아메리카에서 싹트기 시작한 5G 기술 시장에 미치는 파급 효과를 보여줍니다.
유럽에서는 ‘디지털 데케이드(Digital Decade)’의 벤치마크와 그린 딜(Green Deal)의 에너지 규제에 힘입어 꾸준한 보급이 진행되고 있습니다. 독일의 자동차 산업 클러스터에서는 정밀 용접 및 배터리 셀 조립을 위해 캠퍼스 네트워크를 구축하고 있습니다. 북유럽 국가들에서는 재생에너지로 가동되는 기지국과 AI 기반 슬립 모드 스케줄러를 통합하여 에너지 집약도를 낮추고 있습니다. 국경을 넘는 화물 운송 회랑에서는 지속적인 URLLC 커버리지를 유지하기 위해 여러 사업자가 참여하는 엣지 로밍 시범 운영이 진행되고 있습니다. GDPR(EU 개인정보보호규정) 등 데이터 개인정보 보호법은 공급업체 선정 및 암호화 정책 수립을 촉진하여 규정 준수 부담을 가중시키고 있습니다. 전반적으로, 규제의 예측 가능성과 지속가능성에 대한 우선순위가 전 세계 5G 기술 시장에서 유럽만의 독자적인 궤적을 형성하고 있습니다.
기타 혜택:
- 엑셀 형식 시장 예측(ME) 시트
- 3개월간의 애널리스트 지원
자주 묻는 질문
목차
제1장 서론
제2장 조사 방법
제3장 주요 요약
제4장 시장 구도
제5장 시장 규모와 성장 예측
제6장 경쟁 구도
제7장 시장 기회와 향후 전망
LSH 26.09.14According to Mordor Intelligence, the 5G technology market size is expected to grow from USD 195.43 billion in 2025 to USD 231.15 billion in 2026 and is forecast to reach USD 534.43 billion by 2031 at 18.26% CAGR over 2026-2031.
This report is Segmented by Component (Hardware, Software, Services), Spectrum Band (Sub-6 GHz, Mmwave, Hybrid), Application (eMBB, FWA, MMTC, URLLC), End-User Industry (Consumer, Manufacturing, and More), Network Architecture (Stand-Alone, Non-Stand-Alone), and Geography. The Market Forecasts are Provided in Terms of Value (USD).
Global 5G Technology Market Trends and Insights
Sustained Increase in Connected Devices
Cellular IoT connections are projected to surpass 5.9 billion by 2030, intensifying capacity requirements on public and private networks . Manufacturing plants are scaling predictive maintenance and automated inspection, while smart-city traffic and environmental sensors multiply data flows. Edge compute caches time-critical analytics locally, lowering backhaul loads and reducing latency. Private networks are displacing Wi-Fi inside hazardous facilities where deterministic performance and intrinsic security are mandatory. This device surge drives compounding data traffic that underpins sustained spending across radio, transport, and cloud domains in the 5G technology market.
Component-Level Cost Reductions in RF Front-End and SiGe Power Amplifiers
Silicon-germanium power-amplifier innovations have cut manufacturing costs by nearly 30% since 2024, lowering price points for mid-tier 5G smartphones and CPEs. Advanced multi-chip packaging integrates filters, LNAs, and switches, improving yields and shrinking board footprints. As gallium-arsenide alternatives migrate to CMOS processes, Sub-6 GHz radio units balance performance with affordability for emerging-market carriers. Supply-chain diversification away from single-source foundries is spurring competitive bids that further compress equipment capex. Collectively, these efficiencies expand addressable demand and reinforce scale advantages for component suppliers throughout the 5G technology market.
Fragmented Spectrum Allocations
Incoherent regional band plans oblige OEMs to produce multiband devices, inflate BOM costs, and slow scale economics. Cross-border trucking corridors suffer roaming glitches when user equipment hops between mismatched carriers. Cash-intensive auctions lock spectrum behind incumbents, dampening competitive build-outs in underserved rural pockets. Advanced interference coordination adds planning complexity and pushes small-cell densification costs higher. These friction points temper deployment velocity, although regulatory harmonization initiatives under WRC-23 aim to narrow gaps over the next decade.
Other drivers and restraints analyzed in the detailed report include:
- Superior Latency and Bandwidth Performance Versus 4G Networks
- Rise of Virtualized and Cloud-Native 5G Cores
- Energy Consumption Per Bit Versus Sustainability Targets
For complete list of drivers and restraints, kindly check the Table Of Contents.
Segment Analysis
Hardware captured 47.55% of the 5G technology market share in 2025 as operators procured radio units, antennas, and transport routers for nationwide roll-outs. High-power massive-MIMO radios and fiber backhaul lines continue to attract capital, yet year-on-year growth is plateauing. Services revenue is expanding 19.55% CAGR as operators outsource orchestration, cloud management, and network-slice monetization. Vendor roadmaps now bundle installation, optimization, and subscription-based analytics that convert one-time hardware deals into annuities. Open-RAN disaggregation lets carriers mix baseband software from one supplier with radios from another, eroding traditional vendor lock-ins. Hyperscalers deliver telco cloud platforms that shift traffic steering and policy control into subscription software, intensifying competition.
The 5G technology market increasingly rewards integrators that bridge heterogeneous gear, manage continuous software releases, and guarantee KPIs under SLAs. Hardware vendors respond by embedding AI accelerators, integrated backhaul, and remote-electrical-tilt controls to defend their share. Meanwhile, regional tower companies layer managed services on neutral host infrastructure, giving enterprises and MVNOs modular entry points. The pivot to services broadens ecosystem participation, but also fragments accountability, raising interoperability testing overhead.
Sub-6 GHz assets constituted 60.70% of the 5G technology market size in 2025 due to favorable propagation and reuse of existing macro-grid sites. Mid-band delivers a balance of 100-200 MHz contiguous bandwidth with kilometer-scale reach, ideal for nationwide coverage. Operators, however, chase urban capacity through hybrid layering of 400 MHz-wide mmWave channels, propelling a 20.95% CAGR for mixed deployments. Beam-steered mmWave small cells pop up on streetlights and transit shelters to offload stadium crowds and fixed-wireless households.
Dynamic spectrum sharing (DSS) repurposes idle LTE carriers for 5G, mitigating auction sticker shock. U.S. CBRS and European shared-access frameworks unlock enterprise micro-networks inside factories and ports. As regulators harmonize the 6 GHz upper mid-band, device makers are designing triple-band modems to roam seamlessly. The evolutionary roadmap suggests Sub-6 GHz anchors nationwide mobility, while mmWave and future terahertz allocations address hot-spot Gigabit throughput, creating a layered spectrum strategy across the 5G technology market.
Complete Report Scope:
- By Component
- Hardware
- Software
- Services
- By Spectrum Band
- Sub-6 GHz
- mmWave
- Hybrid (Sub-6+mmWave)
- By Application
- eMBB
- FWA
- mMTC
- URLLC
- By End-User Industry
- Consumer
- Manufacturing
- Healthcare
- Automotive
- Energy and Utilities
- Media and Entertainment
- Public Safety and Defense
- By Network Architecture
- Stand-Alone (SA)
- Non-Stand-Alone (NSA)
- By Geography
- North America
- United States
- Canada
- Mexico
- South America
- Brazil
- Argentina
- Rest of South America
- Europe
- Germany
- United Kingdom
- France
- Italy
- Spain
- Russia
- Rest of Europe
- Asia Pacific
- China
- Japan
- India
- South Korea
- Australia and New Zealand
- Rest of Asia Pacific
- Middle East
- GCC
- Turkey
- Rest of Middle East
- Africa
- South Africa
- Nigeria
- Rest of Africa
- North America
Geography Analysis
Asia Pacific held 41.05% of the 5G technology market in 2025, fueled by decisive government policies, operator scale, and vibrant device ecosystems. China added over 1 million 5G base stations in 2024, capturing manufacturing synergies and reducing per-node costs. South Korea leads commercial SA coverage, monetizing cloud gaming passes and VR concerts. Japan's multi-operator RAN sharing lowers redundancy and accelerates coverage along high-speed rail lines. India's USD 19 billion spectrum auction in 2024 pushed carriers to optimize capex through neutral-host towers and network-sharing MOUs. ASEAN countries leverage multilateral financing to build export-oriented industrial parks, boosting regional demand across the 5G technology market.
North America ranks second by revenue as early movers exploit mid-band spectrum cleared under the FCC's 5G FAST Plan. Stadium mmWave overlays deliver multi-gigabit uplinks for live video, while rural fixed wireless substitutes fiber for last-mile broadband. The US enterprises in logistics, petrochemicals, and healthcare pilot private slices with local breakout edge nodes to satisfy data-sovereignty requirements. Canada coordinates spectrum releases and tower-sharing mandates that rationalize build-out costs across sparsely populated territories. Mexico taps cross-border value chains to adopt 5G robotics inside maquiladora plants, illustrating spill-over effects into Latin America's nascent 5G technology market.
Europe records consistent uptake backed by Digital Decade benchmarks and green-deal energy mandates. Germany's automotive clusters orchestrate campus networks for precision welding and battery-cell assembly. The Nordics integrate renewable-powered base stations and AI sleep-mode schedulers to shrink energy intensity. Cross-border freight corridors pilot multi-operator edge roaming to maintain continuous URLLC coverage. Data privacy laws such as GDPR drive selective vendor sourcing and encryption policies, elevating compliance overhead. Overall, regulatory predictability and sustainability priorities shape Europe's differentiated trajectory within the global 5G technology market.
- Huawei Technologies Co., Ltd.
- Telefonaktiebolaget LM Ericsson (Ericsson)
- Nokia Corporation
- Qualcomm Incorporated
- Samsung Electronics Co., Ltd.
- ZTE Corporation
- Intel Corporation
- MediaTek Inc.
- Cisco Systems, Inc.
- NEC Corporation
- Fujitsu Limited
- CommScope Holding Company, Inc.
- Apple Inc.
- Skyworks solutions, Inc.
- Analog Devices, Inc.
- Juniper Networks, Inc.
- Mavenir plc
- Parallel Wireless Inc.
Additional Benefits:
- The market estimate (ME) sheet in Excel format
- 3 months of analyst support
TABLE OF CONTENTS
1 INTRODUCTION
- 1.1 Study Assumptions and Market Definition
- 1.2 Scope of the Study
2 RESEARCH METHODOLOGY
3 EXECUTIVE SUMMARY
4 MARKET LANDSCAPE
- 4.1 Market Overview
- 4.2 Market Drivers
- 4.2.1 Sustained increase in connected devices
- 4.2.2 Component-level cost reductions (RF-front end, SiGe PAs)
- 4.2.3 Superior latency and bandwidth versus 4G
- 4.2.4 Rise of virtualized and cloud-native cores
- 4.2.5 Open-RAN capex savings in emerging markets
- 4.2.6 Spectrum-sharing frameworks unlocking rural coverage
- 4.3 Market Restraints
- 4.3.1 Fragmented spectrum allocations
- 4.3.2 Energy consumption per bit vs sustainability targets
- 4.3.3 Security liabilities in hyper-dense networks
- 4.3.4 Persistent standards delays beyond 3GPP Rel-19
- 4.4 5G Timeline and Evolution
- 4.5 Current Adoption Cycle (Forerunners, Adopters and Laggards)
- 4.6 Value Chain Analysis
- 4.7 Regulatory and Policy Landscape
- 4.8 Technological Outlook
- 4.9 Porter's Five Forces Analysis
- 4.9.1 Threat of New Entrants
- 4.9.2 Bargaining Power of Suppliers
- 4.9.3 Bargaining Power of Buyers
- 4.9.4 Threat of Substitutes
- 4.9.5 Competitive Rivalry
- 4.10 5G and Beyond (6G Pathways)
- 4.11 Impact of Macroeconomic Factors on the Market
5 MARKET SIZE AND GROWTH FORECASTS (VALUE)
- 5.1 By Component
- 5.1.1 Hardware
- 5.1.2 Software
- 5.1.3 Services
- 5.2 By Spectrum Band
- 5.2.1 Sub-6 GHz
- 5.2.2 mmWave
- 5.2.3 Hybrid (Sub-6+mmWave)
- 5.3 By Application
- 5.3.1 eMBB
- 5.3.2 FWA
- 5.3.3 mMTC
- 5.3.4 URLLC
- 5.4 By End-User Industry
- 5.4.1 Consumer
- 5.4.2 Manufacturing
- 5.4.3 Healthcare
- 5.4.4 Automotive
- 5.4.5 Energy and Utilities
- 5.4.6 Media and Entertainment
- 5.4.7 Public Safety and Defense
- 5.5 By Network Architecture
- 5.5.1 Stand-Alone (SA)
- 5.5.2 Non-Stand-Alone (NSA)
- 5.6 By Geography
- 5.6.1 North America
- 5.6.1.1 United States
- 5.6.1.2 Canada
- 5.6.1.3 Mexico
- 5.6.2 South America
- 5.6.2.1 Brazil
- 5.6.2.2 Argentina
- 5.6.2.3 Rest of South America
- 5.6.3 Europe
- 5.6.3.1 Germany
- 5.6.3.2 United Kingdom
- 5.6.3.3 France
- 5.6.3.4 Italy
- 5.6.3.5 Spain
- 5.6.3.6 Russia
- 5.6.3.7 Rest of Europe
- 5.6.4 Asia Pacific
- 5.6.4.1 China
- 5.6.4.2 Japan
- 5.6.4.3 India
- 5.6.4.4 South Korea
- 5.6.4.5 Australia and New Zealand
- 5.6.4.6 Rest of Asia Pacific
- 5.6.5 Middle East
- 5.6.5.1 GCC
- 5.6.5.2 Turkey
- 5.6.5.3 Rest of Middle East
- 5.6.6 Africa
- 5.6.6.1 South Africa
- 5.6.6.2 Nigeria
- 5.6.6.3 Rest of Africa
- 5.6.1 North America
6 COMPETITIVE LANDSCAPE
- 6.1 Market Concentration
- 6.2 Strategic Moves
- 6.3 Market Share Analysis
- 6.4 Company Profiles (includes Global level Overview, Market level overview, Core Segments, Financials as available, Strategic Information, Market Rank/Share for key companies, Products and Services, and Recent Developments)
- 6.4.1 Huawei Technologies Co., Ltd.
- 6.4.2 Telefonaktiebolaget LM Ericsson (Ericsson)
- 6.4.3 Nokia Corporation
- 6.4.4 Qualcomm Incorporated
- 6.4.5 Samsung Electronics Co., Ltd.
- 6.4.6 ZTE Corporation
- 6.4.7 Intel Corporation
- 6.4.8 MediaTek Inc.
- 6.4.9 Cisco Systems, Inc.
- 6.4.10 NEC Corporation
- 6.4.11 Fujitsu Limited
- 6.4.12 CommScope Holding Company, Inc.
- 6.4.13 Apple Inc.
- 6.4.14 Skyworks solutions, Inc.
- 6.4.15 Analog Devices, Inc.
- 6.4.16 Juniper Networks, Inc.
- 6.4.17 Mavenir plc
- 6.4.18 Parallel Wireless Inc.
7 MARKET OPPORTUNITIES AND FUTURE OUTLOOK
- 7.1 White-space and Unmet-Need Assessment


